. 2020 Apr 15;10(1):6452.
doi: 10.1038/s41598-020-63571-x.

Southward shift of precipitation extremes over south Asia: Evidences from CORDEX data

Affiliations

Southward shift of precipitation extremes over south Asia: Evidences from CORDEX data

Mayank Suman et al. Sci Rep. .

Abstract

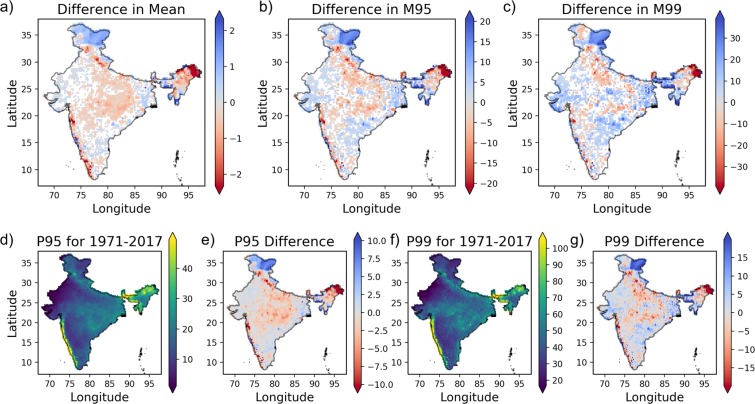
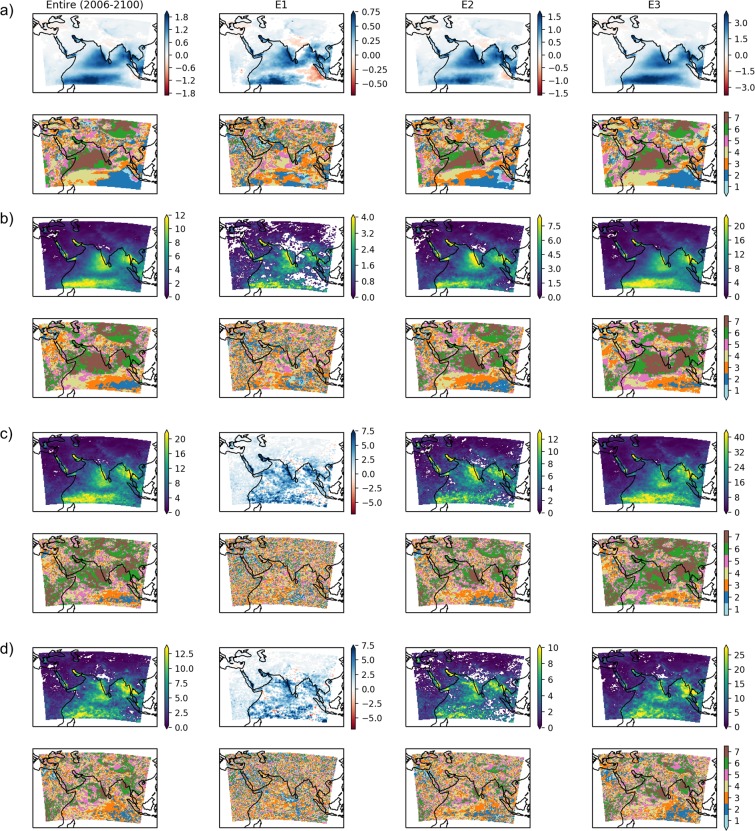
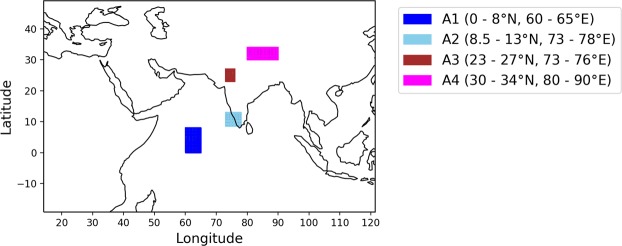
Analysis of observed Indian Summer Monsoon precipitation reveals more increase in extreme precipitation (in terms of its magnitude) over south India compared to north and central India during 1971-2017 (base period: 1930-1970). In the future, analysis of precipitation from the Coordinated Regional Downscaling Experiment indicates a southward shift of precipitation extremes over South Asia. For instance, the Arabian Sea, south India, Myanmar, Thailand, and Malaysia are expected to have the maximum increase (~18.5 mm/day for RCP8.5 scenario) in mean extreme precipitation (average precipitation for the days with more than 99th percentile of daily precipitation). However, north and central India and Tibetan Plateau show relatively less increase (~2.7 mm/day for RCP8.5 scenario). Analysis of air temperature at 850 mb and precipitable water (RCP4.5 and RCP8.5) indicates an intensification of Indian Ocean Dipole in future, which will enhance the monsoon throughout India. Moisture flux and convergence analysis (at 850 mb) show a future change of the direction of south-west monsoon winds towards the east over the Indian Ocean. These changes will intensify the observed contrast in extreme precipitation between south and north India, and cause more extreme precipitation events in the countries like Myanmar, Thailand, Malaysia, etc.


Conflict of interest statement

The authors declare no competing interests.

Figures

Figure 1
Figure 1
Observed ISMR characteristics. Difference in (a) mean daily precipitation, (b) M95, and (c) M99 (in mm/day) between 1971–2017 and 1930–1970. (d) 95th percentile of observed precipitation (in mm/day) during 1971–2017 and (e) its difference with respect to 1930–1970. Similar figures (f,g) for P99. Colored patches inside Indian landmass in figures (a–c) are having statistically significant change.
Figure 2
Figure 2
Characteristics of ensemble mean precipitation under RCP8.5 and RCP4.5. Difference between future and historical (1961–2005) precipitation (mm/day) (a, top row) in mean, (b, top row) in M95, and (c, top row) in M99 for RCP8.5. Four columns indicate the entire future period (2006–2100) and three epochs: E1 (2006–2035), E2 (2036–2070), and E3 (2071–2100). (d, top row): Same as (c, top row) but for RCP4.5. Areas showing no significant change are shown in white patches. Different epochs are studied apart from the entire future period to investigate the temporal variation of change. (a-d, bottom row): Spatial distribution of the number of CORDEX models in agreement with the nature of change, i.e., increasing, decreasing, or no significant change.
Figure 3
Figure 3
Ensemble mean P99 and P95 (in mm/day) for future (2006–2100) as compared to historical period (1961–2005). (a) P99 for historical period. (b) Change in P99 in future as compared to historical values for RCP4.5 scenario (c) same as (b) but for RCP8.5 (d) Difference of P99 for RCP8.5 and RCP4.5 scenario (e–h) Same as (a–d) but for P95.
Figure 4
Figure 4
Selected key regions for analyzing the changes in ISMR. The regions are selected based on different characteristics shown by them for change in M99 and M95. For instance, A1 (part of the Arabian Sea) and A2 (part of south India) show a high increase in M95 and M99, and A3 (part of north India) and A4 (Tibetan Plateau) show relatively less increase in M95 and M99.
Figure 5
Figure 5
Possible causes of change in precipitation in the future. Difference in (a) mean air temperature (in °C) at 850mbar and (b) vertically integrated precipitable water (kg/m2) between future (2006–2100; RCP8.5) and HIST (1961–2005). (c) Difference in mean moisture flux (in g kg−1ms−1) and moisture convergence (in g/Kg−1ms−1 per degree) at 850 mbar between RCP8.5 and RCP4.5 scenarios. Difference in mean condition of moisture flux and moisture convergence between different periods in future (RCP8.5) and HIST by considering (d) all months (e) monsoon months (JJAS). Similarly, difference in mean condition of moisture flux and moisture convergence during days with extreme precipitation ( P99) for different epochs and mean condition in HIST at region (f) A2, (g) A3, and (h) A4. For figures (c–h) the arrow length and direction show magnitude and direction of moisture flux respectively at 850 mbar. Only the regions with significant changes are shown.
Figure 6
Figure 6
Change in moisture flux and moisture convergence using ERA-Interim data. Difference in mean moisture flux (in g kg−1ms−1) and moisture convergence (in g/Kg−1ms−1 per degree) at 850mbar (with respect to 1979 to 2000) for (a) 2001 to 2018 (b) 2001 to 2010 (c) 2011 to 2018 considering data from all months. The figures (d,e,f) are similar to (a,c,d) but are for monsoon months (JJAS) only. The length and direction of arrows show magnitude and direction of moisture flux, respectively at 850mbar. Only the regions with significant changes are shown.

References

    1. De Souza, K. et al. Vulnerability to climate change in three hot spots in Africa and Asia: Key issues for policy-relevant adaptation and resilience-building research. (2015).
    1. Qiu J. China: The third pole. Nature News. 2008;454:393–396. doi: 10.1038/454393a. - DOI - PubMed
    1. Ghosh S, Das D, Kao S-C, Ganguly AR. Lack of uniform trends but increasing spatial variability in observed Indian rainfall extremes. Nature Climate Change. 2012;2:86. doi: 10.1038/nclimate1327. - DOI
    1. Kitoh A, et al. Monsoons in a changing world: A regional perspective in a global context. Journal of Geophysical Research: Atmospheres. 2013;118:3053–3065.
    1. Krishnan R, et al. Deciphering the desiccation trend of the south Asian monsoon hydroclimate in a warming world. Climate dynamics. 2016;47:1007–1027. doi: 10.1007/s00382-015-2886-5. - DOI

Publication types