. 2020 Apr;580(7803):402-408.
doi: 10.1038/s41586-020-2188-x. Epub 2020 Apr 8.

A reference map of the human binary protein interactome

Katja Luck #  1   2   3 Dae-Kyum Kim #  1   4   5   6 Luke Lambourne #  1   2   3 Kerstin Spirohn #  1   2   3 Bridget E Begg  1   2   3 Wenting Bian  1   2   3 Ruth Brignall  1   2   3 Tiziana Cafarelli  1   2   3 Francisco J Campos-Laborie  7   8 Benoit Charloteaux  1   2   3 Dongsic Choi  9 Atina G Coté  1   4   5   6 Meaghan Daley  1   2   3 Steven Deimling  10 Alice Desbuleux  1   2   3   11 Amélie Dricot  1   2   3 Marinella Gebbia  1   4   5   6 Madeleine F Hardy  1   2   3 Nishka Kishore  1   4   5   6 Jennifer J Knapp  1   4   5   6 István A Kovács  1   12   13 Irma Lemmens  14   15 Miles W Mee  4   5   16 Joseph C Mellor  1   4   5   6   17 Carl Pollis  1   2   3 Carles Pons  18 Aaron D Richardson  1   2   3 Sadie Schlabach  1   2   3 Bridget Teeking  1   2   3 Anupama Yadav  1   2   3 Mariana Babor  1   4   5   6 Dawit Balcha  1   2   3 Omer Basha  19   20 Christian Bowman-Colin  2   3 Suet-Feung Chin  21 Soon Gang Choi  1   2   3 Claudia Colabella  22   23 Georges Coppin  1   2   3   11 Cassandra D'Amata  10 David De Ridder  1   2   3 Steffi De Rouck  14   15 Miquel Duran-Frigola  18 Hanane Ennajdaoui  1   4   5   6 Florian Goebels  4   5   16 Liana Goehring  2   3 Anjali Gopal  1   4   5   6 Ghazal Haddad  1   4   5   6 Elodie Hatchi  2   3 Mohamed Helmy  4   5   16 Yves Jacob  24   25 Yoseph Kassa  1   2   3 Serena Landini  2   3 Roujia Li  1   4   5   6 Natascha van Lieshout  1   4   5   6 Andrew MacWilliams  1   2   3 Dylan Markey  1   2   3 Joseph N Paulson  26   27   28 Sudharshan Rangarajan  1   2   3 John Rasla  1   2   3 Ashyad Rayhan  1   4   5   6 Thomas Rolland  1   2   3 Adriana San-Miguel  1   2   3 Yun Shen  1   2   3 Dayag Sheykhkarimli  1   4   5   6 Gloria M Sheynkman  1   2   3 Eyal Simonovsky  19   20 Murat Taşan  1   4   5   6   16 Alexander Tejeda  1   2   3 Vincent Tropepe  10 Jean-Claude Twizere  11 Yang Wang  1   2   3 Robert J Weatheritt  4 Jochen Weile  1   4   5   6   16 Yu Xia  1   29 Xinping Yang  1   2   3 Esti Yeger-Lotem  19   20 Quan Zhong  1   2   3   30 Patrick Aloy  18   31 Gary D Bader  4   5   16 Javier De Las Rivas  7   8 Suzanne Gaudet  1   2   3 Tong Hao  1   2   3 Janusz Rak  9 Jan Tavernier  14   15 David E Hill  32   33   34 Marc Vidal  35   36 Frederick P Roth  37   38   39   40   41   42 Michael A Calderwood  43   44   45
Affiliations

A reference map of the human binary protein interactome

Katja Luck et al. Nature. 2020 Apr.

Abstract

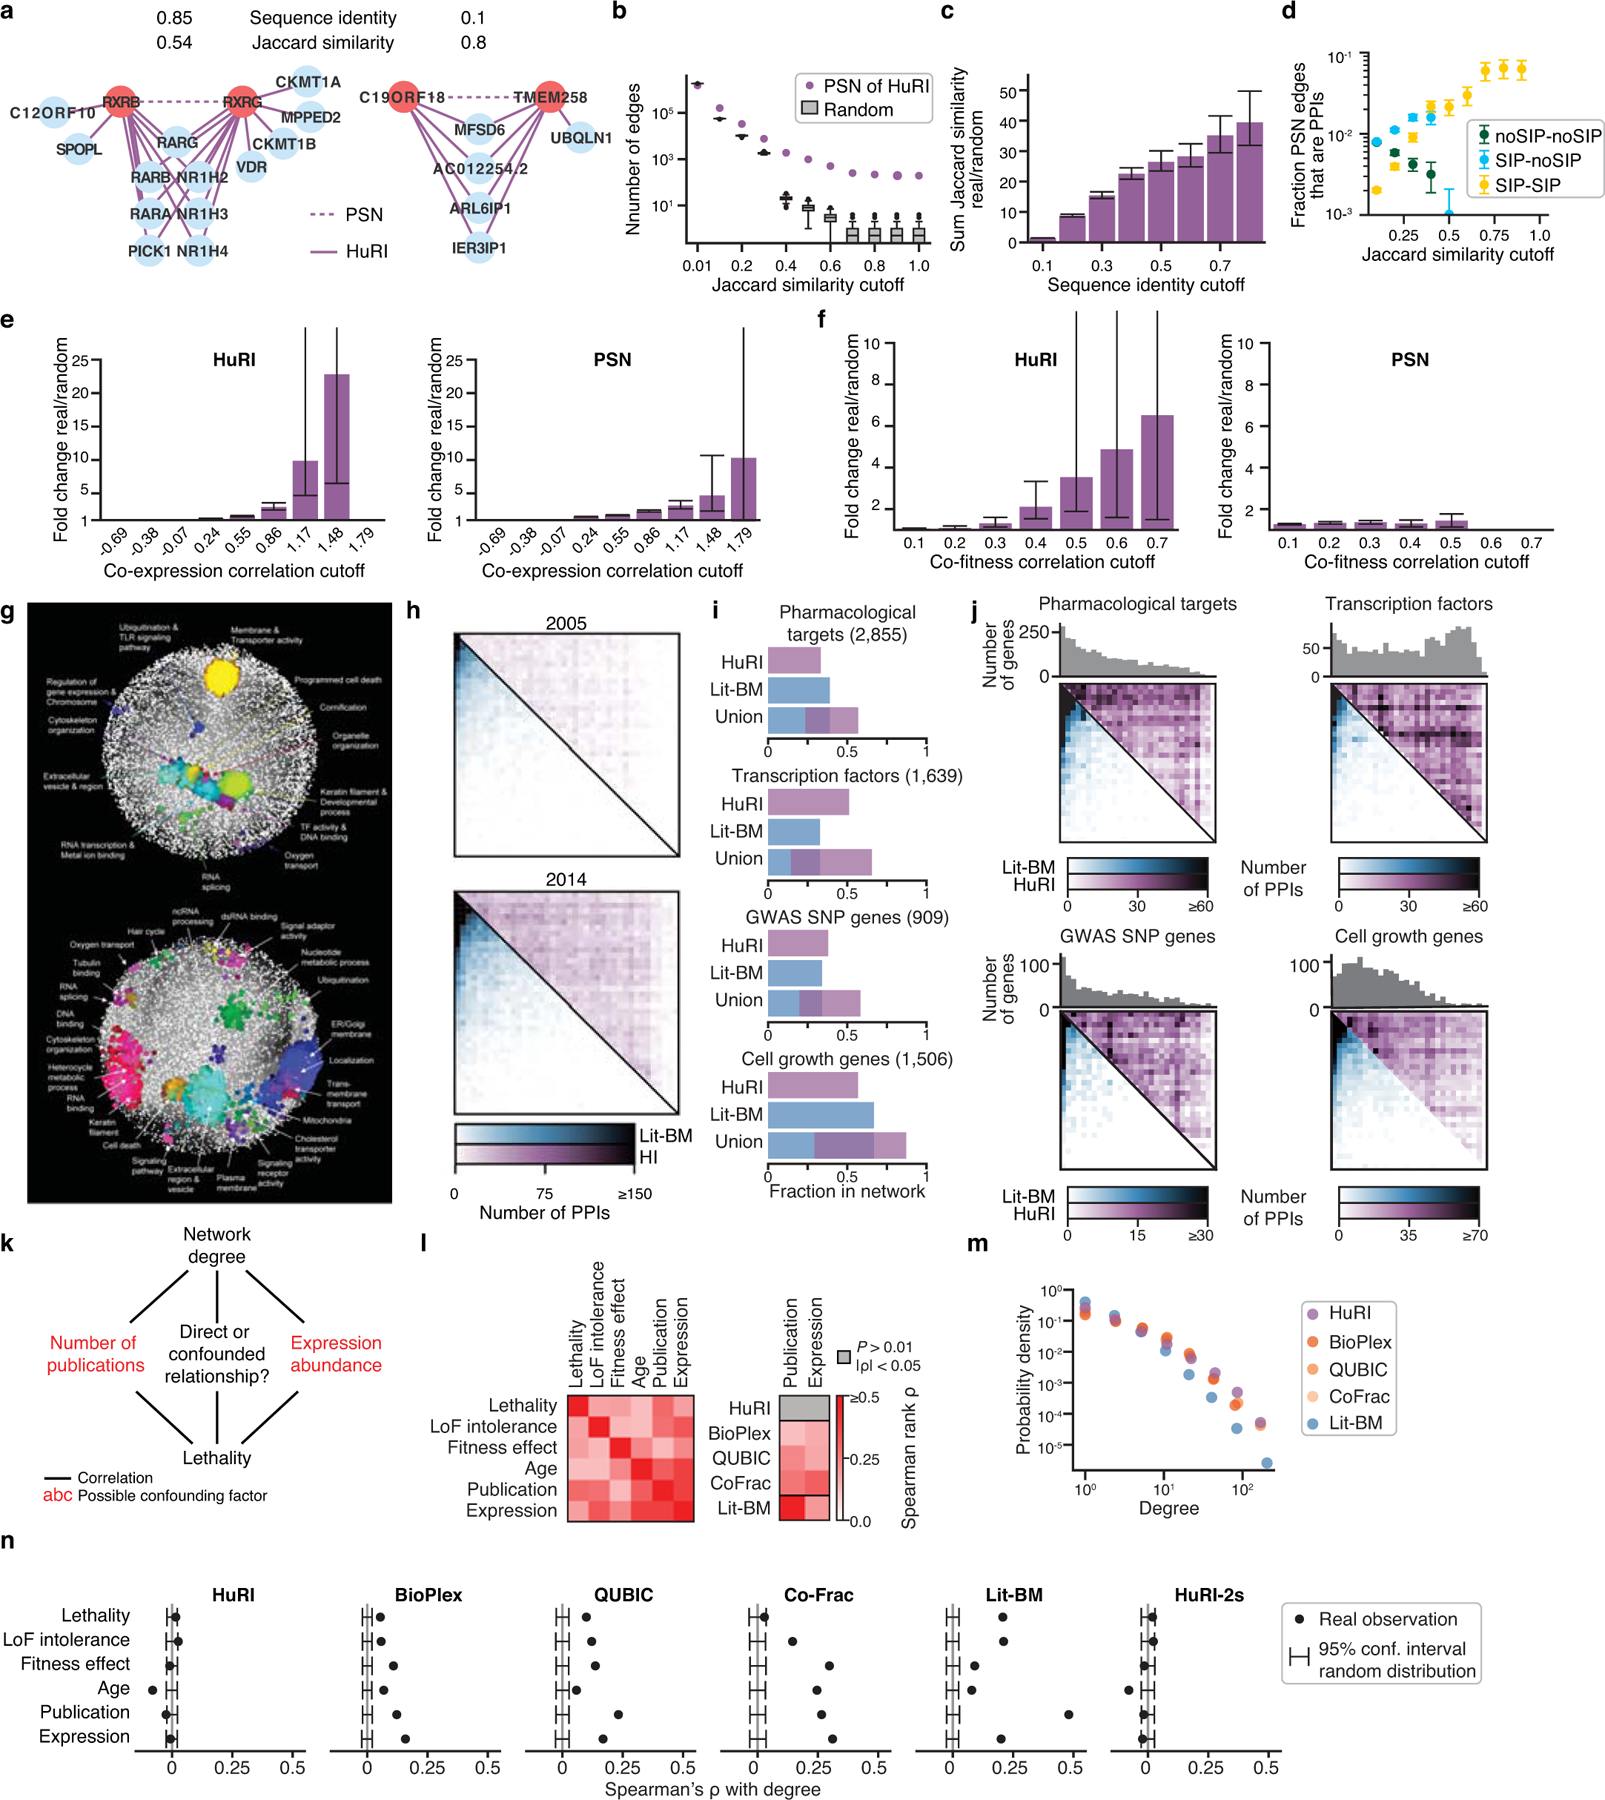
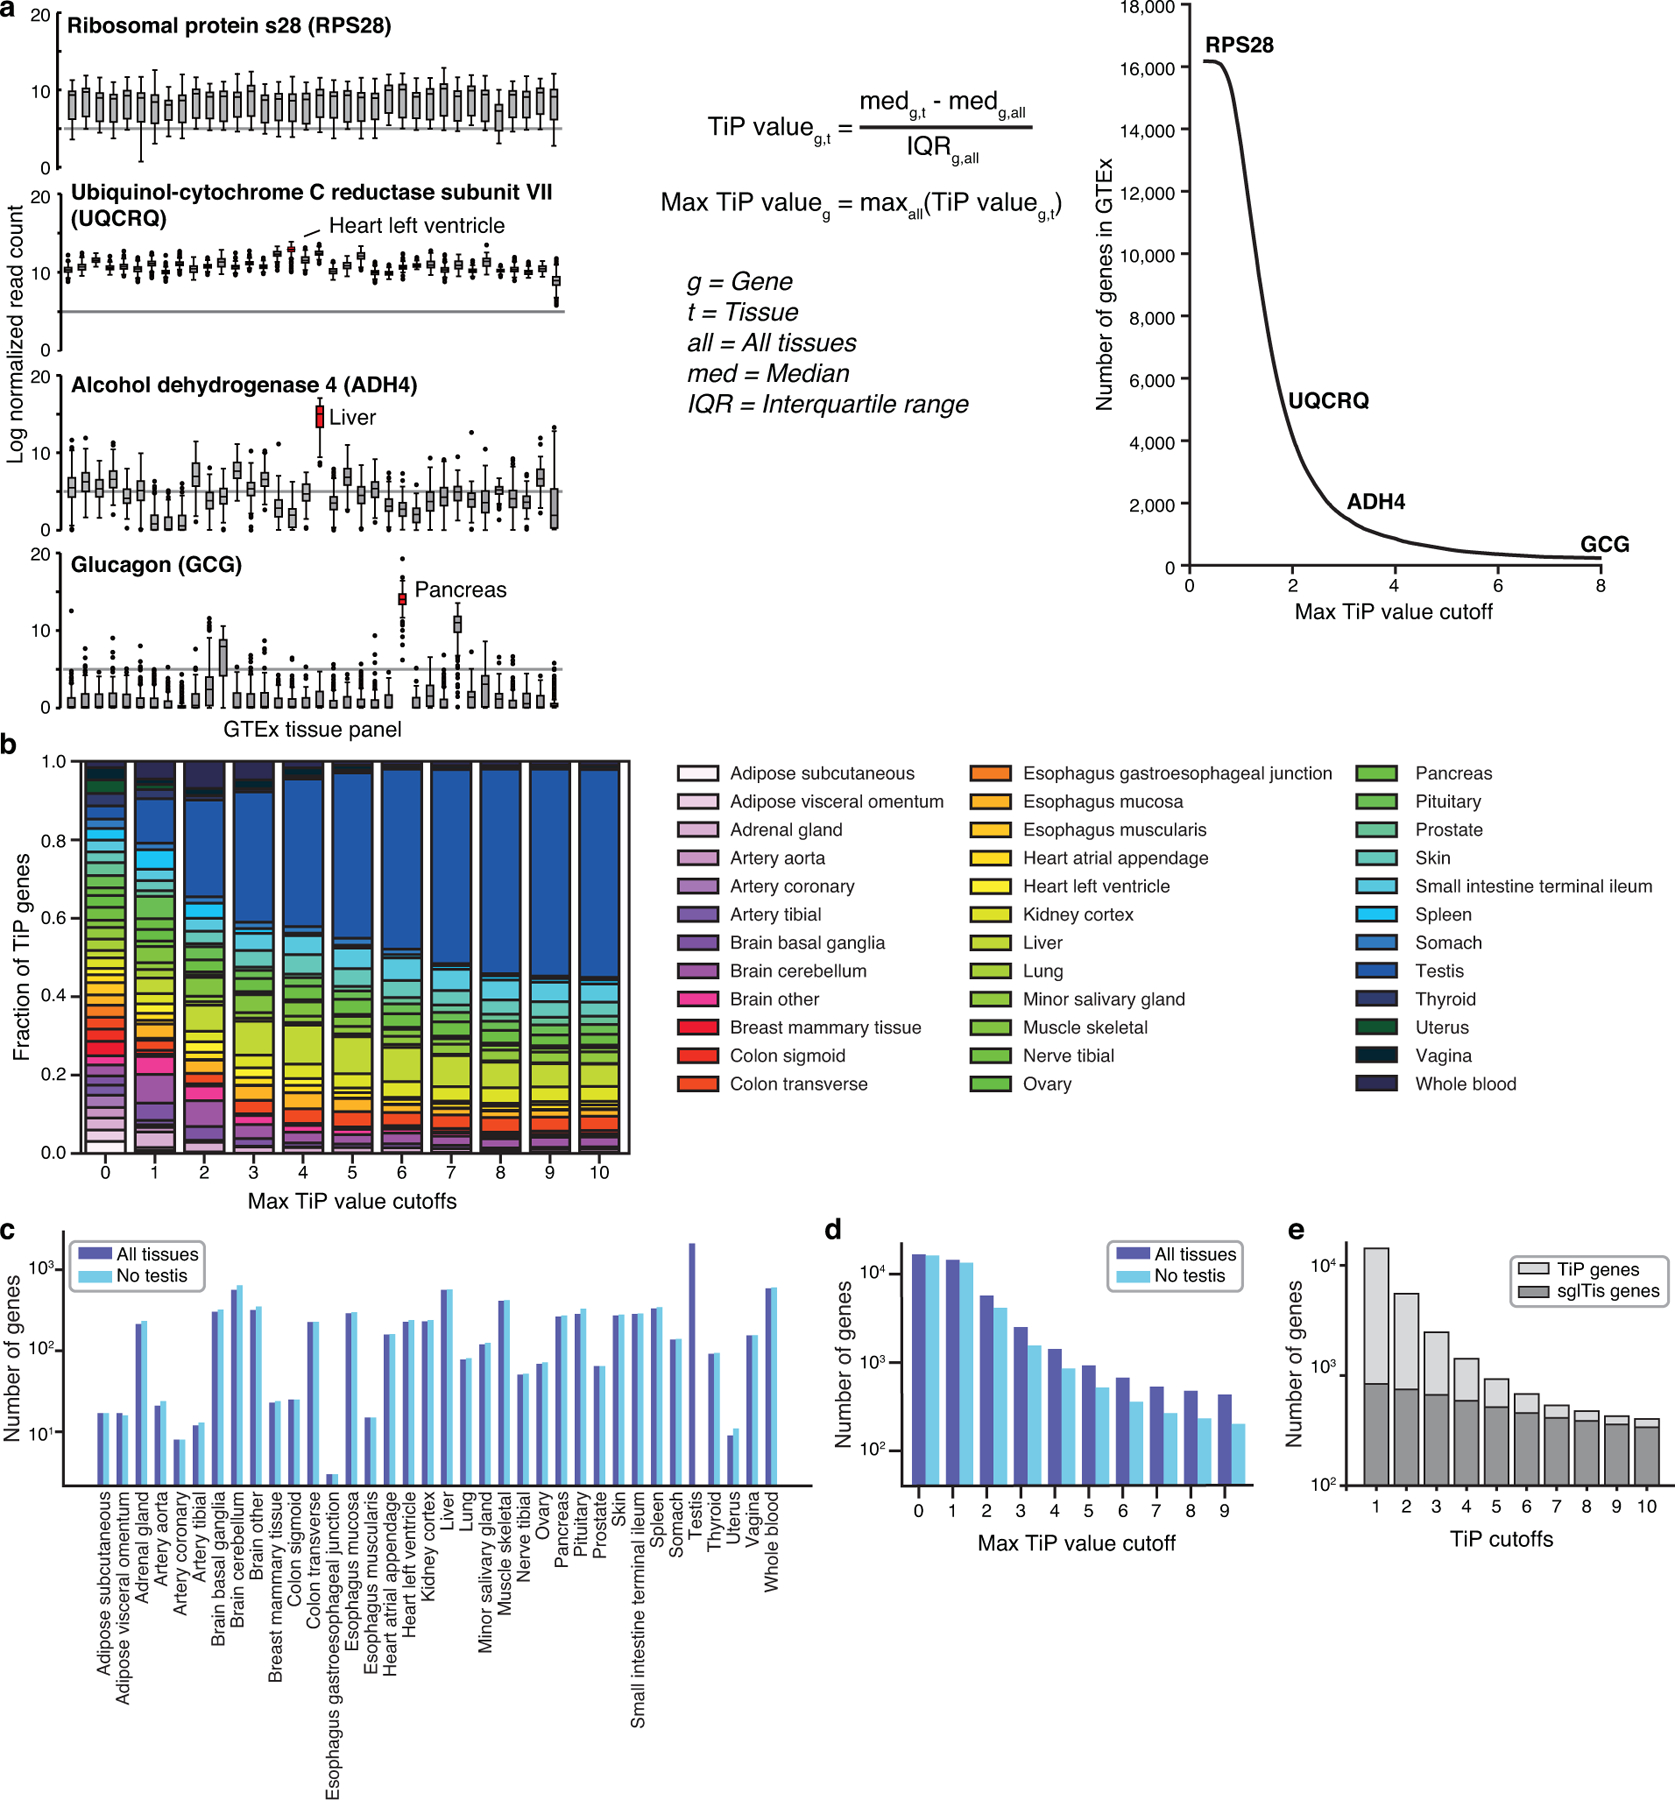
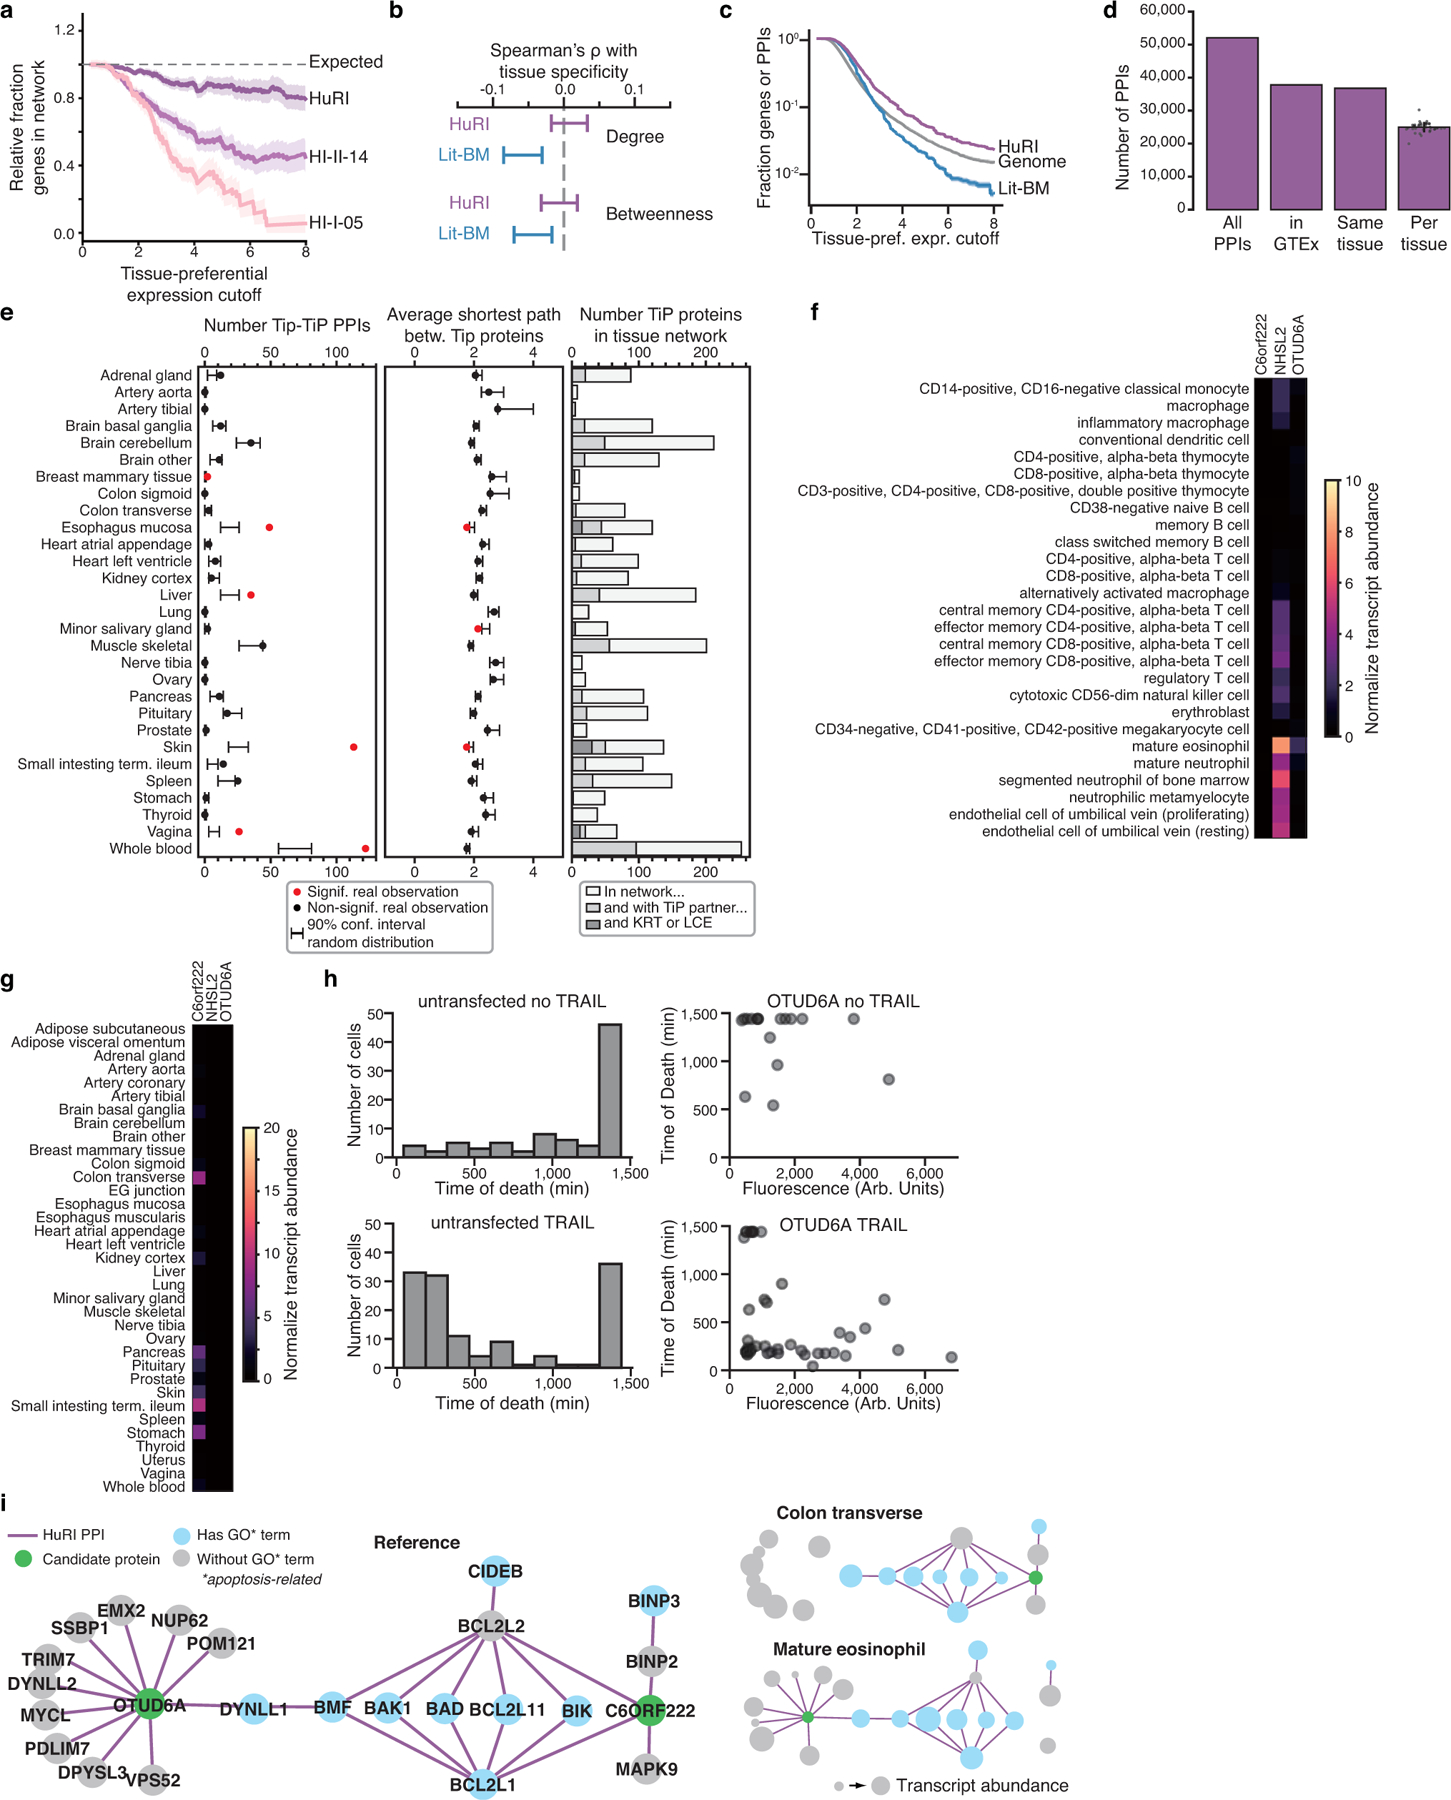
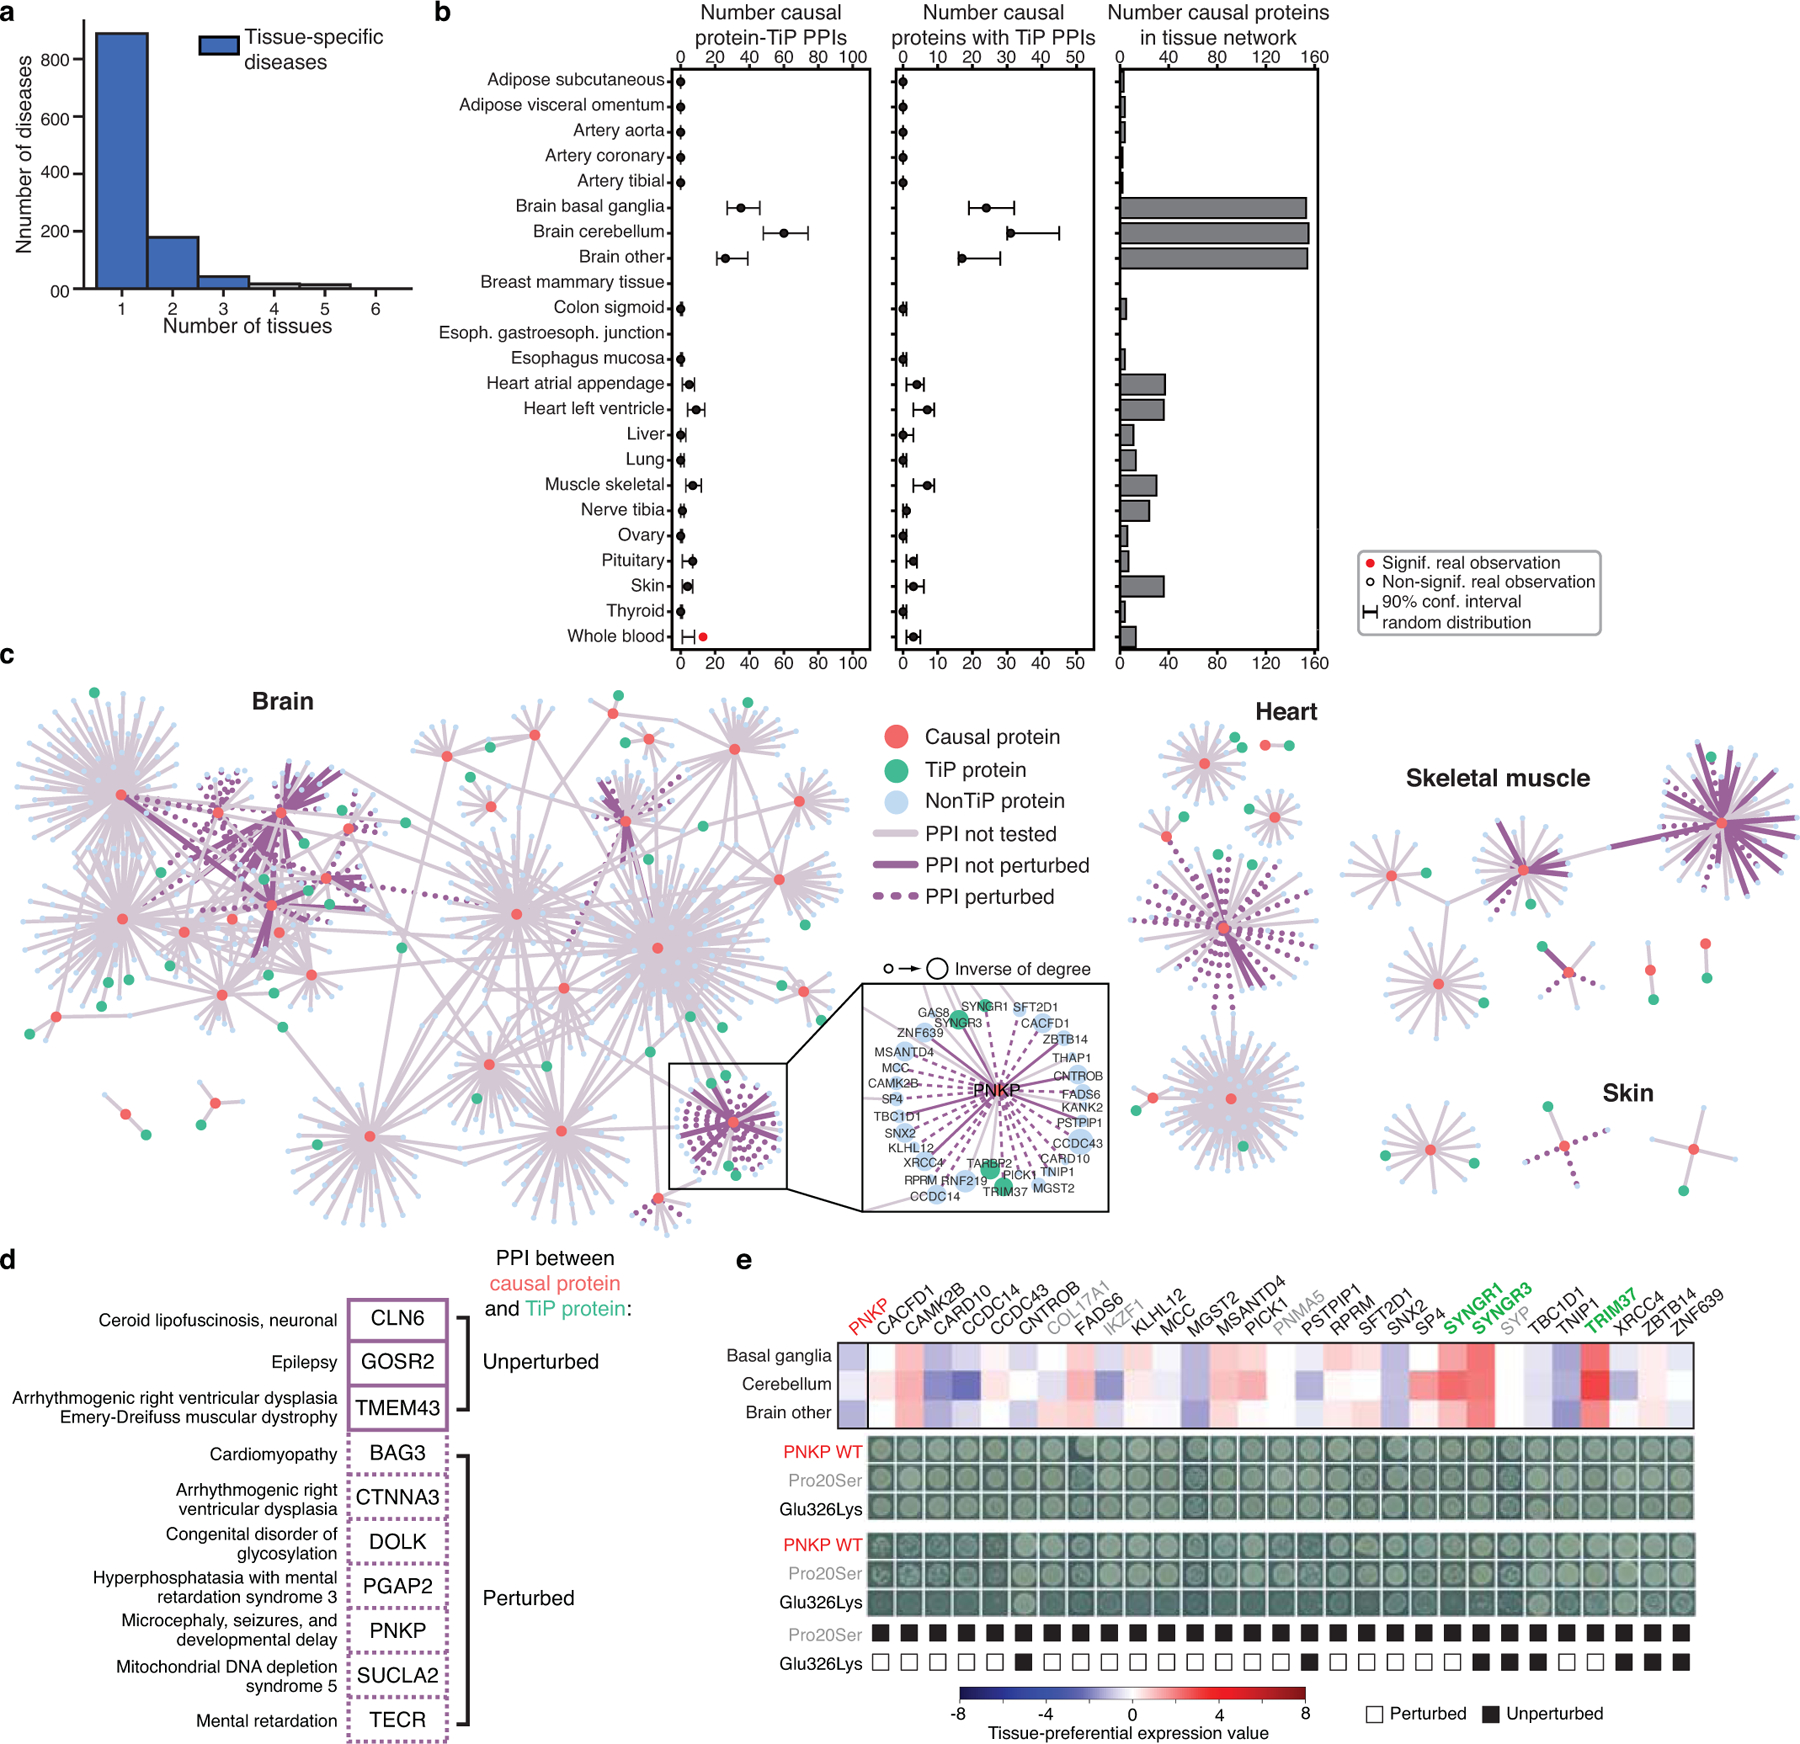
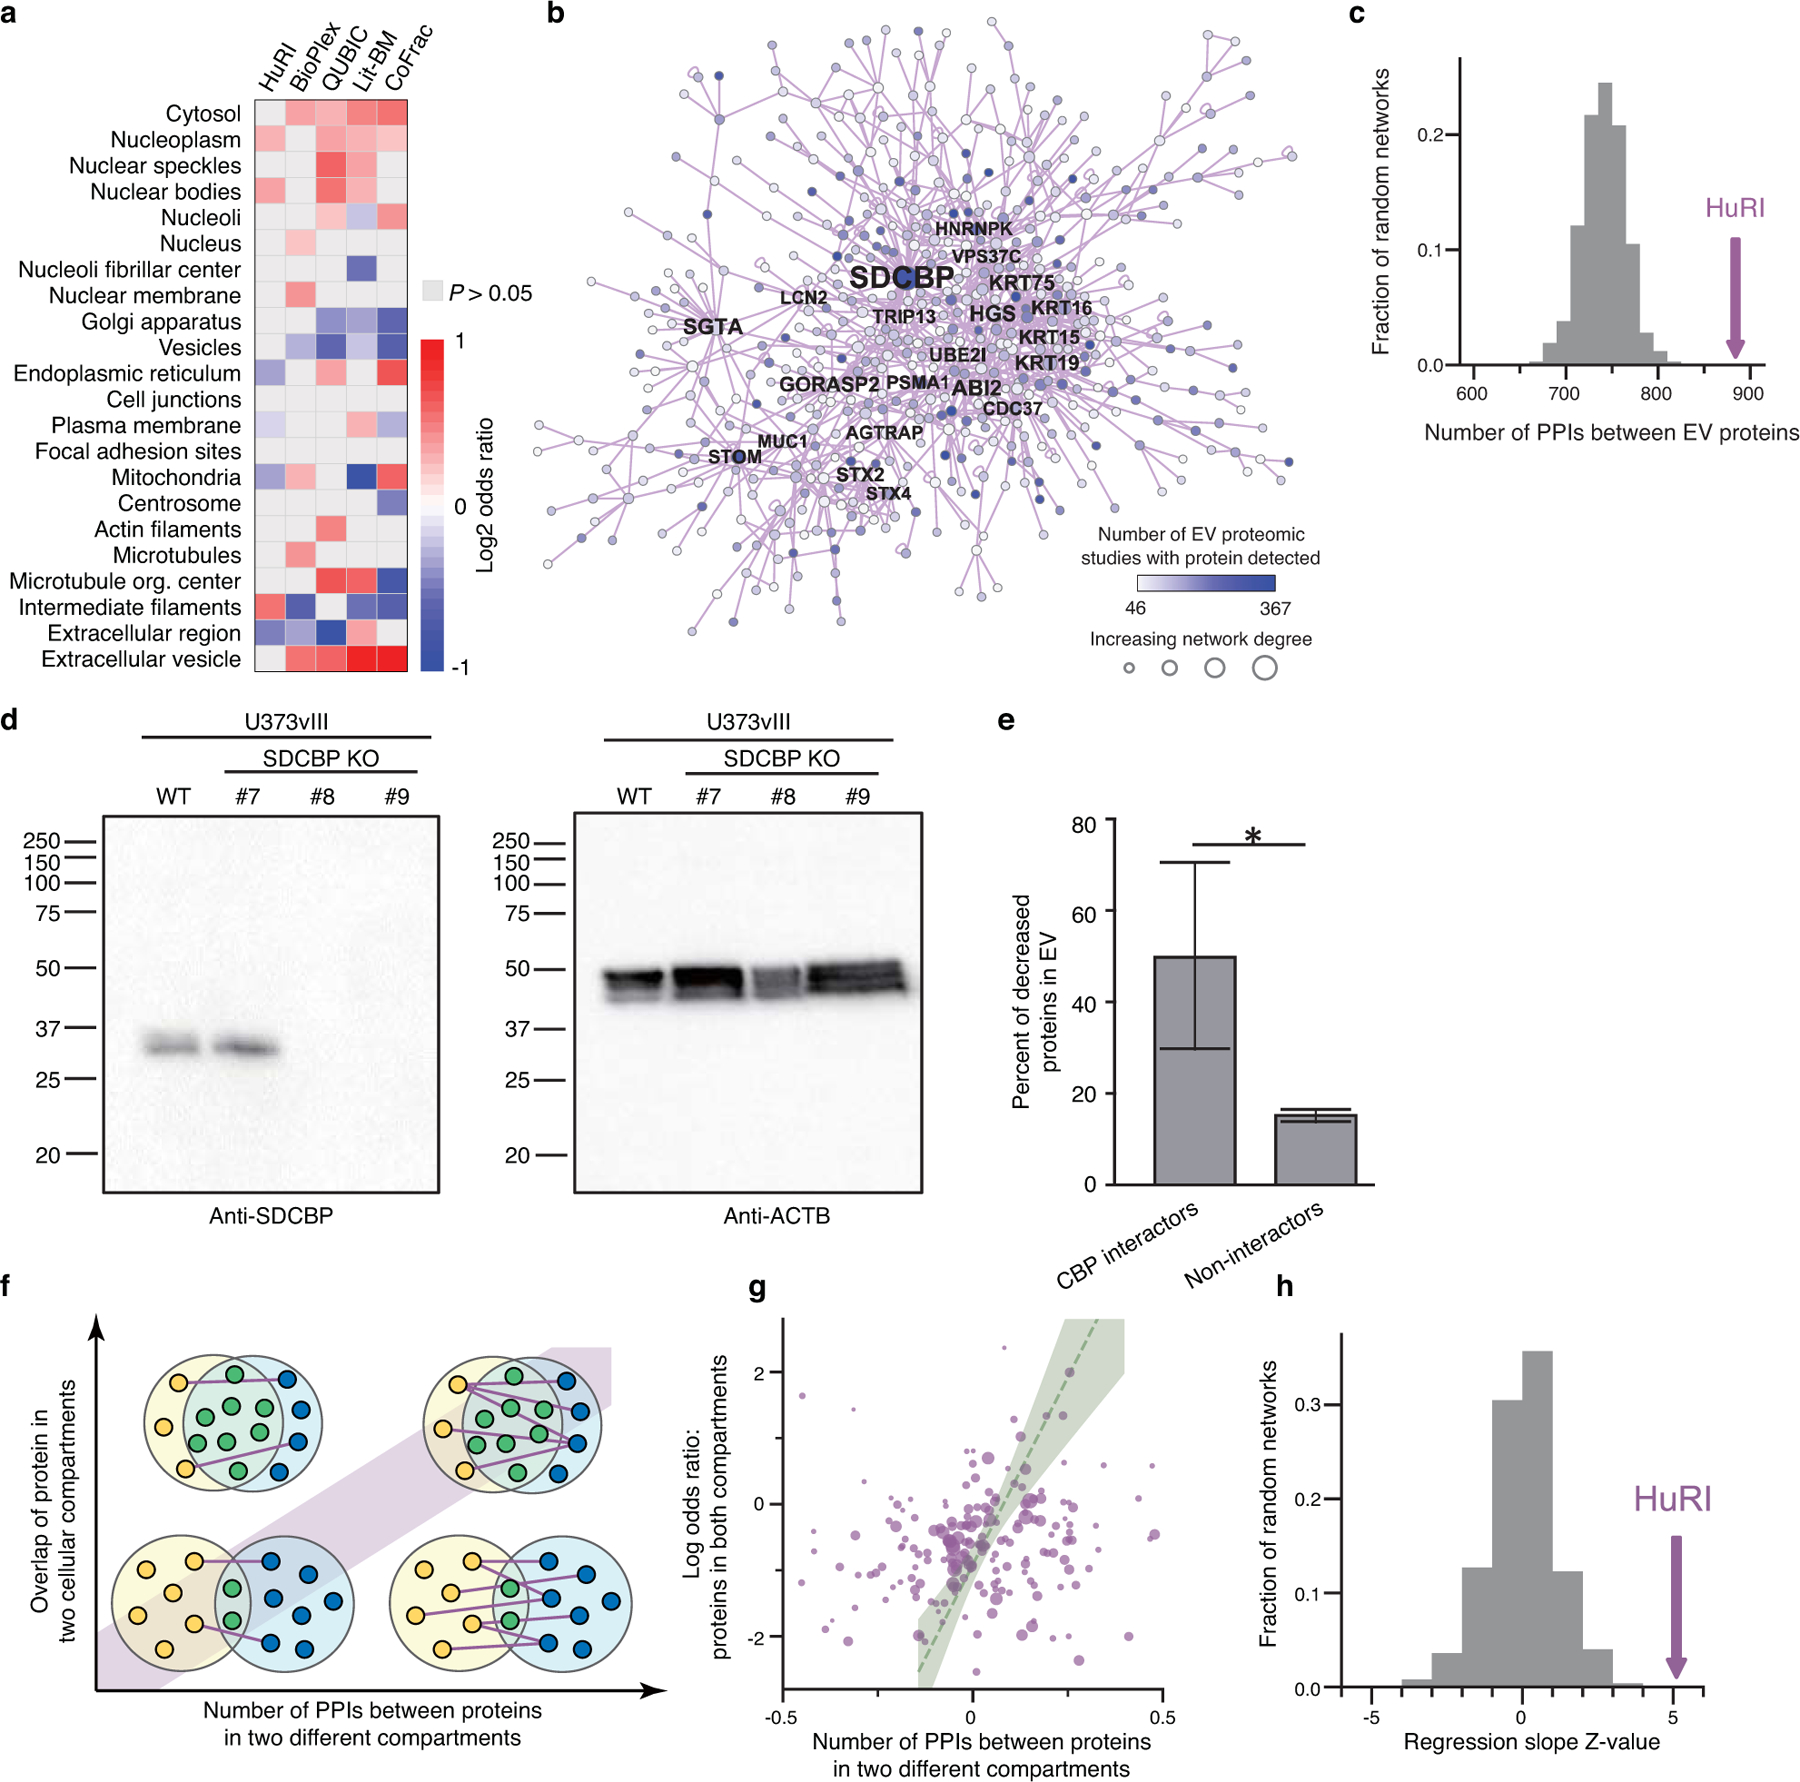
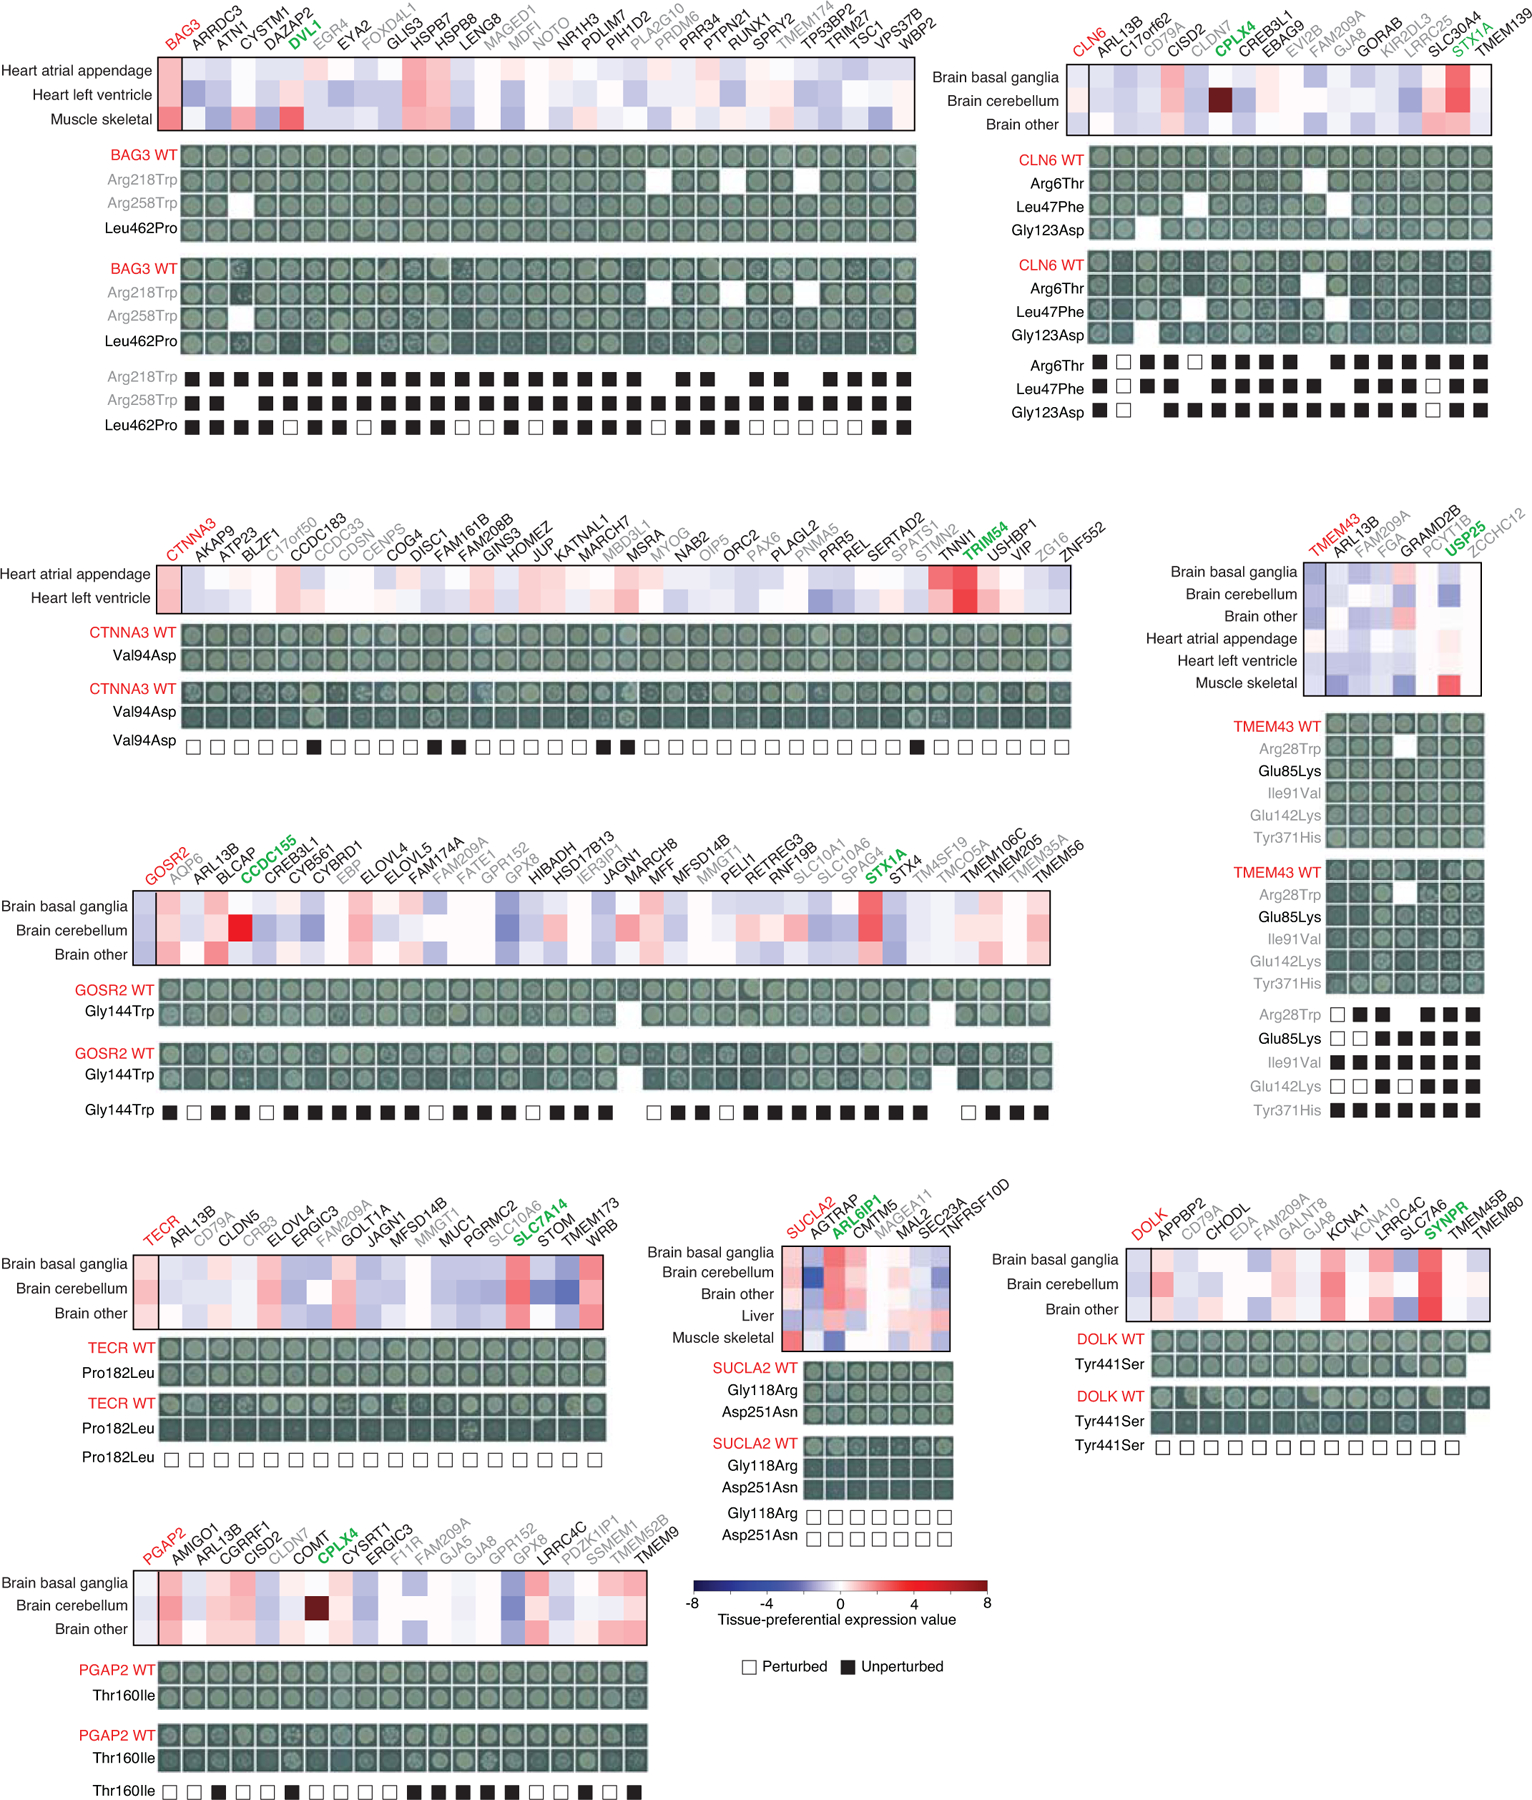
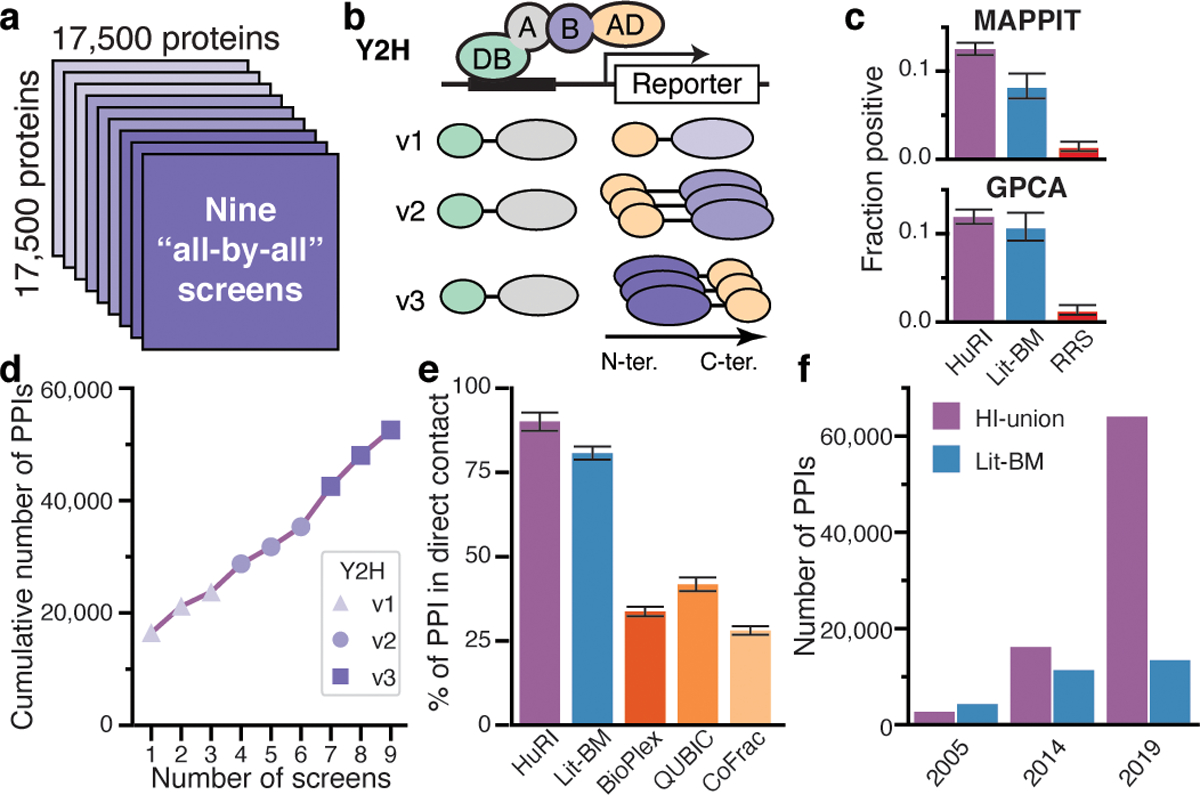
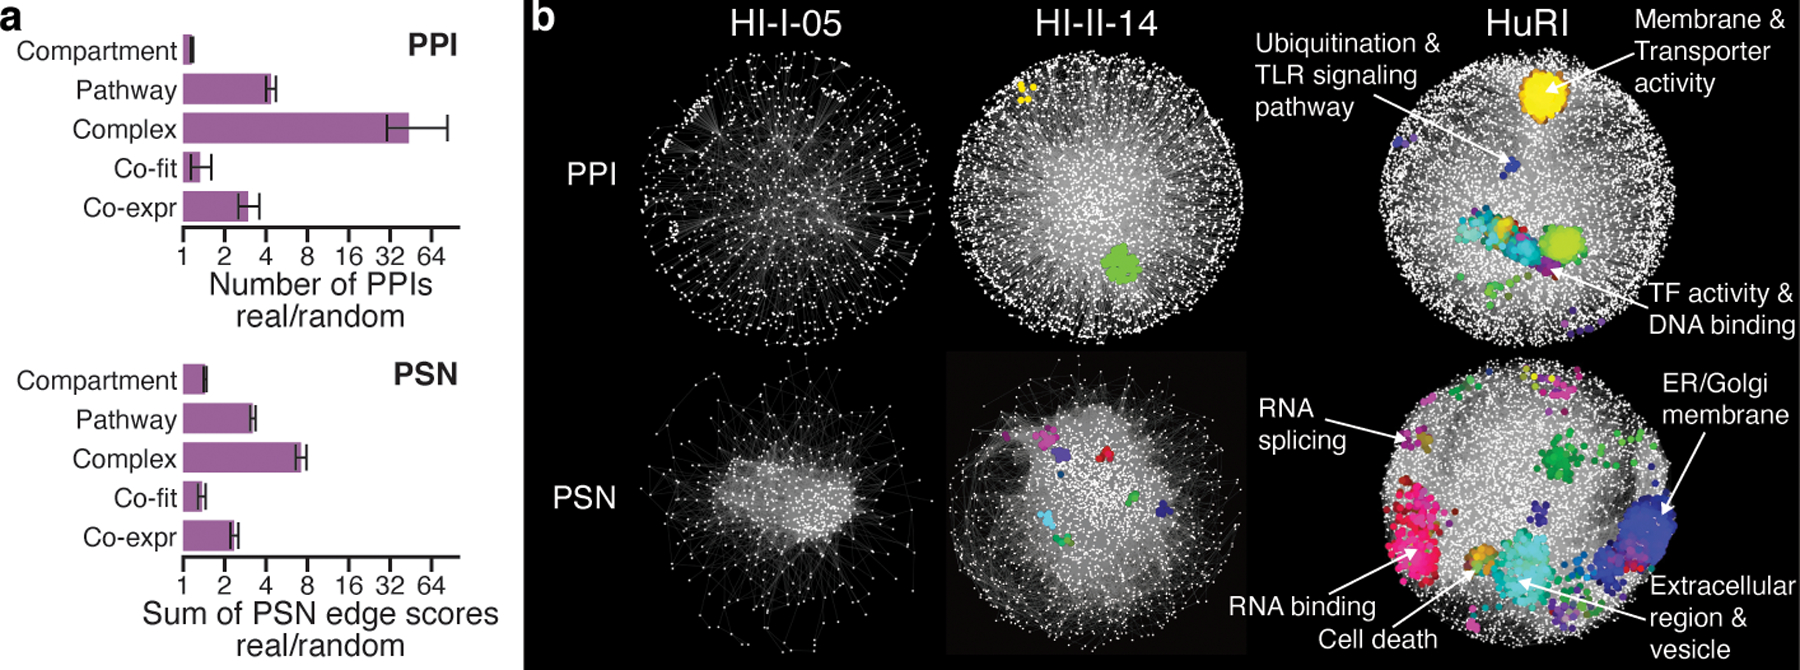
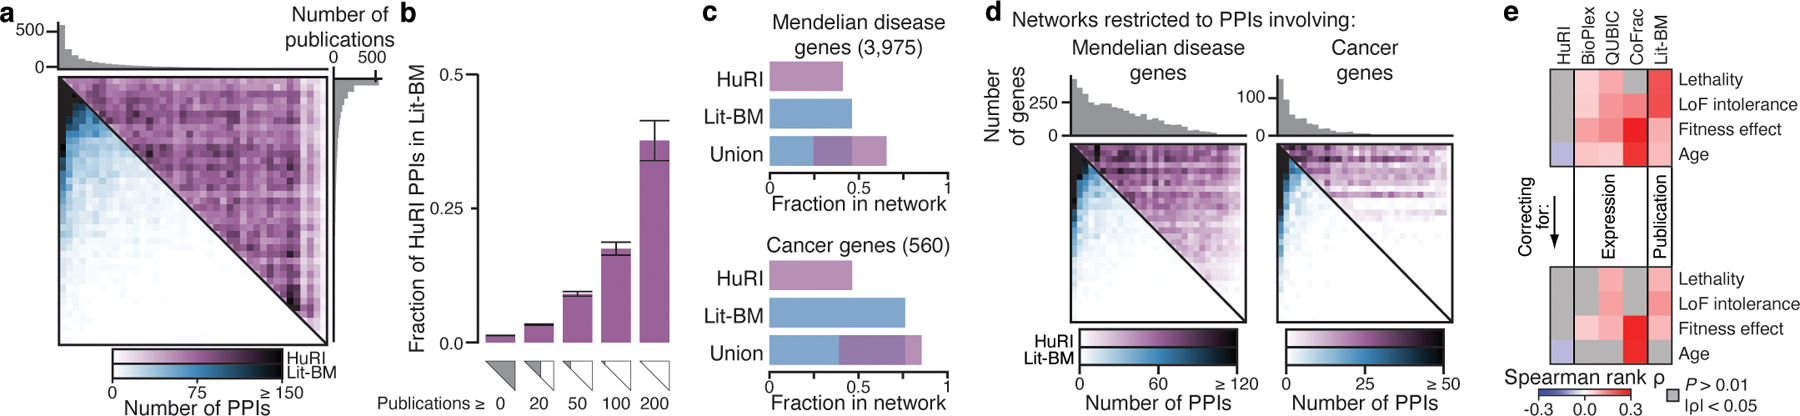
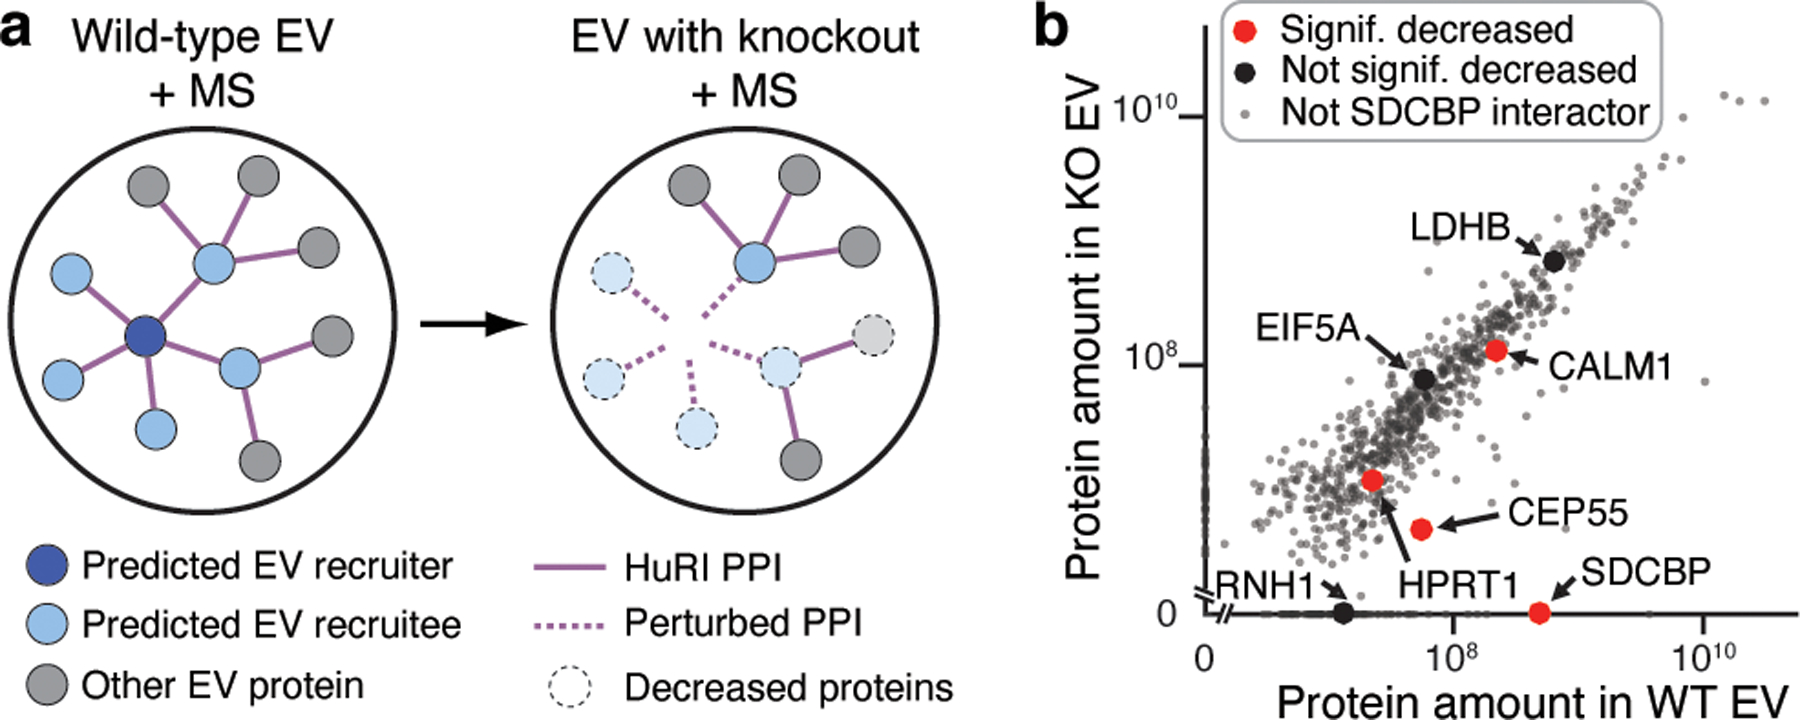
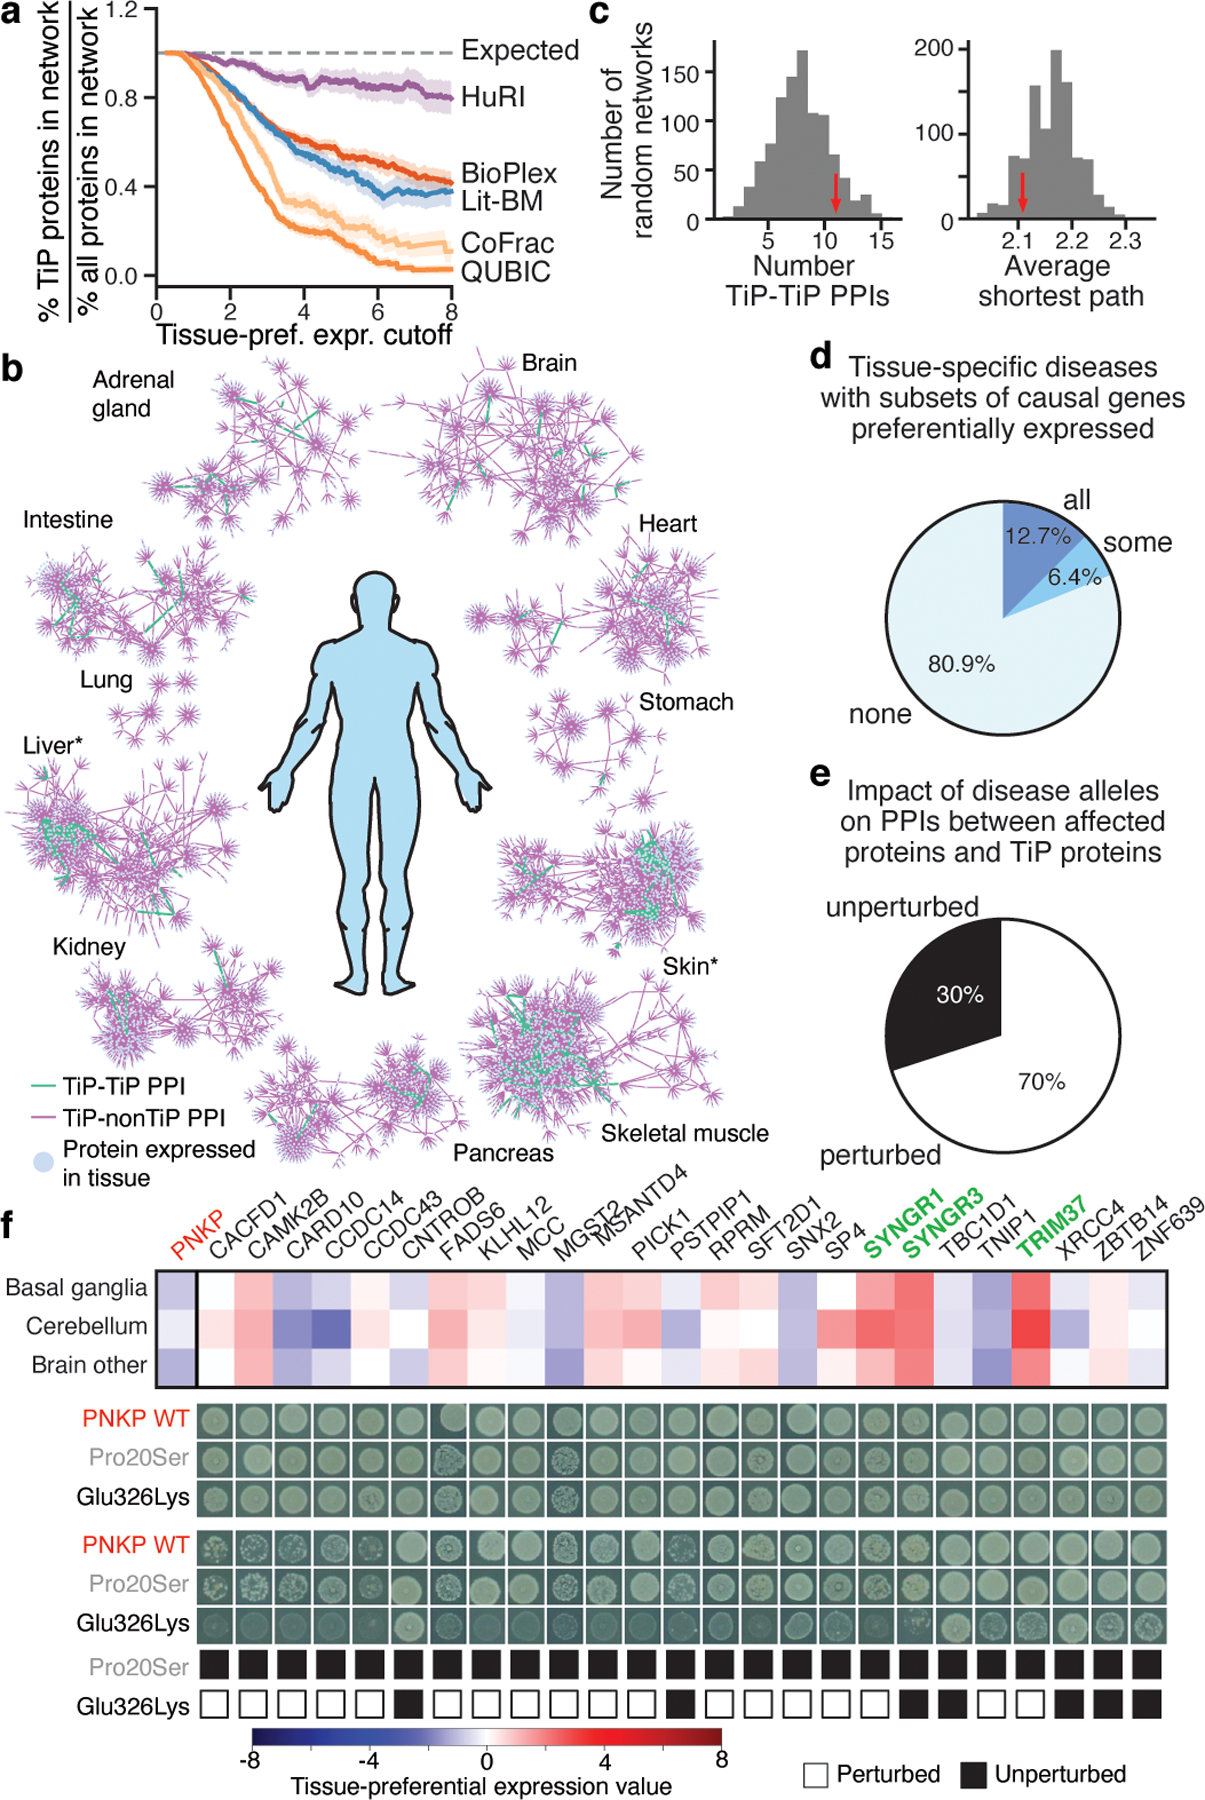
Global insights into cellular organization and genome function require comprehensive understanding of the interactome networks that mediate genotype-phenotype relationships1,2. Here we present a human 'all-by-all' reference interactome map of human binary protein interactions, or 'HuRI'. With approximately 53,000 protein-protein interactions, HuRI has approximately four times as many such interactions as there are high-quality curated interactions from small-scale studies. The integration of HuRI with genome3, transcriptome4 and proteome5 data enables cellular function to be studied within most physiological or pathological cellular contexts. We demonstrate the utility of HuRI in identifying the specific subcellular roles of protein-protein interactions. Inferred tissue-specific networks reveal general principles for the formation of cellular context-specific functions and elucidate potential molecular mechanisms that might underlie tissue-specific phenotypes of Mendelian diseases. HuRI is a systematic proteome-wide reference that links genomic variation to phenotypic outcomes.


Conflict of interest statement

Competing interests J.C.M. is a founder and CEO of seqWell, Inc; F.P.R. and M.V. are shareholders and scientific advisors of seqWell, Inc.

Figures

Extended Data Fig. 1 |
Extended Data Fig. 1 |. Y2H assay development and validation of HuRI.
a, Number of protein-coding genes in hORFeome v9.1 and GTEx, FANTOM, and HPA transcriptome projects. The number of genes in hORFeome v9.1 is on par with the number of genes found to be expressed in three comprehensive individual transcriptome sequencing studies and includes 94% of the genes with robust evidence of expression in all three. b, Overlap between hORFeome v9.1 and intersection of transcriptomes in a. c, Individual and combined recovery of PRSv1 and RRSv1 pairs by Y2H assay versions (n = 252, 270). d, Colored squares showing which protein pairs were detected in PRSv1 (left) and RRSv1 (right) by Y2H assay versions. e, Recovery rates of Lit-BM and PPIs from screens of a 2k-by-2k gene test space per Y2H assay version in MAPPIT. f, Cumulative PPI count performing three screens with each Y2H assay version in the test space compared to nine screens with Y2H assay version 1. g, h, MAPPIT and GPCA recovery of Lit-BM and PPIs from screens of Space III when split by screen at a RRS rate of 1% (g) or across a range of thresholds (h). All error bars, in c, e, g, are 68.3% Bayesian confidence interval, shaded error band in h is standard error of proportion and n = between 101 and 395 pairs successfully tested for each category. i, Number of proteins in HuRI, detected with each additional screen.
Extended Data Fig. 2 |
Extended Data Fig. 2 |. Definition of literature-curated PPI datasets.
a, Categorization of literature-curated PPIs into distinct subsets based on the experimental methods in which they were detected and the number of pieces of experimental evidence. b-e, Results of testing the different categories of literature-curated pairs in Y2H (b, d) and MAPPIT (c, e) where the pairs have been further divided into HT - high throughput and LT - low throughput subsets (b, c). BM: binary multiple; BS: binary singleton; NB: non-binary. Between n = 191–471 successfully tested PPIs for each category.
Extended Data Fig. 3 |
Extended Data Fig. 3 |. Stericity and interaction strength contribute to PPI detectability.
a, b, Fraction of PPIs with N or C-terminus < 10 Å (a) or 20 Å (b) to PPI interface, for PPIs with known structure in and not in HuRI (n = 37–1,891 PPIs). Error bars are standard error of proportion. The structure of UBE2D3 bound to RNF115 illustrates an example of a PPI found only by Y2H assay version 3 (PDB code: 5ulh). c, MAPPIT recovery rates of HuRI and Lit-BM PPIs that were also detected in HuRI by the number of screens each pair was detected in. Error bars are 68.3% Bayesian confidence interval (n = 22–793 PPIs successfully tested in each category). d, MAPPIT recovery rates of Lit-BM PPIs that were also detected in HuRI, for increasing number of pieces of experimental evidence per PPI. Error bars are 68.3% Bayesian confidence interval (n = 24–61 PPIs successfully tested in each category). e-f, Distributions of interaction interface area (e) or number of atomic contacts (f) by the number of HuRI screens in which a PPI is detected, with boxplots showing median, interquartile range (IQR), and 1.5 × IQR (with outliers), n = 1004 PPIs. g, Examples of within-complex interactions detected in HuRI (purple) and BioPlex (orange). Fraction of HuRI PPIs between proteins of protein complexes that link proteins of the same complex, split by PPIs found in single and multiple screens (dark purple). Error bars are standard error of proportion, n = 1,042 and 775 PPIs. h, Number of screens each PPI in HuRI was detected in, split by Y2H assay version. i, Number of Y2H assay versions each PPI in HuRI was detected in. j, Estimates of the size of the total binary protein interactome and the fraction covered by HuRI, as a function of the minimum number of publications per gene and the minimum number of evidence for the Lit-BM reference. Error bands are 68.3% Bayesian confidence interval, n ≥ 170 Lit-BM PPIs.
Extended Data Fig. 4 |
Extended Data Fig. 4 |. HuRI provides direct contact information for proteins in complexes.
Intra-complex PPIs are shown for protein complexes from CORUM as found in BioPlex (orange) or HuRI (purple). HuRI PPIs are further distinguished into PPIs found in single (light purple) or multiple screens (dark purple).
Extended Data Fig. 5 |
Extended Data Fig. 5 |. Topological and functional significance of HuRI.
a, Examples of protein pairs in HuRI with high interaction profile similarity and both high (left) and low sequence identity (right). b, The number of pairs of proteins in HuRI and 100 random networks at increasing Jaccard similarity cutoffs, with boxplots showing median, interquartile range (IQR), and 1.5 × IQR (with outliers). PSN: profile similarity network. c, Enrichment over random networks of the sum of Jaccard similarities of pairs of proteins in HuRI above at increasing thresholds of sequence identity. Error bars are 95% confidence intervals, center is relative to mean of random networks. d, Fraction of PSN edges that are also PPIs in HuRI, split by the PPIs involving no, one or two self-interacting proteins (SIPs), at increasing Jaccard similarity cutoffs. Error bars are standard error of proportion. e, f, Enrichment over random networks of the PPI count (left) or sum of Jaccard similarities (right) of HuRI PPIs or PSN pairs, respectively, at increasing co-expression (e) and co-fitness (f) cutoffs. Error bars are 95% confidence interval, center is relative to mean of random networks. g, Functional modules in HuRI (top) and its PSN (bottom) with functional annotations. h, Heatmaps of PPI counts, ordered by number of publications, for our previous human interactome maps and Lit-BM i, j, Fraction of genes with at least one PPI for biomedically interesting genes. Heatmap of HuRI and Lit-BM PPI counts between proteins, ordered by number of publications, restricted to PPIs involving genes from the corresponding gene set. k, Schematic of relation between variables: observed PPI degree, abundance, study bias and lethality. l, Correlation matrices. LoF: Loss-of-Function. PPI datasets refer to their network degree. m, Degree distribution of various PPI networks, together. n, Empirical determination of significance of correlation between various network degrees and gene properties. HuRI-2s = subset of HuRI found in at least two screens, (n = 13,441–53,704 PPIs per network).
Extended Data Fig. 6 |
Extended Data Fig. 6 |. Incomplete protein localization annotation likely underlies apparent lack of co-localization of proteins interacting in HuRI.
a, Odds ratios of proteins in different subcellular compartments and PPI datasets. n = 125–3,941 proteins per compartment, two-tailed Fisher’s exact test. b, The subnetwork of HuRI involving extracellular vesicle (EV) proteins. Names of high-degree proteins are shown. c, Number of PPIs in HuRI between EV proteins compared to the distribution from randomized networks (grey). d, Western Blot of SDCBP (left panel) and ACTB (loading control, right panel) in wild-type (WT) and three knockout (KO) cell lines (#7-#9), repeated twice in two independent laboratories. Full scanned image was displayed, obtained by ChemiDoc MP imager (Bio-Rad, Hercules, CA). Cell line #8 was used for EV proteomics. e, Fraction of proteins whose abundance in EVs was significantly reduced in the SDCBP KO cell line, split by proteins interacting and not interacting with SDCBP as identified in HuRI. Error bars are standard error of proportion (n = 6 interactors, 638 non-interactors, *p = 0.042, one-tailed empirical test). f, Schematic illustrating that the number of HuRI PPIs between proteins from two different compartments should correlate with the enrichment of both compartment pairs to overlap, if co-localization annotation is incomplete. g, Scatter plot showing, for each pair of subcellular compartments, odds ratios quantifying the enrichment for proteins located in both compartments versus the enrichment of the density of PPIs between proteins located to either compartment. Size of points is scaled by the standard error of the x axis variable. Regression line and 95% confidence interval are shown. h, The z-score of the regression slope of g compared to those of random networks.
Extended Data Fig. 7 |
Extended Data Fig. 7 |. Investigation of tissue-preferential expression data.
a, Examples of genes displaying different levels of tissue-preferential (TiP) expression across the GTEx tissue panel (left), with boxplots showing median, interquartile range (IQR), and 1.5 × IQR (with outliers), n = 90–779 samples per tissue. Equation to calculate tissue-preferential expression for every gene-tissue pair and the maximum TiP value for every gene (middle). Number of genes showing tissue-preferential expression for increasing tissue-preferential expression cutoffs (right). b, Relative number of TiP genes for every tissue for increasing tissue-preferential expression cutoffs. c-d, Differences in number of TiP genes upon removal of testis prior to TiP value calculation per tissue (TiP value cutoff = 2) (c) and in total for increasing tissue-preferential expression cutoffs (d). e, Number of TiP genes and number of TiP genes that are also exclusively expressed in one tissue (sglTis: single tissue) for increasing tissue-preferential expression cutoffs.
Extended Data Fig. 8 |
Extended Data Fig. 8 |. PPIs between TiP proteins and uniformly expressed proteins likely adapt basic cellular processes to mediate cellular context-specific functions.
a, TiP protein coverage by CCSB PPI networks for increasing levels of tissue-preferential expression, (shaded error bands proportional to standard error on proportion, n ≥ 233 genes). b, Spearman correlation coefficients and 95% confidence intervals for correlations between degree or betweenness and tissue specificity for HuRI and Lit-BM (n = 6,684 and 4,971 proteins). c, Fraction of HuRI and Lit-BM that involve TiP proteins compared to fraction of genome that are TiP genes for increasing levels of tissue-preferential expression. d, Number of PPIs in HuRI, involving proteins in GTEx, where both proteins are expressed in the same tissue, and the mean of the tissue-specific subnetworks where error bar is standard deviation. e, Test for enrichment of TiP-TiP PPIs (left) and significance of average shortest path between TiP proteins (middle) in each tissue subnetwork, number of TiP proteins in each subnetwork, interacting with other TiP proteins, being part of Keratin (KRT) or Late-cornified envelope (LCE) protein family (right). f, g, Transcript expression levels across the BLUEPRINT hematopoietic cell lineage (f) and GTEx tissue panel (g) for three candidate genes predicted to function in apoptosis. EG = esophagus gastroesophageal. h, Histogram of number of untransfected cells and their time of death (left) without (top) and with (bottom) addition of TRAIL. Time of death of cells expressing OTUD6A-GFP fusions versus OTUD6A expression measured as fluorescence (right) without (top) and with (bottom) addition of TRAIL. i, Apoptosis-related network context of OTUD6A and C6ORF222 in HuRI, unfiltered (left) and filtered using colon transverse or mature eosinophil transcript levels (right).
Extended Data Fig. 9 |
Extended Data Fig. 9 |. Potential mechanisms of tissue-specific diseases.
a, Histogram of the number of Mendelian diseases showing symptoms in a number of tissues. b, Test for enrichment of causal proteins associated with tissue-specific Mendelian diseases to interact with TiP proteins of affected tissues. c, Network neighborhood of uniformly expressed causal proteins of tissue-specific diseases found to interact with TiP proteins in HuRI, indicating PPI perturbation by mutations. d, Causal genes split by mutation found to perturb PPI to TiP protein (dashed) or not (solid). e, Expression profile of PNKP and interactors in brain tissues and PPI perturbation pattern of disease causing (Glu326Lys) and benign (Pro20Ser) mutation. Yeast growth phenotypes on SC-Leu-Trp (upper) or SC-Leu-Trp-His+3AT media (lower) are shown; green/grey gene symbols: preferentially/not expressed.
Extended Data Fig. 10 |
Extended Data Fig. 10 |. Mutations in uniformly expressed causal proteins associated with tissue-specific Mendelian diseases perturb interactions to TiP proteins.
Expression profile and interaction perturbation profile of nine causal proteins and their interaction partners. Affected tissues were selected for display (top). Control of AD and DB (Gal 4 DNA binding domain) plasmid presence and cell density by spotting yeast colonies on SC-Leu-Trp media (upper). Detection of PPIs by spotting yeast on SC-Leu-Trp-His+3AT media (lower), where yeast growth indicates PPIs. WT = wild-type, red letters = causal proteins or alleles, grey gene symbols = interaction partners not expressed in affected tissues, grey alleles = not pathogenic, green gene symbols = TiP interaction partners in affected tissues.
Fig. 1 |
Fig. 1 |. Generation of a reference interactome map using a panel of binary assays.
a, Overview of HuRI generation. b, Schematic of the Y2H assay versions. c, Experimental validation. Lit-BM: literature-curated binary PPIs with multiple evidence; RRS: random protein pairs. Error bars are 68.3% Bayesian confidence interval, n = 2,281, 383, 475 (MAPPIT) 1,639, 382, 465 (GPCA). d, Number of PPIs and proteins, detected with each additional screen. e, Fraction of direct contact pairs among five PPI networks. Error bar is standard error of proportion, n = 121, 410, 1,169, 584, 1,211 PPIs. f, Number of PPIs identified over time from screening at CCSB and Lit-BM.
Fig. 2 |
Fig. 2 |. Complementary functional relationships in HuRI between genes.
a, Enrichment of HuRI and its profile similarity network (PSN) for protein pairs with shared functional annotation, showing mean and 95% interval of 100 random networks. b, Functional modules in HuRI and its PSN and in previously published interactome maps from CCSB.
Fig. 3 |
Fig. 3 |. Unbiased proteome coverage of HuRI reveals uncharted network neighborhoods of disease-related genes.
a, Heatmaps of Y2H PPI counts, ordered by number of publications. b, Fraction of HuRI PPIs in Lit-BM, for increasing values of the minimum number of publications per protein. Error bar is standard error of proportion, n = 52,569–170 PPIs. c, Fraction of genes with at least one PPI for biomedically interesting genes. d, As a, but restricted to PPIs involving genes from the indicated gene sets. e, Correlation between degree and variables of interest, before (top) and after (bottom) correcting for the technical confounding factors (n = 13,441–53,704 PPIs per network, two-tailed permutation test).
Fig. 4 |
Fig. 4 |. Identification of potential recruiters of proteins into extracellular vesicles.
a, Schematic of experimental design to test EV recruitment function of proteins. MS: Mass Spectrometry. b, Protein abundance from EVs for each gene in WT (wild-type) and SDCBP KO (knockout). Mean values of n = 3 biological replicates.
Fig. 5 |
Fig. 5 |. Tissue-specific functions are largely mediated by interactions between TiP proteins and uniformly expressed proteins.
a, Tissue-preferentially expressed (TiP) protein coverage by PPI networks for increasing levels of tissue-preferential expression (shaded error bands proportional to standard error on proportion, n ≥ 233 genes). b, Tissue-preferential sub-networks. *P < 0.001, 1-sided empirical test for TiP proteins being close to each other (n = 19,960–30,217 PPIs per subnetwork). c, Empirical test of closeness of TiP proteins in the brain sub-network, 1,000 random networks. d, Tissue-specific diseases split by tissue-preferential expression levels of causal genes. e, Tested tissue-specific diseases split by PPI perturbation result. f, Expression profile of PNKP and interactors in brain tissues and PPI perturbation pattern of disease causing (Glu326Lys) and benign (Pro20Ser) mutation. Yeast growth phenotypes on SC-Leu-Trp (upper) or SC-Leu-Trp-His+3AT (3-Amino-1,2,4-triazole) media (lower). Green gene symbols: preferentially expressed. Only interactors expressed in brain shown.

References

    1. Vidal M, Cusick ME & Barabási A-L Interactome networks and human disease. Cell 144, 986–998 (2011). - PMC - PubMed
    1. Rolland T et al. A proteome-scale map of the human interactome network. Cell 159, 1212–1226 (2014). - PMC - PubMed
    1. Amberger JS, Bocchini CA, Schiettecatte F, Scott AF & Hamosh A OMIM.org: Online Mendelian Inheritance in Man (OMIM®), an online catalog of human genes and genetic disorders. Nucleic Acids Res. 43, D789–798 (2015). - PMC - PubMed
    1. Melé M et al. The human transcriptome across tissues and individuals. Science 348, 660–665 (2015). - PMC - PubMed
    1. Thul PJ et al. A subcellular map of the human proteome. Science 356, eaal3321 (2017). - PubMed