. 2020 Mar 31:11:405.
doi: 10.3389/fimmu.2020.00405. eCollection 2020.

Transcriptomic Analysis of Monocyte-Derived Non-Phagocytic Macrophages Favors a Role in Limiting Tissue Repair and Fibrosis

Affiliations

Transcriptomic Analysis of Monocyte-Derived Non-Phagocytic Macrophages Favors a Role in Limiting Tissue Repair and Fibrosis

Sergei Butenko et al. Front Immunol. .

Erratum in

Abstract

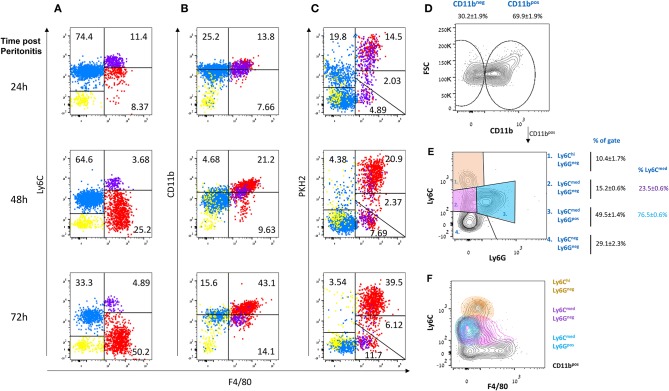
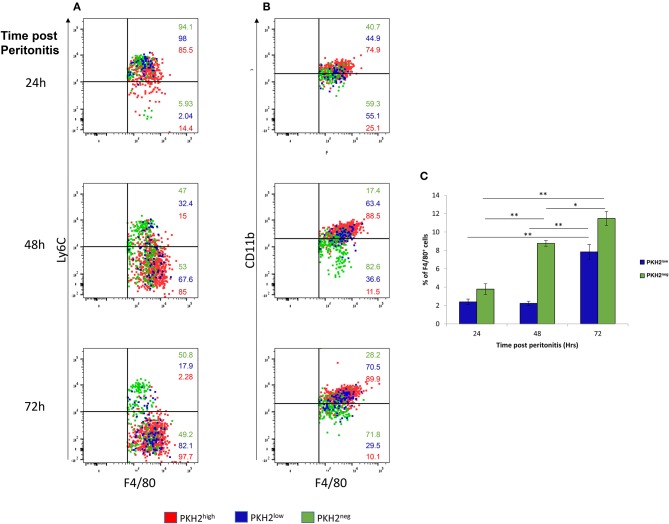
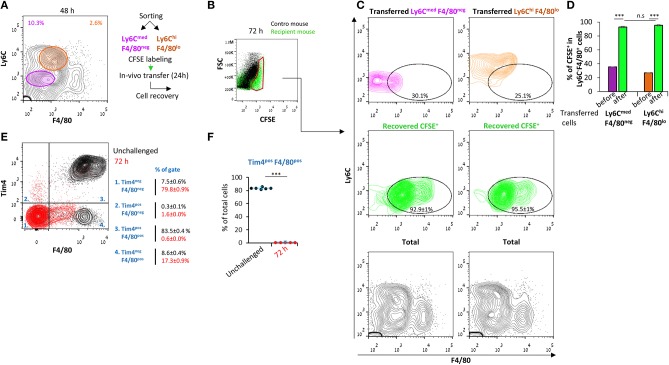
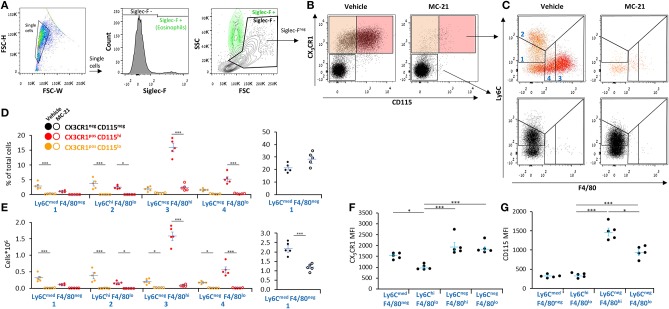
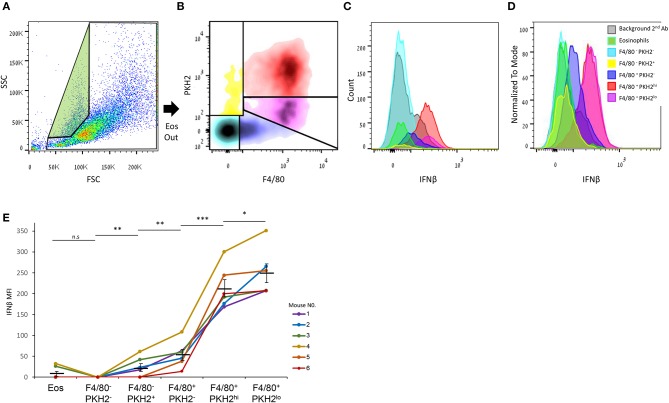
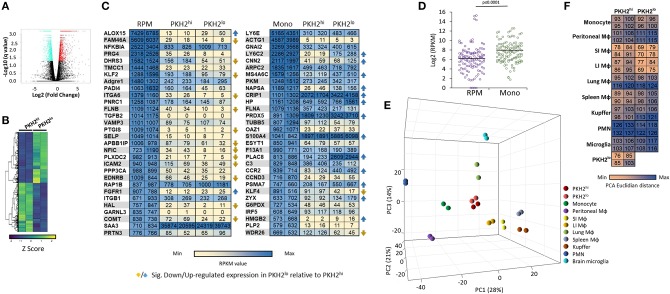
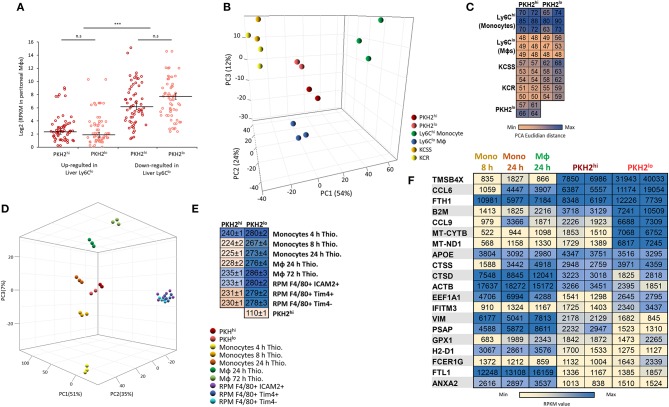
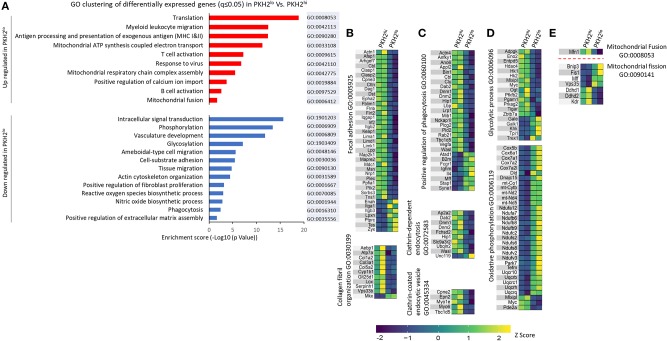
Monocyte-derived macrophages are readily differentiating cells that adapt their gene expression profile to environmental cues and functional needs. During the resolution of inflammation, monocytes initially differentiate to reparative phagocytic macrophages and later to pro-resolving non-phagocytic macrophages that produce high levels of IFNβ to boost resolutive events. Here, we performed in-depth analysis of phagocytic and non-phagocytic myeloid cells to reveal their distinct features. Unexpectedly, our analysis revealed that the non-phagocytic compartment of resolution phase myeloid cells is composed of Ly6CmedF4/80- and Ly6ChiF4/80lo monocytic cells in addition to the previously described Ly6C-F4/80+ satiated macrophages. In addition, we found that both Ly6C+ monocytic cells differentiate to Ly6C-F4/80+macrophages, and their migration to the peritoneum is CCR2 dependent. Notably, satiated macrophages expressed high levels of IFNβ, whereas non-phagocytic monocytes of either phenotype did not. A transcriptomic comparison of phagocytic and non-phagocytic resolution phase F4/80+ macrophages showed that both subtypes express similar gene signatures that make them distinct from other myeloid cells. Moreover, we confirmed that these macrophages express closer transcriptomes to monocytes than to resident peritoneal macrophages (RPM) and resemble resolutive Ly6Clo macrophages and monocyte-derived macrophages more than their precursors, inflammatory Ly6Chi monocytes, recovered following liver injury and healing, and thioglycolate-induced peritonitis, respectively. A direct comparison of these subsets indicated that the non-phagocytic transcriptome is dominated by satiated macrophages and downregulate gene clusters associated with excessive tissue repair and fibrosis, ROS and NO synthesis, glycolysis, and blood vessel morphogenesis. On the other hand, non-phagocytic macrophages enhance the expression of genes associated with migration, oxidative phosphorylation, and mitochondrial fission as well as anti-viral responses when compared to phagocytic macrophages. Notably, conversion from phagocytic to satiated macrophages is associated with a reduction in the expression of extracellular matrix constituents that were demonstrated to be associated with idiopathic pulmonary fibrosis (IPF). Thus, macrophage satiation during the resolution of inflammation seems to bring about a transcriptomic transition that resists tissue fibrosis and oxidative damage while promoting the restoration of tissue homeostasis to complete the resolution of inflammation.

Keywords: efferocytosis; fibrosis; inflammation; macrophages; transcriptional profiling.


Figures

Figure 1
Figure 1
Non-phagocytic myeloid cells in peritoneal exudates contain monocytes and macrophages. Zymosan A (1 mg/mouse) was injected intraperitoneally to male mice. After 20, 44, or 68 h, these mice were injected I.P. with the phagocyte-specific dye PKH2-PCL green. Four hours later, the peritoneal cells were recovered and immunostained for F4/80 and CD11b. Dot plot analysis was performed for the expression of Ly6C (A, Y axis), CD11b (B), and PKH2-PCL acquisition (C), relative to F4/80 expression (X axis) by various exudate cells. Results are representatives from n = 8 mice for 24 h, six mice for 48 h, and seven mice for 72 h. (D–F) Peritoneal cells were recovered 66 h PPI and immunostained for CD11b, Ly6C, Ly6G, and F4/80 and analyzed by flow cytometry. Results are representative plots and means ± SEM (n = 12) showing CD11b+ gating (D), Ly6G vs. Ly6C (identifying monocytes and neutrophils, (E), and Ly6C vs. F4/80 (F).
Figure 2
Figure 2
Non-phagocytic monocytes and satiated macrophages show different kinetics during the resolution of peritonitis. (A,B) Dot plots of F4/80+ PKH2-PCL high (red), low (blue), and negative (green) cells are presented relative to Ly6C (A) or CD11b (B). (C) Percentage of F4/80+PKH2low and PKH2negcells at 24–72 h PPI. Results are means ± SEM (n = 8 mice for 24 h, six mice for 48 h, and seven mice for 72 h). *P < 0.05, **P < 0.05 (Tukey's HSD).
Figure 3
Figure 3
Ly6CmedF4/80neg and Ly6ChiF4/80lo cells both convert to Ly6Cneg F4/80+ macrophages. Peritoneal exudates were recovered from WT mice 48 h PPI. (A) Monocytic cells were sorted into Ly6CmedF4/80neg and Ly6ChiF4/80lo populations. (B–D) Sorted cells were labeled with CFSE and transferred to recipient mice with ongoing peritonitis at 48 h. At 72 h, peritoneal cells were recovered, immunostained for Ly6C and F4/80, and CFSE+ cells (B) were analyzed by flow cytometry (C, D). Results are stacked contour plot from six mice (C) and means ± SEM (n = 6). P < 0.001 (Student's t-test). (E,F) Peritoneal exudates were recovered from unchallenged mice or at 72 h PPI, immunostained for F4/80 and Tim4 and analyzed by flow cytometry. Results are stacked contour plots from six mice (E) and percentage means ± SEM of F4/80+ Tim4+ cells (F).***P < 0.001(Student's t-test).
Figure 4
Figure 4
All resolution phase monocytic/macrophage subsets are CCR2-dependent. WT mice undergoing peritonitis were treated I.P. with anti-mouse CCR2 mAb (clone MC-21) or vehicle (control) at peritonitis initiation (0 h) and 24 h PPI. At 72 h, peritoneal cells were collected, immunostained for Ly6C, F4/80, CD115, CX3CR1, and Siglec–F and analyzed by flow cytometry. (A) The gating strategy excluded Siglec-F+ eosinophils (green). (B–D) Samples were analyzed according to CX3CR1 vs. CD115 (B) and CX3CR1+ (top) or CX3CR1 (bottom) cells were analyzed according to F4/80 vs. Ly6C and CD115hi (red dots) vs. CD115lo subsets (C). Analysis of the percentages (D) and cell numbers (E) of the indicated subsets is presented. Results are stacked dot plots (B,C) and means ± SEM (D,E) from n = 5. (F,G) CD115 (F) and CX3CR1 (G) expression by various CX3CR1+ myeloid subsets. Results are means ± SEM of MFI from n = 5. *P < 0.05, ***P < 0.001 (Student's t-test or Tukey's HSD).
Figure 5
Figure 5
Satiated macrophages express the highest level of IFNβ of all resolution phase leukocytes. Peritoneal exudates were recovered from WT mice 66 h PPI, and the cells were immunostained for F4/80, fixed, permeabilized, and immunostained for IFNβ. (A) The gating strategy for eosinophils (green) and other immune cells. (B) Density plot analysis of F4/80 vs. PKH2 staining resulted in five distinct populations: F4/80PKH2 (cyan), F4/80PKH2+ (yellow), F4/80+PKH2 (blue), F4/80+PKH2hi (red), and F4/80+PKH2lo (purple). These populations were then analyzed for IFNβ expression, and results were presented as counts (C) and normalized to mode (D). MFI means ± SEM from six independent mice are shown (E). *P < 0.05, **P < 0.01, ***P < 0.001 (Student's t-test). Data for second antibody alone and eosinophils were previously reported in (17).
Figure 6
Figure 6
Transcriptomic analysis of PKH2hi/phagocytic and PKH2lo/neg/non-phagocytic resolution phase macrophages. Male C57BL/6 mice were injected intraperitoneally with zymosan A (1 mg/mouse) followed by an injection of PKH2-PCL at 62 h. Four hours later, the peritoneal cells were recovered and immunostained for F4/80 and CD11b. Then, F4/80+ macrophages were sorted based on the extent of PKH2-PCL acquisition (PKH2hi vs. PKH2low/neg populations; >98% purity) using the FACSAria II sorter [as reported in (17)]. The collected cells were immediately used for RNA extraction (with RNA integrity value above 7.5), and a gene expression microarray analysis was performed using Illumina hiSeq 2500. Annotated genes were plotted using a volcano plot to identify the significant differentially expressed genes comparing PKH2hi and PKH2lo macrophages with significance depicted at q ≤ 0.05 values (A). Differentially expressed genes were examined across samples and hierarchically clustered into HeatMap of two lists: 1,690 up- and 1,752 down-regulated genes in PKH2lo relative to PKH2hi. Data presented are Z score normalized (B). Annotated genes were examined in comparison to various resident murine macrophage populations, as well as monocytes and PMNs [database from (7)]. The 30 highest expressed genes (on CPM-TMM scale) from either resident peritoneal macrophages (out of 282 exclusive genes) or monocytes (out of 272 exclusive genes) were compared to PKH2hi and PKH2lo/neg macrophages by RPKM values (C) and by distribution around the expression median values of each sample (D). Differential distances of PKH2hi and PKH2lo/neg macrophages from resident peritoneal macrophages and from monocytes were visualized on a 3D PCA plot (E) and enumerated as PCA Euclidian distances (F).
Figure 7
Figure 7
Resolution phase macrophages resemble liver reparative Ly6Clo macrophages and peritoneal monocyte-derived macrophages elicited by thioglycolate. Annotated genes were compared to the database of monocyte/macrophage populations from acute liver injury induced by overdose of N-acetyl-p-aminophenol (APAP) [Zigmond et al. (19)]. These subsets include inflammatory Ly6Chi monocytes and their descendants, Ly6Clo monocytes, as well as Kupffer cells from the steady state (KCSS) and recovered (KCR) phases. The 50 highest up- or downregulated genes in the liver Ly6Clo differentiated macrophages were compared to PKH2hi/phagocytic and PKH2lo/neg/non phagocytic macrophages (A). Differential distances of PKH2hi and PKH2lo/neg macrophages from liver macrophages and monocytes were visualized on a 3D PCA plot (B) and enumerated as PCA Euclidian distances (C). Alternatively, annotated genes were compared to the database of resident tissue macrophages and thioglycolate-elicited peritoneal monocyte/macrophage populations from the ImmGEN consortium (OpenSource mononuclear phagocyte project). The peritoneal resident populations were designated as RPM F4/80+ICAM2+ (F4/80+ICAM2+CD3CD19Ter119) and RPM F4/80+ Tim4+/Tim4 (B220Ly6CF480+CD11b+CD64+Tim4+/Tim4). The peritoneal thioglycolate-elicited populations were designated as follows: monocytes 4 and 8 h Thio (CD45+CD11b+CD115+Ly-6C+ICAM2CD226), monocytes 24 h Thio (CD45+CD11b+CD115+Ly-6C+CD36loICAM2CD226), and macrophages 24 and 72 h Thio (CD45+CD11b+CD115+Ly-6CloCD36+ICAM2CD226). Differential distances of PKH2hi and PKH2lo/neg macrophages from peritoneal resident, and thioglycolate-elicited monocytes/macrophages were visualized on a 3D PCA plot (D) and enumerated as PCA Euclidian distances presented as group to group mean ± SEM (E). The 20 highest expressed genes (on CPM-TMM scale) from either PKH2hi or PKH2lo/neg macrophages were compared to monocytes 4 and 8 h Thio and macrophages 24 h Thio by RPKM values (F).
Figure 8
Figure 8
Select functional GO pathways skewed in non-phagocytic macrophages. Analysis of gene enrichment for biological processes and KEGG pathway was performed on the differential up- and down-regulated gene clusters (A). A search for GO pathways was performed to examine skewed functions comparing PKH2hi and PKH2lo macrophages in terms of tissue repair and fibrosis (B), phagocytic activity (C), bioenergetics (D), and mitochondrial dynamics (E). Data presented are differentially expressed (twofold change) genes from each GO term category with q ≤ 0.05.

References

    1. Ortega-Gómez A, Perretti M, Soehnlein O. Resolution of inflammation: an integrated view: resolution of inflammation. EMBO Mol Med. (2013) 5:661–74. 10.1002/emmm.201202382 - DOI - PMC - PubMed
    1. Serhan CN, Brain SD, Buckley CD, Gilroy DW, Haslett C, O'Neill LAJ, et al. . Resolution of inflammation: state of the art, definitions and terms. FASEB J. (2007) 21:325–32. 10.1096/fj.06-7227rev - DOI - PMC - PubMed
    1. Headland SE, Norling LV. The resolution of inflammation: principles and challenges. Semin Immunol. (2015) 27:149–60. 10.1016/j.smim.2015.03.014 - DOI - PubMed
    1. Elliott MR, Ravichandran KS. The dynamics of apoptotic cell clearance. Dev Cell. (2016) 38:147–60. 10.1016/j.devcel.2016.06.029 - DOI - PMC - PubMed
    1. Uderhardt S, Herrmann M, Oskolkova OV, Aschermann S, Bicker W, Ipseiz N, et al. . 12/15-lipoxygenase orchestrates the clearance of apoptotic cells and maintains immunologic tolerance. Immunity. (2012) 36:834–46. 10.1016/j.immuni.2012.03.010 - DOI - PubMed

Publication types

LinkOut - more resources