

Choosing what is left: the spatial structure of a wild herbivore population within a livestock-dominated landscape
- PMID: 32296614
- PMCID: PMC7150538
- DOI: 10.7717/peerj.8945
Choosing what is left: the spatial structure of a wild herbivore population within a livestock-dominated landscape
Abstract
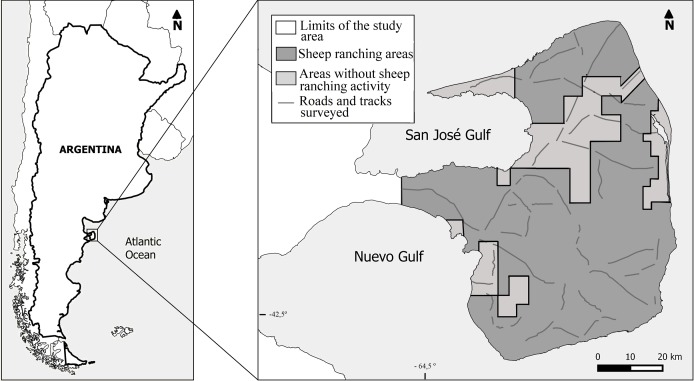
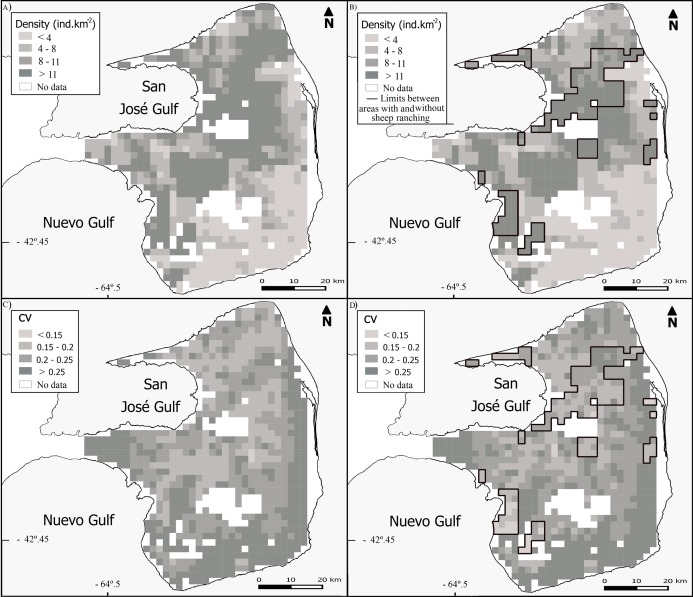
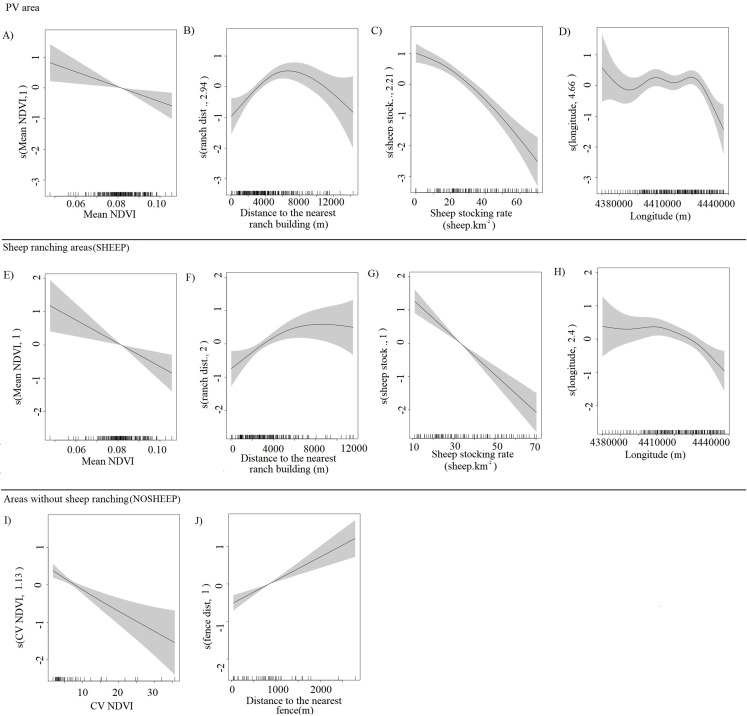
Shrublands and grasslands comprise over 30% of the land surface and are among the most exploited ecosystems for livestock production. Across natural landscapes, the distribution and abundance of wild herbivores are affected by interspecific competition for foraging resources, hunting and the development of infrastructure among other factors. In Argentine Patagonia, the abundance of domestic sheep grazing on native vegetation outnumbers the widely distributed guanaco (Lama guanicoe) and sheep ranching monopolizes the most productive lands. In this work, we aimed to assess the spatial variation in the abundance of guanacos in Península Valdés, a representative landscape of Patagonia, investigating the incidence of natural and human-related factors. We conducted ground surveys during the austral autumn in 2017 totaling 383.4 km along areas with and without sheep ranching. We built density surface models to account for the variation in guanaco abundance and obtained a map of guanaco density at a resolution of 4 km2. We estimated an overall density of 11.71 guanacos.km-2 for a prediction area of 3,196 km2, although the density of guanacos tripled in areas where sheep ranching was terminated (in around 20% of the surface of Península Valdés) compared to areas with sheep. Guanacos were more abundant at lower values of primary productivity and sheep stocking rates and further from inhabited ranch buildings, suggesting competition with sheep and conflict with humans. Although guanacos selected open, grass-dominated habitats across sheep-free sites, fences dividing properties and paddocks played a significant role in the spatial structure of their population in Península Valdés affecting negatively the abundance of guanacos. Our results indicate that actions to improve habitat connectivity for guanacos, favor the coexistence among guanacos and sheep ranching, and promote responsible human activities and attitudes towards wildlife are needed.
Keywords: Anthropic factors; Distribution and abundance; Habitat selection; Lama guanicoe; Patagonia; Península Valdes; Sheep ranching; Spatial models; Wild and domestic ungulates.
© 2020 Antún and Baldi.
Conflict of interest statement
The authors declare that they have no competing interests.
Figures
References
-
- Aagesen D. Crisis and conservation at the end of the world: sheep ranching in Argentine patagonia. Environmental Conservation. 2000;27(2):208–215. doi: 10.1017/S0376892900000229. - DOI
-
- Adeel Z, Safriel U, Niemeijer D, White R. Ecosystems and human well-being: desertification synthesis millennium ecosystem assessment. Washington, D.C.: World Resources Institute; 2005.
-
- Adler PB, Milchunas DG, Sala OE, Burke IC, Lauenroth WK. Plant traits and ecosystem grazing effects: comparison of U.S. sagebrush steppe and patagonian steppe. Ecological Applications. 2005;15(2):774–792. doi: 10.1890/04-0231. - DOI
-
- Anderson JK. Hunting in the ancient world. Berkeley: University of California Press Berkeley; 1985.
-
- Antún M. Estructura espacial de las poblaciones de guanacos, choiques y maras en un socio-ecosistema árido. Influencia del hábitat y la actividad ganadera en Península Valdé. 2018. PhD thesis, Universidad de Buenos Aires Facultad de Ciencias Exactas y Naturales.
LinkOut - more resources
Full Text Sources
