

Exploring the genetic base of the soybean germplasm from Africa, America and Asia as well as mining of beneficial allele for flowering and seed weight
- PMID: 32296618
- PMCID: PMC7142197
- DOI: 10.1007/s13205-020-02186-5
Exploring the genetic base of the soybean germplasm from Africa, America and Asia as well as mining of beneficial allele for flowering and seed weight
Abstract
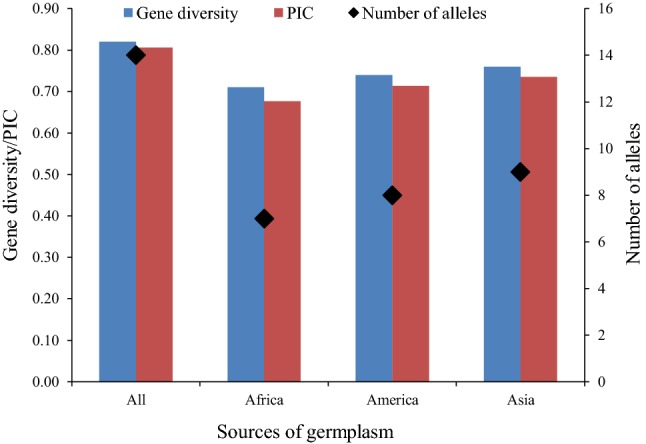
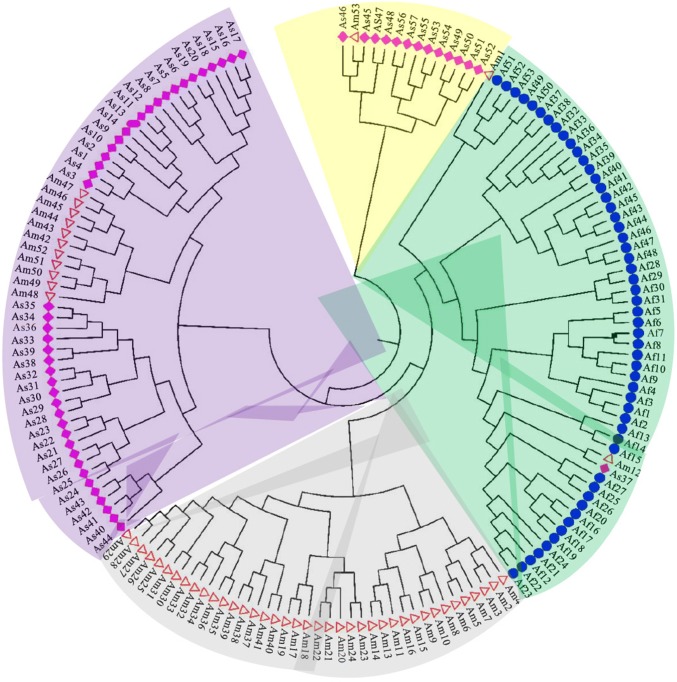
Genetic diversity is the foundation for any breeding program. The present study analyzed the genetic base of 163 soybean genotypes from three continents viz. Africa, America and Asia using 68 trait-linked simple sequence repeats (SSR) markers. The average number of alleles among the germplasm from the three continents followed the trend as Asia (9) > America (8) > Africa (7). Similar trends were observed for gene diversity (0.76 > 0.74 > 0.71) and polymorphism information content (PIC) (0.73 > 0.71 > 0.68). These findings revealed that soybean germplasm from Asia has wider genetic base followed by America, and least in Africa. The 163 genotypes were grouped into 4 clusters by phylogenetic analysis, whereas model-based population structure analysis also divided them into 4 subpopulations comprising 80.61% pure lines and 19.39% admixtures. The genotypes from Africa were easily distinguished from those of other two continents using phylogenetic analysis, indicating important role of geographyical differentiation for this genetic variability. Our results indicated that soybean germplasm has moved from Asia to America, and from America to Africa. Analysis of molecular variance (AMOVA) showed 8.41% variation among the four subpopulations, whereas 63.12% and 28.47% variation existed among and within individuals in the four subpopulations, respectively. Based on the association mapping, a total of 21 SSR markers showed significant association with days to flowering (DoF) and 100-seed weight (HSW). Two markers Satt365 and Satt581 on chromosome 6 and 10, respectively, showed pleiotropic effect or linkage on both traits. Genotype A50 (Gakuran Daizu/PI 506679) from Japan has 8 out of the 13 beneficial alleles for increased HSW. The diverse genotypes, polymorphic SSR markers and desirable alleles identified for DoF and HSW will be used in future breeding programs to improve reproductive, yield and quality traits.
Keywords: Cluster; Desirable alleles; Polymorphism information content; Principal coordinate analysis; Simple sequence repeats.
© King Abdulaziz City for Science and Technology 2020.
Conflict of interest statement
Conflict of interestThe authors have no conflicts of interest to declare.
Figures

Similar articles
-
Genetic diversity and population structure analysis in cultivated soybean (Glycine max [L.] Merr.) using SSR and EST-SSR markers.PLoS One. 2023 May 31;18(5):e0286099. doi: 10.1371/journal.pone.0286099. eCollection 2023. PLoS One. 2023. PMID: 37256876 Free PMC article.
-
Genetic diversity and population structure analysis of Kala bhat (Glycine max (L.) Merrill) genotypes using SSR markers.Hereditas. 2017 Apr 27;154:9. doi: 10.1186/s41065-017-0030-8. eCollection 2017. Hereditas. 2017. PMID: 28461811 Free PMC article.
-
Diversity and population structure of red rice germplasm in Bangladesh.PLoS One. 2018 May 2;13(5):e0196096. doi: 10.1371/journal.pone.0196096. eCollection 2018. PLoS One. 2018. PMID: 29718936 Free PMC article.
-
High level of molecular and phenotypic biodiversity in Jatropha curcas from Central America compared to Africa, Asia and South America.BMC Plant Biol. 2014 Mar 25;14:77. doi: 10.1186/1471-2229-14-77. BMC Plant Biol. 2014. PMID: 24666927 Free PMC article.
-
SSR analysis of genetic diversity and structure of the germplasm of faba bean (Vicia faba L.).C R Biol. 2017 Nov-Dec;340(11-12):474-480. doi: 10.1016/j.crvi.2017.09.008. Epub 2017 Oct 26. C R Biol. 2017. PMID: 29107611
Cited by
-
Assessment of the Genetic Structure and Diversity of Soybean (Glycine max L.) Germplasm Using Diversity Array Technology and Single Nucleotide Polymorphism Markers.Plants (Basel). 2021 Dec 26;11(1):68. doi: 10.3390/plants11010068. Plants (Basel). 2021. PMID: 35009071 Free PMC article.
-
Genome-wide association study of the loci and candidate genes associated with agronomic traits in Amomum villosum Lour.PLoS One. 2024 Aug 5;19(8):e0306806. doi: 10.1371/journal.pone.0306806. eCollection 2024. PLoS One. 2024. PMID: 39102408 Free PMC article.
-
Uncovering the genetic landscape of soybean accessions from Kazakhstan in comparison with global germplasm using whole genome resequencing.BMC Genomics. 2025 Sep 3;26(1):802. doi: 10.1186/s12864-025-12024-8. BMC Genomics. 2025. PMID: 40898063 Free PMC article.
References
-
- Belalia N, Lupini A, Djemel A, Morsli A, Mauceri A, Lotti C, Khelifi-Slaoui M, Khelifi L, Sunseri F. Analysis of genetic diversity and population structure in Saharan maize (Zea mays L.) populations using phenotypic traits and SSR markers. Genet Res Crop Evol. 2019;66(1):243–257. doi: 10.1007/s10722-018-0709-3. - DOI
LinkOut - more resources
Full Text Sources
Research Materials
Miscellaneous
