

Mining Data From Plasma Cell Differentiation Identified Novel Genes for Engineering of a Yeast Antibody Factory
- PMID: 32296695
- PMCID: PMC7136540
- DOI: 10.3389/fbioe.2020.00255
Mining Data From Plasma Cell Differentiation Identified Novel Genes for Engineering of a Yeast Antibody Factory
Abstract
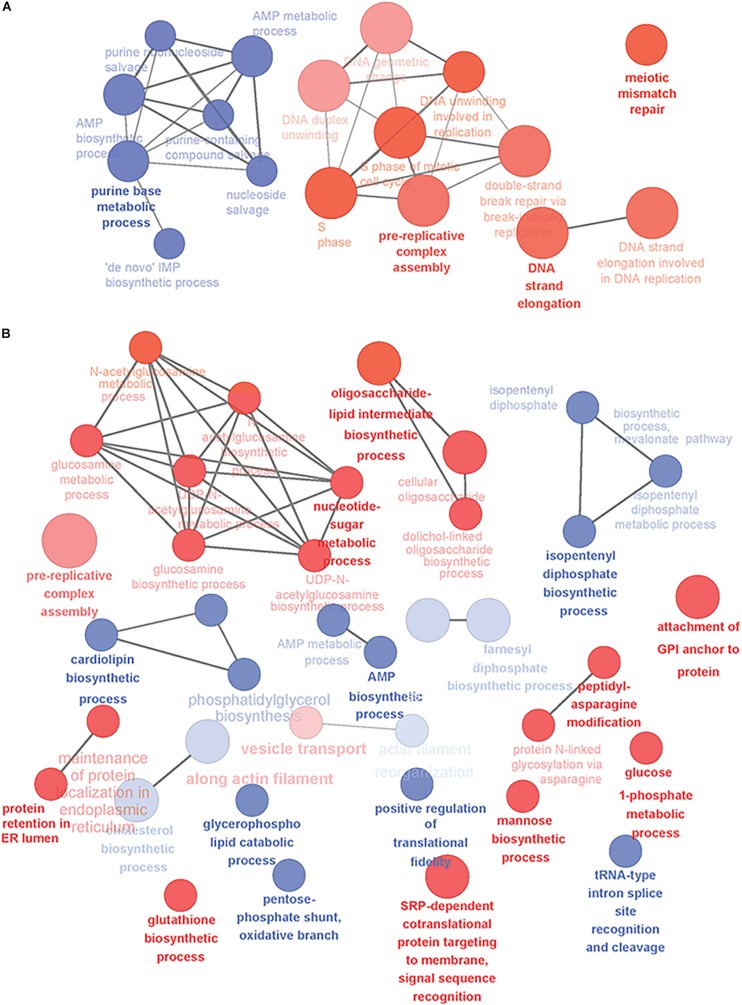
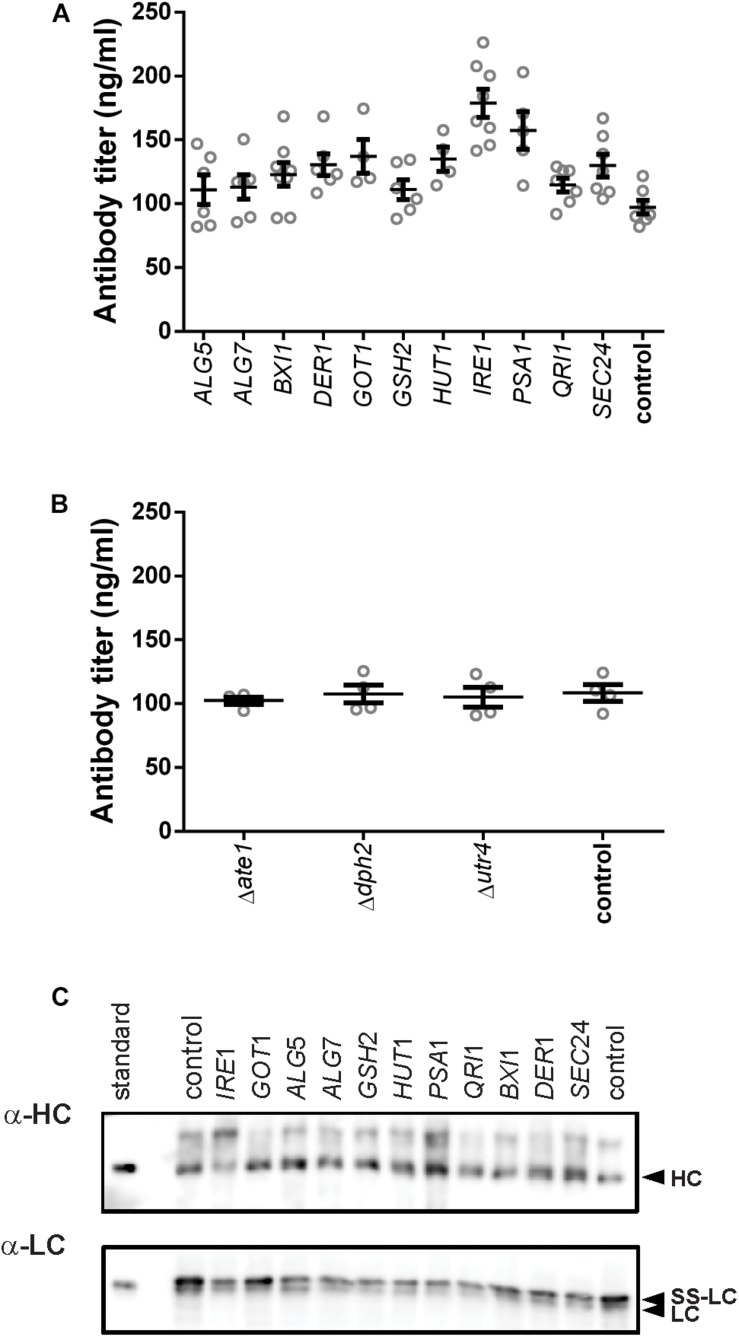
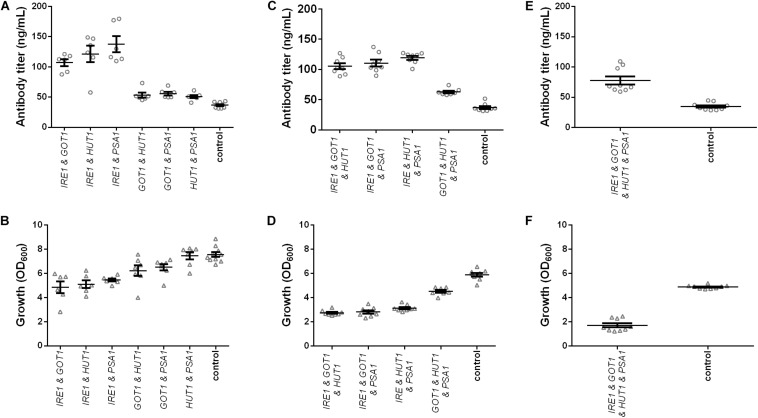
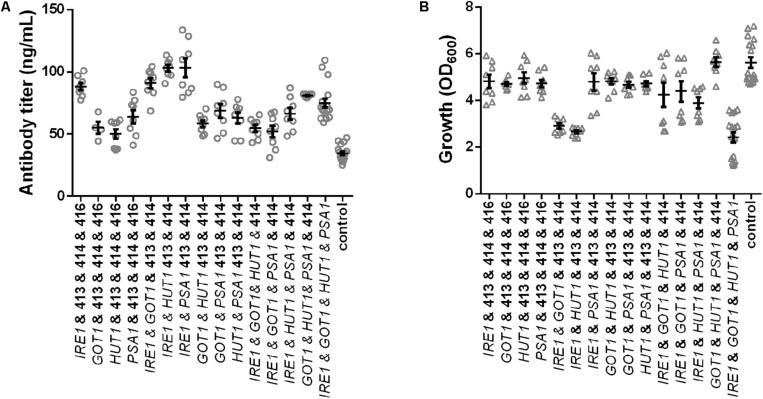
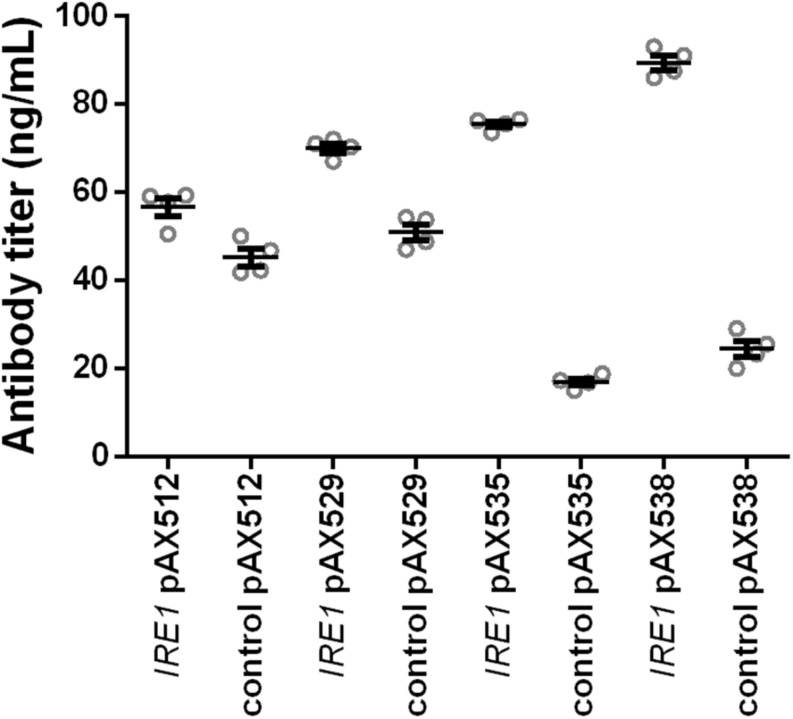
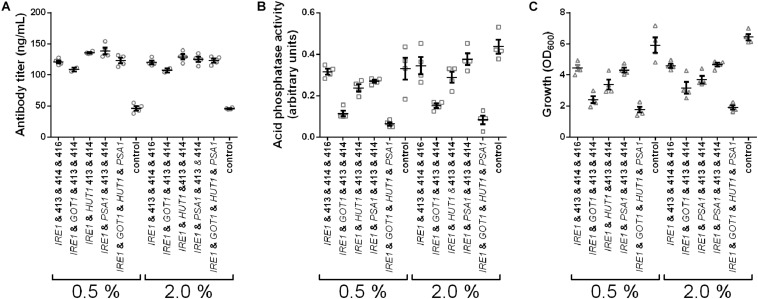
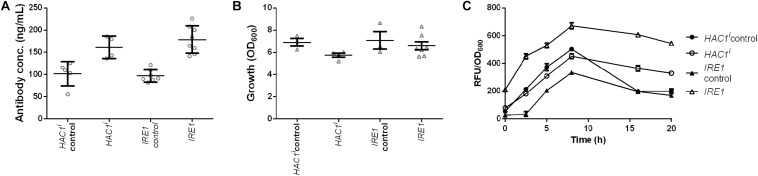
Saccharomyces cerevisiae is a common platform for production of therapeutic proteins, but it is not intrinsically suited for the manufacturing of antibodies. Antibodies are naturally produced by plasma cells (PCs) and studies conducted on PC differentiation provide a comprehensive blueprint for the cellular transformations needed to create an antibody factory. In this study we mined transcriptomics data from PC differentiation to improve antibody secretion by S. cerevisiae. Through data exploration, we identified several new target genes. We tested the effects of 14 genetic modifications belonging to different cellular processes on protein production. Four of the tested genes resulted in improved antibody expression. The ER stress sensor IRE1 increased the final titer by 1.8-fold and smaller effects were observed with PSA1, GOT1, and HUT1 increasing antibody titers by 1. 6-, 1. 4-, and 1.4-fold. When testing combinations of these genes, the highest increases were observed when co-expressing IRE1 with PSA1, or IRE1 with PSA1 and HUT1, resulting in 3.8- and 3.1-fold higher antibody titers. In contrast, strains expressing IRE1 alone or in combination with the other genes produced similar or lower levels of recombinantly expressed endogenous yeast acid phosphatase compared to the controls. Using a genetic UPR responsive GFP reporter construct, we show that IRE1 acts through constitutive activation of the unfolded protein response. Moreover, the positive effect of IRE1 expression was transferable to other antibody molecules. We demonstrate how data exploration from an evolutionary distant, but highly specialized cell type can pinpoint new genetic targets and provide a novel concept for rationalized cell engineering.
Keywords: Saccharomyces cerevisiae; antibody; plasma cell differentiation; synthetic biology; transcriptomics.
Copyright © 2020 Koskela, Gonzalez Salcedo, Piirainen, Iivonen, Salminen and Frey.
Figures
Similar articles
-
Experimental approaches for elucidation of stress-sensing mechanisms of the IRE1 family proteins.Methods Enzymol. 2011;490:195-216. doi: 10.1016/B978-0-12-385114-7.00012-X. Methods Enzymol. 2011. PMID: 21266252
-
Following nature's roadmap: folding factors from plasma cells led to improvements in antibody secretion in S. cerevisiae.Biotechnol J. 2017 Aug;12(8). doi: 10.1002/biot.201600631. Epub 2017 May 24. Biotechnol J. 2017. PMID: 28429845
-
Iron affects Ire1 clustering propensity and the amplitude of endoplasmic reticulum stress signaling.J Cell Sci. 2017 Oct 1;130(19):3222-3233. doi: 10.1242/jcs.201715. Epub 2017 Aug 9. J Cell Sci. 2017. PMID: 28794014 Free PMC article.
-
The Unfolded Protein Response Pathway in the Yeast Kluyveromyces lactis. A Comparative View among Yeast Species.Cells. 2018 Aug 14;7(8):106. doi: 10.3390/cells7080106. Cells. 2018. PMID: 30110882 Free PMC article. Review.
-
The cellular response to protein misfolding in the endoplasmic reticulum.Gene Expr. 1999;7(4-6):293-300. Gene Expr. 1999. PMID: 10440230 Free PMC article. Review.
Cited by
-
Production of galactosylated complex-type N-glycans in glycoengineered Saccharomyces cerevisiae.Appl Microbiol Biotechnol. 2022 Jan;106(1):301-315. doi: 10.1007/s00253-021-11727-8. Epub 2021 Dec 15. Appl Microbiol Biotechnol. 2022. PMID: 34910238 Free PMC article.
-
Early Emergence of Adaptive Mechanisms Sustaining Ig Production: Application to Antibody Therapy.Front Immunol. 2021 Apr 29;12:671998. doi: 10.3389/fimmu.2021.671998. eCollection 2021. Front Immunol. 2021. PMID: 33995412 Free PMC article. Review.
References
-
- Bolstad B. (2004). Low Level Analysis of High-Density Oligonucleotide Array Data: Background, Normalization And Summarization. Berkeley, CA: University of California.
-
- Carlson M. (2016). org.Sc.sgd.db: Genome Wide Annotation for Yeast. Avaliable at: http://bioconductor.org/packages/org.Sc.sgd.db. Version: 3.2.3. (accessed July 06, 2017).
LinkOut - more resources
Full Text Sources
Molecular Biology Databases