

Epidemiology of Seasonal Coronaviruses: Establishing the Context for the Emergence of Coronavirus Disease 2019
- PMID: 32296837
- PMCID: PMC7184404
- DOI: 10.1093/infdis/jiaa185
Epidemiology of Seasonal Coronaviruses: Establishing the Context for the Emergence of Coronavirus Disease 2019
Abstract
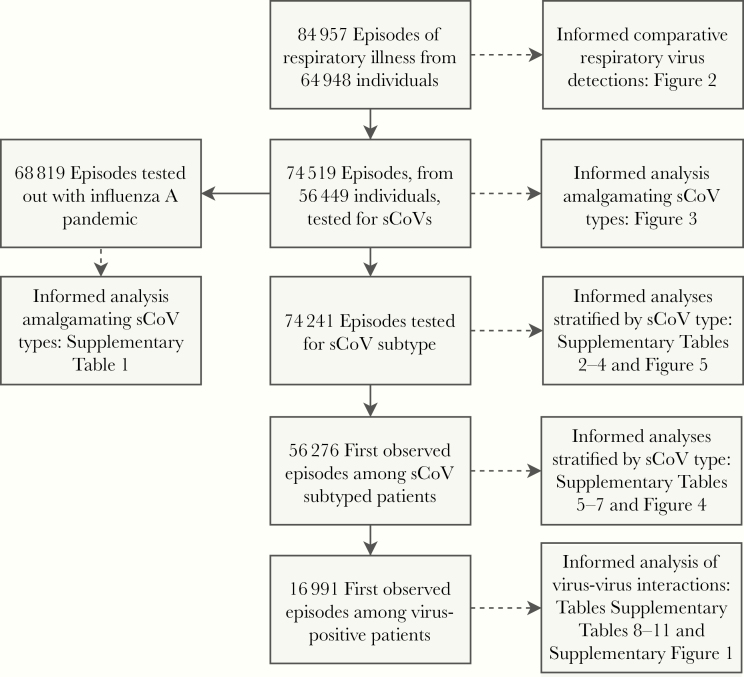
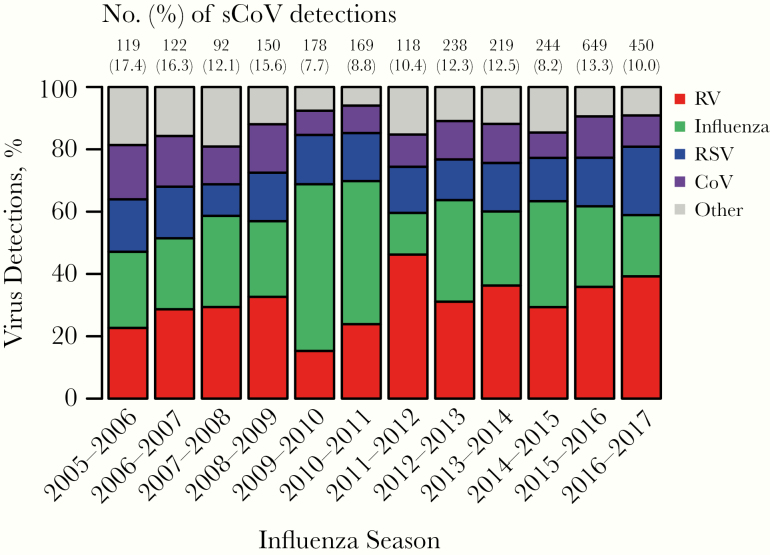
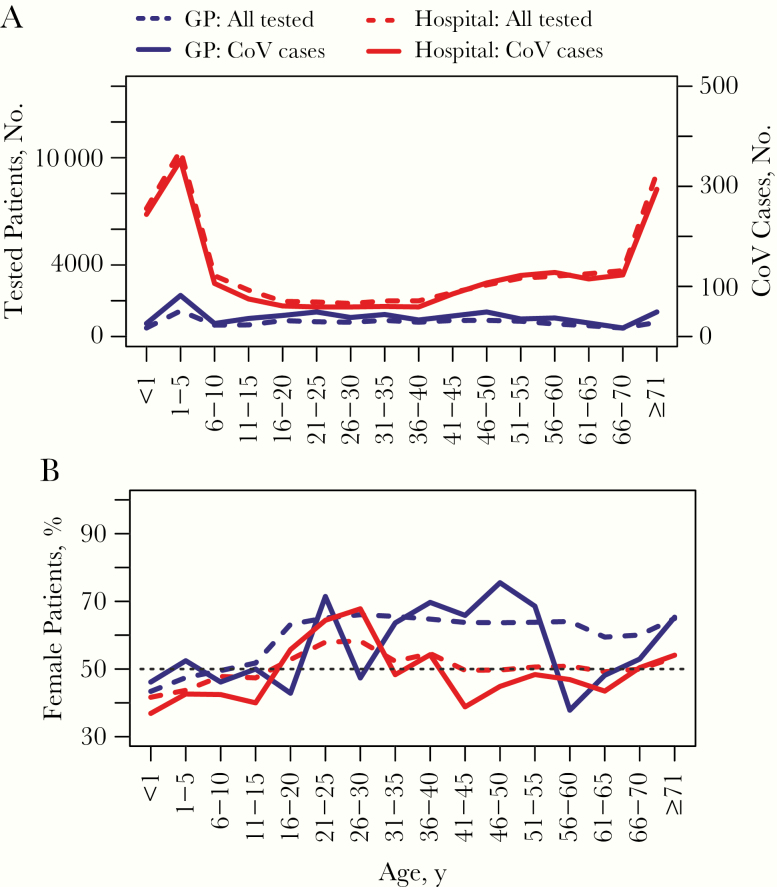
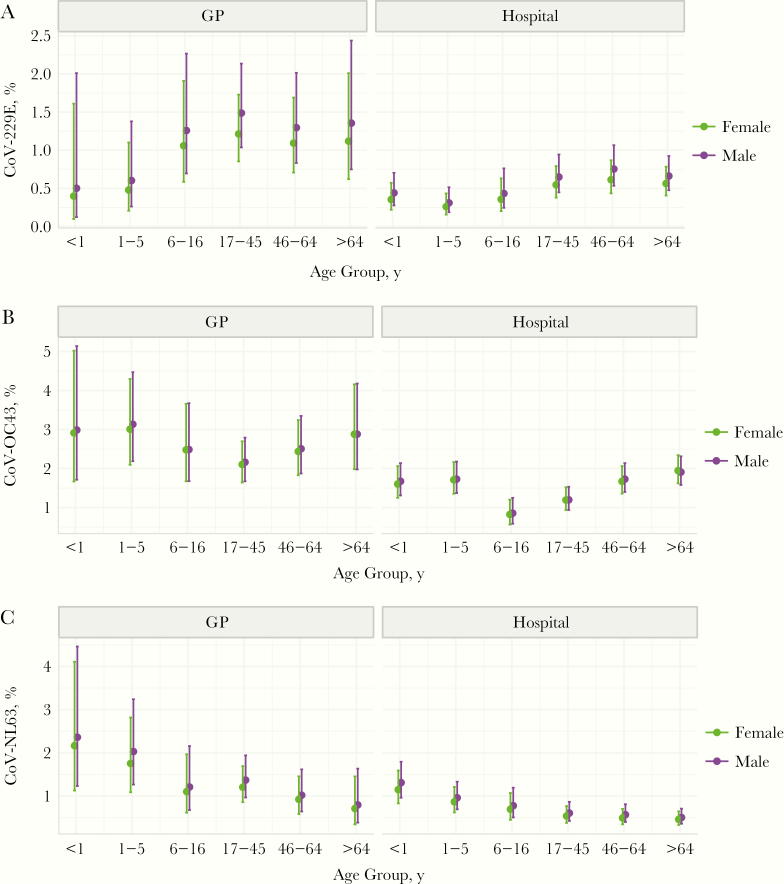
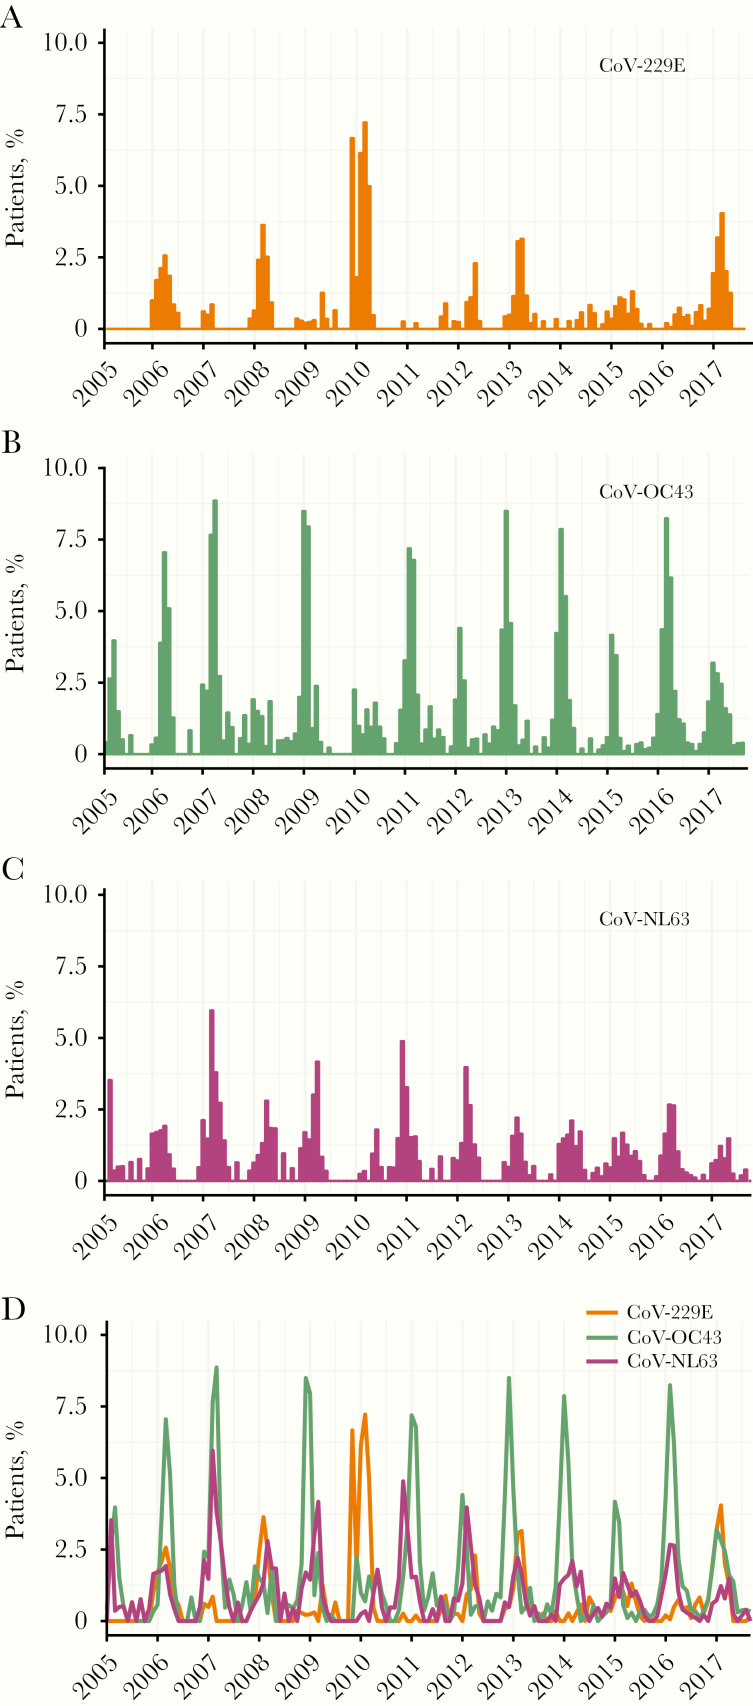
Public health preparedness for coronavirus (CoV) disease 2019 (COVID-19) is challenging in the absence of setting-specific epidemiological data. Here we describe the epidemiology of seasonal CoVs (sCoVs) and other cocirculating viruses in the West of Scotland, United Kingdom. We analyzed routine diagnostic data for >70 000 episodes of respiratory illness tested molecularly for multiple respiratory viruses between 2005 and 2017. Statistical associations with patient age and sex differed between CoV-229E, CoV-OC43, and CoV-NL63. Furthermore, the timing and magnitude of sCoV outbreaks did not occur concurrently, and coinfections were not reported. With respect to other cocirculating respiratory viruses, we found evidence of positive, rather than negative, interactions with sCoVs. These findings highlight the importance of considering cocirculating viruses in the differential diagnosis of COVID-19. Further work is needed to establish the occurrence/degree of cross-protective immunity conferred across sCoVs and with COVID-19, as well as the role of viral coinfection in COVID-19 disease severity.
Keywords: SARS-CoV-2; Acute respiratory infections; Coinfection; Disease surveillance; Virus-virus interactions.
© The Author(s) 2020. Published by Oxford University Press for the Infectious Diseases Society of America.
Figures
Comment in
-
Reply to Li et al.J Infect Dis. 2020 Jul 23;222(4):696-698. doi: 10.1093/infdis/jiaa322. J Infect Dis. 2020. PMID: 32497172 No abstract available.
-
Estimating Global Epidemiology of Low-Pathogenic Human Coronaviruses in Relation to the COVID-19 Context.J Infect Dis. 2020 Jul 23;222(4):695-696. doi: 10.1093/infdis/jiaa321. J Infect Dis. 2020. PMID: 32497175 Free PMC article. No abstract available.
-
Plasmodium falciparum Infection May Protect a Population from Severe Acute Respiratory Syndrome Coronavirus 2 Infection.J Infect Dis. 2020 Oct 1;222(9):1570-1571. doi: 10.1093/infdis/jiaa455. J Infect Dis. 2020. PMID: 32726446 Free PMC article. No abstract available.
References
-
- World Health Organization. WHO announces COVID-19 outbreak a pandemic. 2020. http://www.euro.who.int/en/health-topics/health-emergencies/coronavirus-.... Accessed 10 April 2020.
-
- Graham NM. The epidemiology of acute respiratory infections in children and adults: a global perspective. Epidemiol Rev 1990; 12:149–78. - PubMed
Publication types
MeSH terms
LinkOut - more resources
Full Text Sources
Miscellaneous
