. 2020 May;98(5):735-749.
doi: 10.1007/s00109-020-01898-8. Epub 2020 Apr 15.

S100A4 mRNA-protein relationship uncovered by measurement noise reduction

Affiliations

S100A4 mRNA-protein relationship uncovered by measurement noise reduction

Angelos-Theodoros Athanasiou et al. J Mol Med (Berl). 2020 May.

Abstract

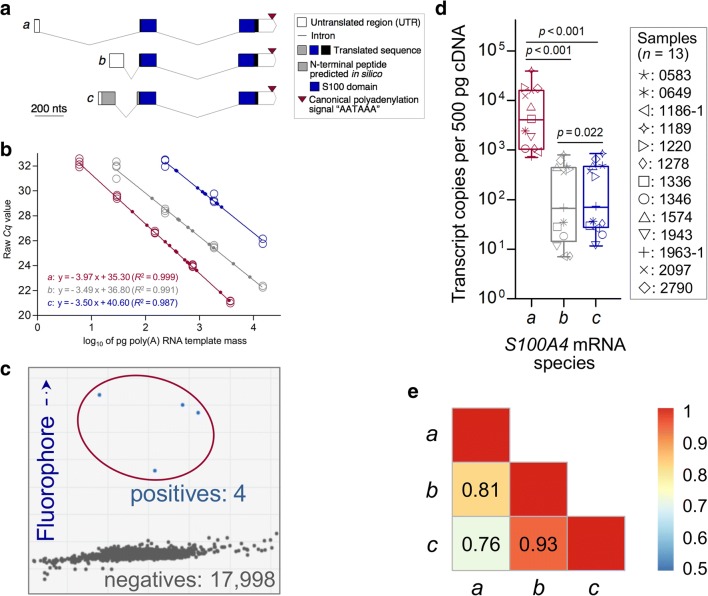
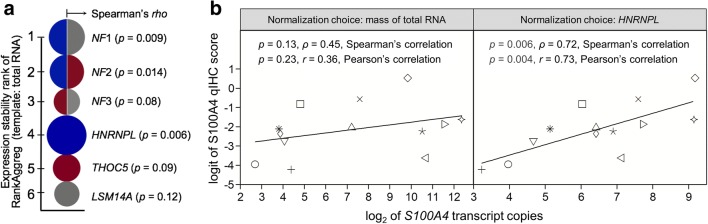
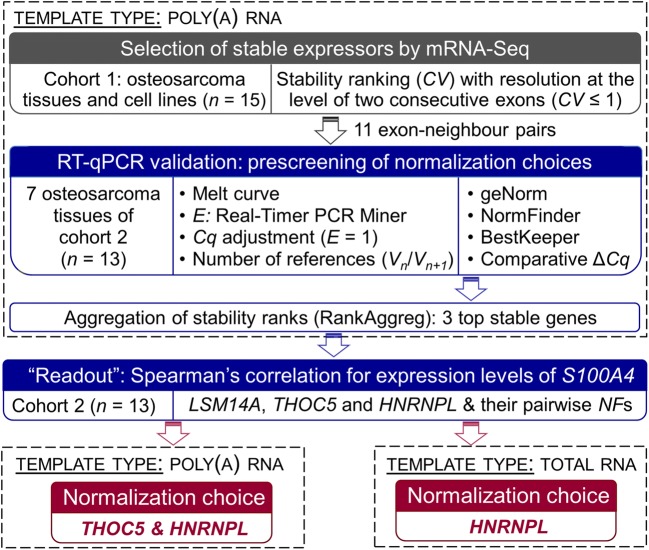
Intrinsic biological fluctuation and/or measurement error can obscure the association of gene expression patterns between RNA and protein levels. Appropriate normalization of reverse-transcription quantitative PCR (RT-qPCR) data can reduce technical noise in transcript measurement, thus uncovering such relationships. The accuracy of gene expression measurement is often challenged in the context of cancer due to the genetic instability and "splicing weakness" involved. Here, we sequenced the poly(A) cancer transcriptome of canine osteosarcoma using mRNA-Seq. Expressed sequences were resolved at the level of two consecutive exons to enable the design of exon-border spanning RT-qPCR assays and ranked for stability based on the coefficient of variation (CV). Using the same template type for RT-qPCR validation, i.e. poly(A) RNA, avoided skewing of stability assessment by circular RNAs (circRNAs) and/or rRNA deregulation. The strength of the relationship between mRNA expression of the tumour marker S100A4 and its proportion score of quantitative immunohistochemistry (qIHC) was introduced as an experimental readout to fine-tune the normalization choice. Together with the essential logit transformation of qIHC scores, this approach reduced the noise of measurement as demonstrated by uncovering a highly significant, strong association between mRNA and protein expressions of S100A4 (Spearman's coefficient ρ = 0.72 (p = 0.006)). KEY MESSAGES: • RNA-seq identifies stable pairs of consecutive exons in a heterogeneous tumour. • Poly(A) RNA templates for RT-qPCR avoid bias from circRNA and rRNA deregulation. • HNRNPL is stably expressed across various cancer tissues and osteosarcoma. • Logit transformed qIHC score better associates with mRNA amount. • Quantification of minor S100A4 mRNA species requires poly(A) RNA templates and dPCR.

Keywords: Cancer; Quantitative immunohistochemistry; RNA sequencing; RT-qPCR data normalization; Stably consecutive expressed exons; mRNA-protein correlation.


Conflict of interest statement

The authors declare that they have no conflicts of interest.

Figures

Fig. 1
Fig. 1
Canine osteosarcoma samples segregate into three main clusters according to unsupervised hierarchical cluster analysis of mRNA-Seq data. The decreasing level of expression correlation is illustrated by red to blue colour (Spearman’s ρ of 1 to 0.8, respectively). Samples: set 1. T: osteosarcoma tissue, C: primary cell culture of osteosarcoma
Fig. 2
Fig. 2
Stability of single exons or pairs of neighbour exons based on CV in mRNA-Seq data of canine osteosarcoma (sample set 1). CV values were plotted against mRNA abundance representing log2-transformed transcripts per kilobase million. Single exons and pairs of neighbour exons used for RT-qPCR validation were depicted by grey plus signs and filled dots of light blue colour, respectively. Gene symbols highlight SEGs used in previous RT-qPCR studies of canine osteosarcoma derived from educated guessing (B2M, RPS5, RPS19, HNRNPH), from interspecies expression stability assessment of transcriptome data (OAZ1) or by array-based comparative genomic hybridization for the context (C26H12orf43) (references in Table S5). Their most stable two consecutive exons are exemplarily depicted. Common traditional normalizers such as GAPDH and HPRT1 even exceeded the threshold of CV ≤ 1 (data not shown). Note that the Ensembl Genome Browser used for read mapping does not list OASL and C26H12orf43 as separate genes in contrast to the NCBI database
Fig. 3
Fig. 3
The hundred most stable genes are enriched in key biological processes. Ranking of genes and biological processes is based on CV and false discovery rate (FDR), respectively. P values were obtained by Fisher’s exact test and corrected by the Benjamini-Hochberg post hoc method. Gene number: number of genes from the input list assigned to a certain process category. Frequency: number of genes of the input list annotated to a particular GO term divided by its total gene number (illustrated by the size of sectors in the pie chart)
Fig. 4
Fig. 4
Tukey box plot depicting the abundance range of single or neighbouring exons for canine osteosarcoma tissues (sample set 2). Boxes represent the lower and upper quartiles centered on the median. Whiskers indicate the Tukey confidence intervals. Blue and grey: exon pair or single exon identified by mRNA-Seq analysis, respectively (this study), red: RT-qPCR normalizers identified by array-based comparative genomic hybridization for the biological context [19]. Numbering of the respective exons is provided in Table S3. The R code used for generating the plot is provided as File S3
Fig. 5
Fig. 5
S100A4 mRNAs in canine osteosarcoma: structure, copy numbers and pairwise correlation of variants. a Exon-intron structure of validated S100A4 transcripts a, b and c (GenBank IDs: NM_001003161.3,NM_001363554.1 and NM_001362597.2, respectively). The length of the 3′ UTR and the common distance between the canonical poly(A) signal AAUAAA and the poly(A) stretch (~ 21 nucleotides) were confirmed by Sanger sequencing of amplicons produced by Rapid Amplification of 3’ cDNA Ends (consensus primers: GenBank accession number MK138547, primers against transcript variant c: MK584633). A putative proximal, non-canonical signal for alternative polyadenylation predicted in silico (Table S7) is not presented. We note that the N-terminal peptide extension predicted for the dog/dingo (GenBank accessions NP_001349526.2 and XP_025284715, respectively) or feline species (Acinonyx jubatus: XP_014941010.1, Panthera pardus: XP_019287133.1) still awaits experimental validation. b Dynamic ranges of qPCRs applied to quantify the S100A4 mRNAs. c dPCR plot of a sample that did not reach the limit of quantification in the respective qPCR assay (sample: #1186–1, assay against minor variant b). d Copy numbers of S100A4 mRNAs normalized by the novel NF (geometric mean of two consecutive exons of HNRNPL and THOC5) and assessed for significance by the nonparametric Wilcoxon Signed Rank Test for paired data. e Pairwise co-expressions across variants evaluated by Spearman’s rank correlation coefficient (blue to red: fair to perfect correlation)
Fig. 6
Fig. 6
Automatic quantification of S100A4 distribution in paraffin-embedded sections of canine osteosarcoma by qIHC. Representative samples with high, moderate and low frequencies of positive areas (areas with brown staining) are depicted from right to left. Leftmost: negative control without primary antibody
Fig. 7
Fig. 7
Noise reduction in transcript normalization uncovered association between mRNA and protein expressions of S100A4 in canine osteosarcoma. a “Pearl” diagram presenting the stability of the three reference genes (depicted by colour) most stably expressed at the template level of poly(A) RNA in comparison to their two-gene combinations (NF1 to NF3) (depicted by bicolour circles). The best normalization choice for total RNA templates was determined by rank aggregation. The noise reduction of transcript measurement resulting from better normalization of target gene expression is illustrated by the increased circle radius that is proportional to the Spearman’s rank correlation coefficient (ρ) obtained for the linear association between mRNA abundance of S100A4 and proportion of tumour area positive for its protein (Fig. 7b). b Copy number of S100A4 mRNA was normalized by either the input amount of template in cDNA synthesis (left) or the best normalizer identified by using expression correlation analysis as the experimental “readout” (Fig. 7a, Data S5). ρ: Spearman’s rank correlation coefficient; r: Pearson’s correlation coefficient; p: significance value
Fig. 8
Fig. 8
Methodology to select stable sequences for accurate normalization of RT-qPCR data in the context of canine osteosarcoma. The grey section shows the identification of neighbouring exon pairs with stable expression based on their CV in poly(A)-transcriptome sequencing by mRNA-Seq (grey box). To validate their expression stability by RT-qPCR, the same template type as of mRNA-Seq, i.e. poly(A) RNA was targeted (upper dashed box), and multiple statistical algorithms were applied (blue box). The exon pairs of HNRNPL, THOC5 and LSM14A (Fig. 7a) were most stably expressed in poly(A) RNA templates according to rank aggregation (RankAggreg algorithm [48]). Together with their pairwise combinations (NFs) they were re-evaluated on the template level of total RNA. Strength of relationship between the expression intensity of S100A4 at the mRNA and protein levels was used as the experimental “readout” for re-evaluation. We introduced this “post-control” to enable compensation for attributing the same weight to every stability algorithm, a practical option without any biological meaning that is arguable because some of the analytical approaches applied here for stability assessment include redundant information [25], as well as to compensate for changing the type of RNA template (right dashed box) and the composition of the RNA cohort. HNRNPL, a gene that exhibits a predominantly consistent expression across a wide range of human cancers [35], alone or together with THOC5 was proposed by the workflow as normalization choice for total RNA or poly(A) RNA templates isolated from osteosarcomas (red boxes)

References

    1. Kosti I, Jain N, Aran D, Butte AJ, Sirota M. Cross-tissue analysis of gene and protein expression in normal and cancer tissues. Sci Rep. 2016;6:24799. - PMC - PubMed
    1. Edfors F, Danielsson F, Hallstrom BM, Kall L, Lundberg E, Ponten F, Forsstrom B, Uhlen M. Gene-specific correlation of RNA and protein levels in human cells and tissues. Mol Syst Biol. 2016;12(10):883. - PMC - PubMed
    1. Simpson S, Dunning MD, de Brot S, Grau-Roma L, Mongan NP, Rutland CS. Comparative review of human and canine osteosarcoma: morphology, epidemiology, prognosis, treatment and genetics. Acta Vet Scand. 2017;59(1):71. - PMC - PubMed
    1. Makielski KM, Mills LJ, Sarver AL, Henson MS, Spector LG, Naik S, Modiano JF. Risk factors for development of canine and human osteosarcoma: a comparative review. Vet Sci. 2019;6(2):e48. - PMC - PubMed
    1. Diessner BJ, Marko TA, Scott RM, Eckert AL, Stuebner KM, Hohenhaus AE, Selting KA, Largaespada DA, Modiano JF, Spector LG. A comparison of risk factors for metastasis at diagnosis in humans and dogs with osteosarcoma. Cancer Med. 2019;8(6):3216–3226. - PMC - PubMed

Publication types

Substances