. 2020 Apr 16;10(1):41.
doi: 10.1186/s13613-020-00658-8.

Diastolic shock index and clinical outcomes in patients with septic shock

Affiliations

Diastolic shock index and clinical outcomes in patients with septic shock

Gustavo A Ospina-Tascón et al. Ann Intensive Care. .

Abstract

Background: Loss of vascular tone is a key pathophysiological feature of septic shock. Combination of gradual diastolic hypotension and tachycardia could reflect more serious vasodilatory conditions. We sought to evaluate the relationships between heart rate (HR) to diastolic arterial pressure (DAP) ratios and clinical outcomes during early phases of septic shock.

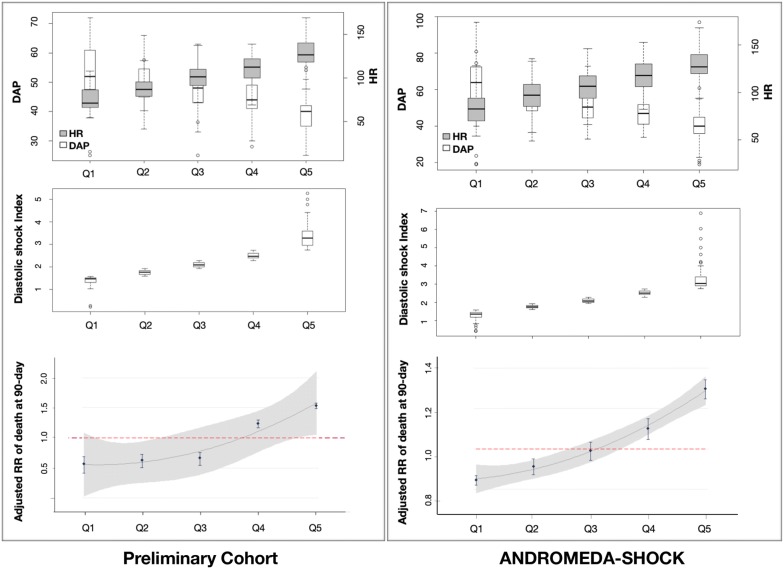
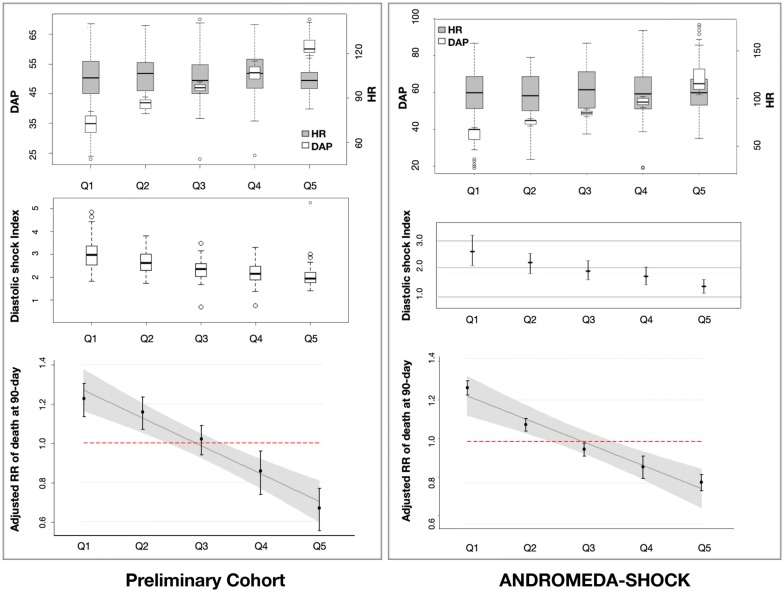
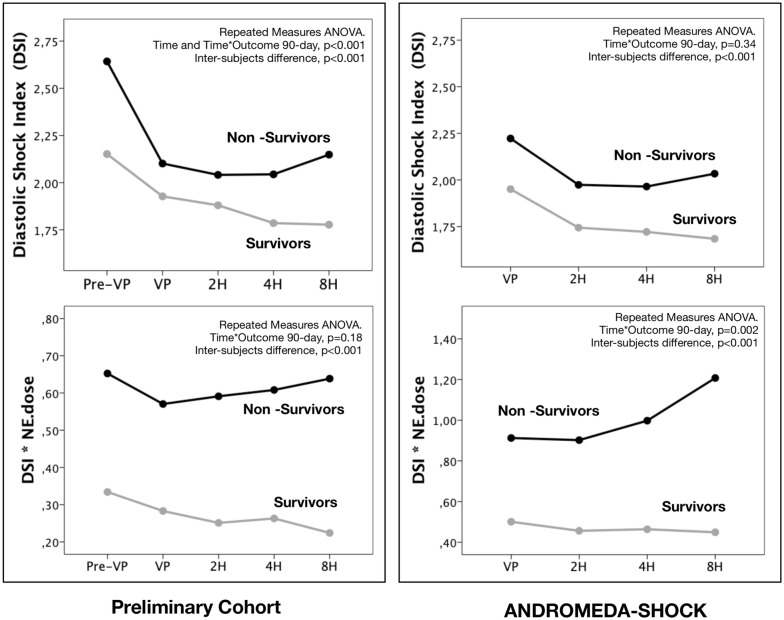
Methods: Diastolic shock index (DSI) was defined as the ratio between HR and DAP. DSI calculated just before starting vasopressors (Pre-VPs/DSI) in a preliminary cohort of 337 patients with septic shock (January 2015 to February 2017) and at vasopressor start (VPs/DSI) in 424 patients with septic shock included in a recent randomized controlled trial (ANDROMEDA-SHOCK; March 2017 to April 2018) was partitioned into five quantiles to estimate the relative risks (RR) of death with respect to the mean risk of each population (assumed to be 1). Matched HR and DAP subsamples were created to evaluate the effect of the individual components of the DSI on RRs. In addition, time-course of DSI and interaction between DSI and vasopressor dose (DSI*NE.dose) were compared between survivors and non-survivors from both populations, while ROC curves were used to identify variables predicting mortality. Finally, as exploratory observation, effect of early start of vasopressors was evaluated at each Pre-VPs/DSI quintile from the preliminary cohort.

Results: Risk of death progressively increased at gradual increments of Pre-VPs/DSI or VPs/DSI (One-way ANOVA, p < 0.001). Progressive DAP decrease or HR increase was associated with higher mortality risks only when DSI concomitantly increased. Areas under the ROC curve for Pre-VPs/DSI, SOFA and initial lactate were similar, while mean arterial pressure and systolic shock index showed poor performances to predict mortality. Time-course of DSI and DSI*NE.dose was significantly higher in non-survivors from both populations (repeated-measures ANOVA, p < 0.001). Very early start of vasopressors exhibited an apparent benefit at higher Pre-VPs/DSI quintile.

Conclusions: DSI at pre-vasopressor and vasopressor start points might represent a very early identifier of patients at high risk of death. Isolated DAP or HR values do not clearly identify such risk. Usefulness of DSI to trigger or to direct therapeutic interventions in early resuscitation of septic shock need to be addressed in future studies.

Keywords: Acute circulatory dysfunction; Clinical outcomes; Diastolic shock index; Septic shock.


Conflict of interest statement

The authors declare that they have no competing interests.

Figures

Fig. 1
Fig. 1
Relative risk of death at day-90 according to pre-vasopressor diastolic shock index (Pre-VPs/DSI) or vasopressor start (VPs/DSI) partitions in the preliminary and ANDROMEDA SHOCK populations. Diastolic shock index values obtained from just before the start of vasopressor (in preliminary cohort) and at the start vasopressor support (in ANDROMEDA-SHOCK) were partitioned into 5 quantiles (Q1 to Q5). Distribution of heart rate (HR) and diastolic pressure (DAP) (top) and their respective diastolic shock index distribution (middle) are presented through the quantile distribution. Boxplots (top and middle) delineate the interquartile range, the median is shown as a line in the middle of the box, and tails represent the 95% range. Coefficients derived from a logistical regression were used to calculate the cut-off value of the diastolic shock index (DSI) detecting the mean risk of mortality of the entire population at 28 days. This point was used as the reference to calculate the adjusted relative risks, in such a way that a relative risk of 1 represents the mean risk of the respective population (bottom). The mean risk and 95% confidence interval (error bars at the bottom) for each percentile were calculated after multivariate adjustment (Cox proportional-hazards model) for the covariables: age, gender, SOFA score day-1, initial arterial lactate and pH, and resuscitation fluids from VP to 8H. The gray zone represents the 95% confidence interval for the Cox regression (continuous line) across the complete population, assuming the diastolic shock index as a continuous variable. Note that adjusted relative risk of death increases as diastolic shock index also does through the quintile distribution
Fig. 2
Fig. 2
Relative risk of death at day-90 according to diastolic arterial pressure (DAP) partition in the preliminary and ANDROMEDA SHOCK populations. Diastolic arterial pressure (DAP) values from just before the start of vasopressor support were partitioned into 5 quantiles (Q1 to Q5). Distribution of heart rate (HR) and diastolic pressure (DAP) (top) displays a progressive increasing of DAP values through the quantile partitioning with their corresponding HR values, which remains similar from Q1 to Q5. The respective diastolic shock index distribution (middle) is presented through the quantile distribution. The boxes (top) delineate the interquartile range, the median is shown as a line in the middle of the box, and tails represent the 95% range. Boxplots/error bars (middle) represent medians and 95% confidence intervals of the diastolic shock index (DSI) at each quantile. Relative risks’ distributions (bottom) were calculated as described in Fig. 1. Note that adjusted relative risk of death decreases as DAP increases and subsequently DSI decreases, for similar HR values
Fig. 3
Fig. 3
Relative risk of death at day-28 according to heart rate (HR) partition the preliminary and ANDROMEDA SHOCK populations. Heart rate (HR) values from just before the start of vasopressor support were partitioned into 5 quantiles (Q1 to Q5). Distribution of heart rate (HR) and diastolic pressure (DAP) (top) displays a progressive increasing of HR values through the quantile partitioning with their corresponding DAP values, which remains similar from Q1 to Q5. The respective diastolic shock index distribution (middle) is presented through the quantile distribution. The boxes (top) delineate the interquartile range, the median is shown as a line in the middle of the box, and tails represent the 95% range. Boxplots/error bars (middle) represent medians and 95% confidence intervals of the diastolic shock index (DSI) at each quantile. Relative risks’ distributions (bottom) were calculated as described in Fig. 1. Note that adjusted relative risk of death increases as HR and subsequently DSI also increases, for similar DAP values
Fig. 4
Fig. 4
Time-course of diastolic shock index (DSI) and the interaction between DSI and norepinephrine dose for survivors and non-survivors at day-90 in the preliminary cohort and ANDROMEDA-SHOCK. Left panel, Top. Time-course of DSI for survivors and non-survivors at day-90 in the preliminary cohort. Repeated-measures ANOVA, Time*Outcome day-90, p < 0.001. Inter-subjects difference, p < 0.001. Left panel, Bottom. Time-course of interaction of DSI and norepinephrine dose for survivors and non-survivors at day-90 in the preliminary cohort. Repeated-measures ANOVA, Time*Outcome day-90, p = 0.18. Inter-subjects’ difference, p < 0.001. Right panel, Top. Time-course of DSI for survivors and non-survivors at day-90 in ANDROMEDA-SHOCK population. Repeated-measures ANOVA, Time*Outcome day-90, p = 0.34. Inter-subjects difference, p < 0.001. Right panel, Bottom. Time-course of interaction of DSI and norepinephrine dose for survivors and non-survivors at day-90 in ANDROMEDA-SHOCK population. Repeated-measures ANOVA, Time*Outcome day-90, p = 0.02. Inter-subjects’ difference, p < 0.001

References

    1. Cecconi M, De Backer D, Antonelli M, Beale R, Bakker J, Hofer C, et al. Consensus on circulatory shock and hemodynamic monitoring. Task force of the European Society of Intensive Care Medicine. Intensive Care Med. 2014;40(12):1795–1815. doi: 10.1007/s00134-014-3525-z. - DOI - PMC - PubMed
    1. van Diepen S, Katz JN, Albert NM, Henry TD, Jacobs AK, Kapur NK, et al. Contemporary management of cardiogenic shock: a Scientific Statement From the American Heart Association. Circulation. 2017;136(16):e232–e268. - PubMed
    1. Stern SA, Dronen SC, Birrer P, Wang X. Effect of blood pressure on hemorrhage volume and survival in a near-fatal hemorrhage model incorporating a vascular injury. Ann Emerg Med. 1993;22(2):155–163. doi: 10.1016/S0196-0644(05)80195-7. - DOI - PubMed
    1. Vincent JL, De Backer D. Circulatory shock. N Engl J Med. 2013;369(18):1726–1734. doi: 10.1056/NEJMra1208943. - DOI - PubMed
    1. Siegel JH, Greenspan M, Del Guercio LR. Abnormal vascular tone, defective oxygen transport and myocardial failure in human septic shock. Ann Surg. 1967;165(4):504–517. doi: 10.1097/00000658-196704000-00002. - DOI - PMC - PubMed