

The developmental and iron nutritional pattern of PIC1 and NiCo does not support their interdependent and exclusive collaboration in chloroplast iron transport in Brassica napus
- PMID: 32297017
- PMCID: PMC7214486
- DOI: 10.1007/s00425-020-03388-0
The developmental and iron nutritional pattern of PIC1 and NiCo does not support their interdependent and exclusive collaboration in chloroplast iron transport in Brassica napus
Abstract
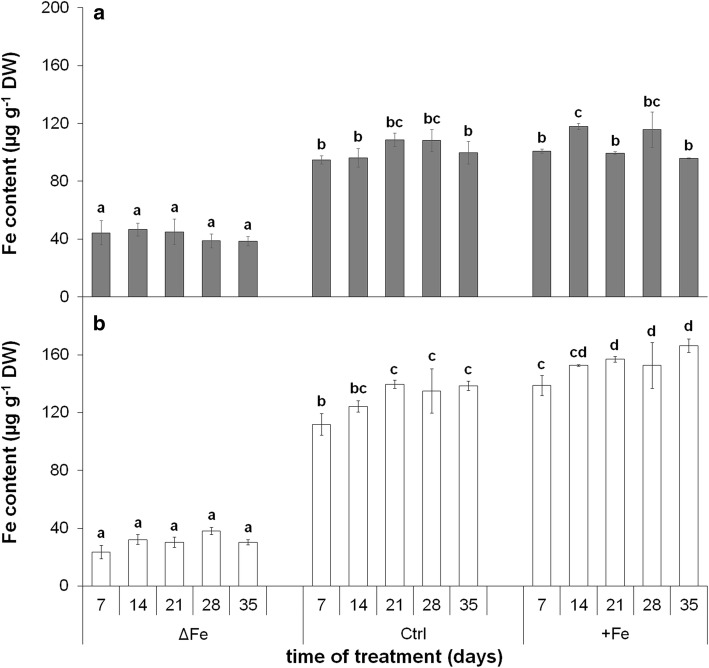
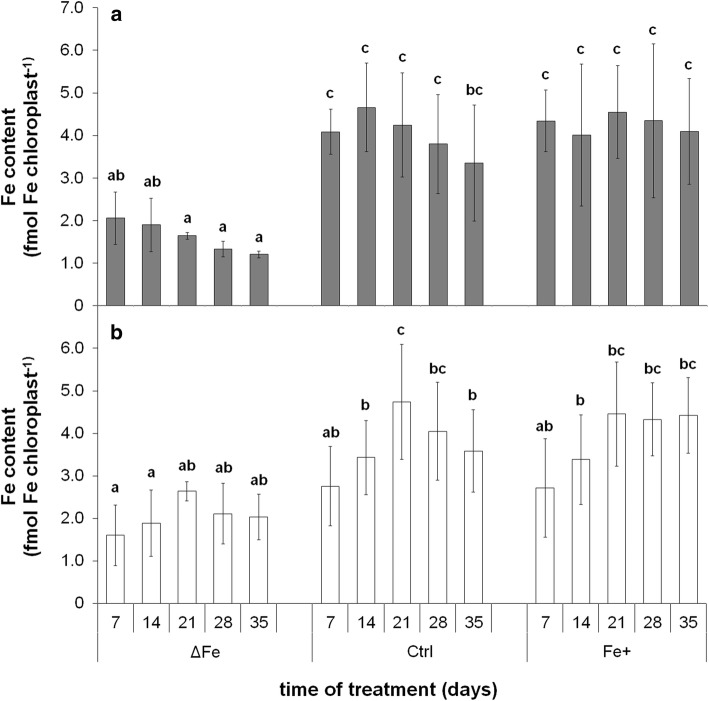
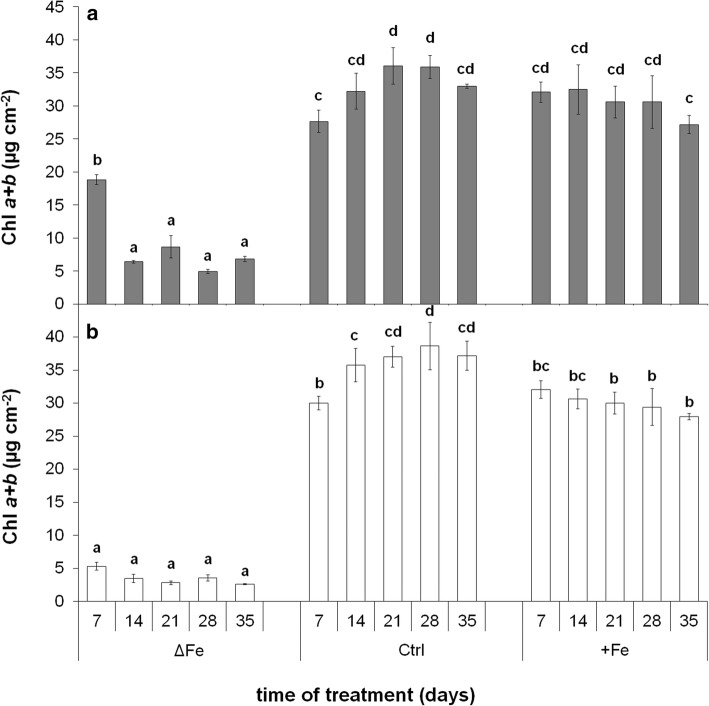
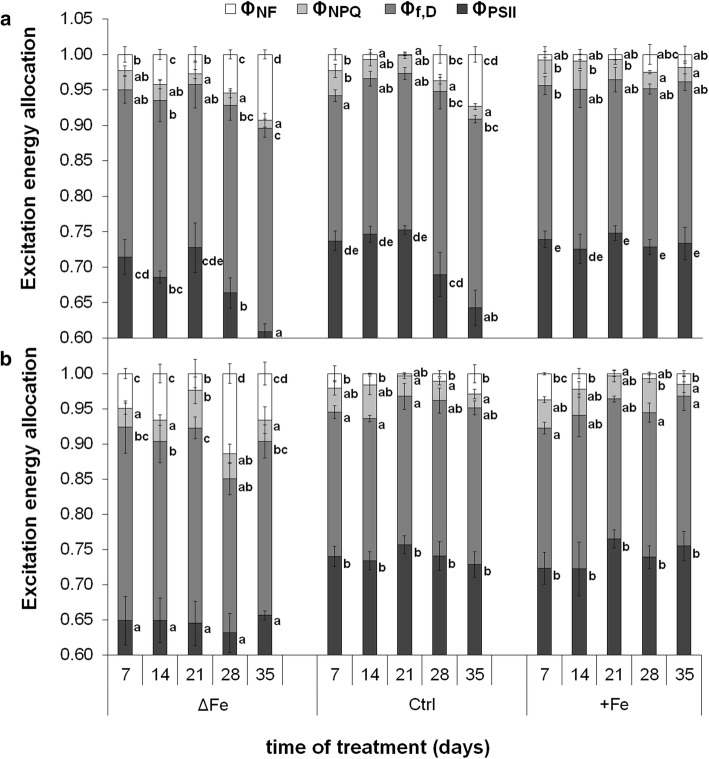
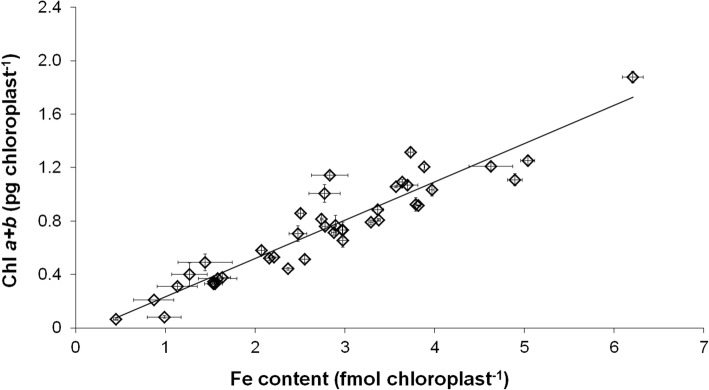
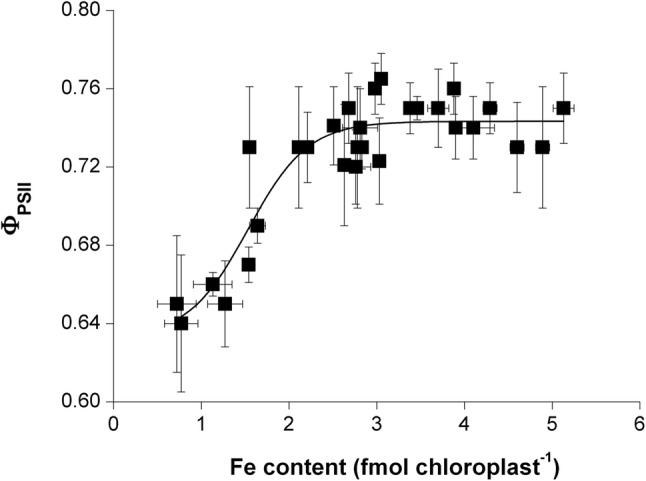
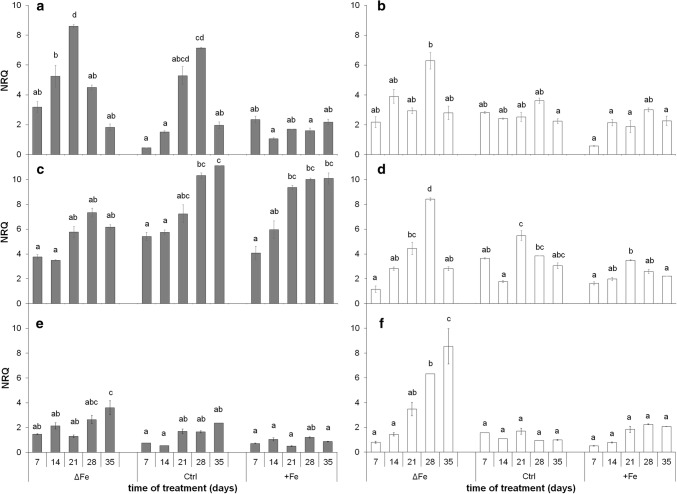
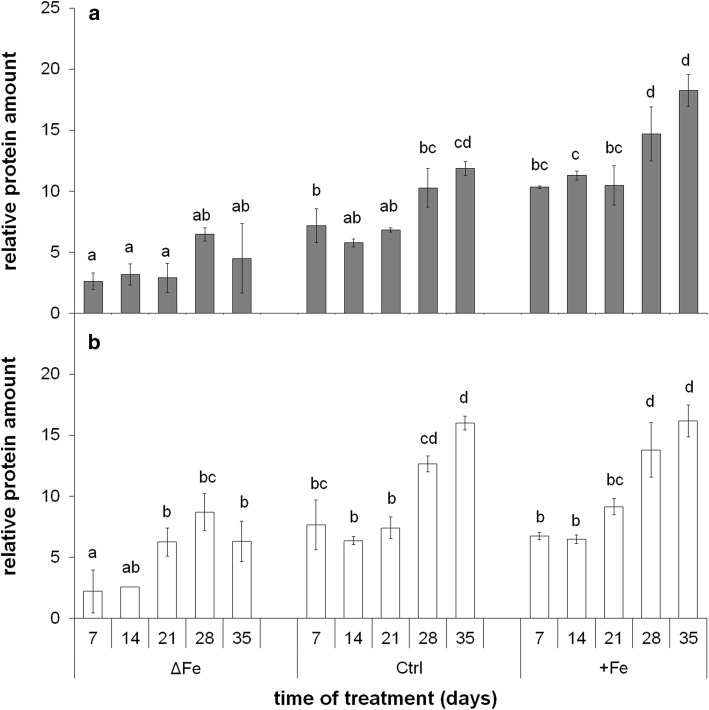
The accumulation of NiCo following the termination of the accumulation of iron in chloroplast suggests that NiCo is not solely involved in iron uptake processes of chloroplasts. Chloroplast iron (Fe) uptake is thought to be operated by a complex containing permease in chloroplast 1 (PIC1) and nickel-cobalt transporter (NiCo) proteins, whereas the role of other Fe homeostasis-related transporters such as multiple antibiotic resistance protein 1 (MAR1) is less characterized. Although pieces of information exist on the regulation of chloroplast Fe uptake, including the effect of plant Fe homeostasis, the whole system has not been revealed in detail yet. Thus, we aimed to follow leaf development-scale changes in the chloroplast Fe uptake components PIC1, NiCo and MAR1 under deficient, optimal and supraoptimal Fe nutrition using Brassica napus as model. Fe deficiency decreased both the photosynthetic activity and the Fe content of plastids. Supraoptimal Fe nutrition caused neither Fe accumulation in chloroplasts nor any toxic effects, thus only fully saturated the need for Fe in the leaves. In parallel with the increasing Fe supply of plants and ageing of the leaves, the expression of BnPIC1 was tendentiously repressed. Though transcript and protein amount of BnNiCo tendentiously increased during leaf development, it was even markedly upregulated in ageing leaves. The relative transcript amount of BnMAR1 increased mainly in ageing leaves facing Fe deficiency. Taken together chloroplast physiology, Fe content and transcript amount data, the exclusive participation of NiCo in the chloroplast Fe uptake is not supported. Saturation of the Fe requirement of chloroplasts seems to be linked to the delay of decomposing the photosynthetic apparatus and keeping chloroplast Fe homeostasis in a rather constant status together with a supressed Fe uptake machinery.
Keywords: Chloroplast; Iron deficiency; Iron homeostasis; Leaf development; Supraoptimal iron nutrition.
Conflict of interest statement
All authors state that there is no conflict of interest in relation with the present work.
Figures
References
-
- Andersen CL, Jensen JL, Ørntoft TF. Normalization of real-time quantitative reverse transcription-PCR data: a model-based variance estimation approach to identify genes suited for normalization, applied to bladder and colon cancer data sets. Cancer Res. 2004;64:5245–5250. doi: 10.1158/0008-5472.CAN-04-0496. - DOI - PubMed
-
- Basa B, Lattanzio G, Solti Á, Tóth B, Abadía J, Fodor F, Sárvári É. Changes induced by cadmium stress and iron deficiency in the composition and organization of thylakoid complexes in sugar beet (Beta vulgaris L.) Environ Exp Bot. 2014;101:1–11. doi: 10.1016/j.envexpbot.2013.12.026. - DOI
-
- Becker M, Asch F. Fe toxicity in rice—conditions and management concepts. J Plant Nutr Soil Sci. 2005;168:558–573. doi: 10.1002/jpln.200520504. - DOI
-
- Briat JF, Lobréaux S. Fe transport and storage in plants. Trends Plant Sci. 1997;2:187–193. doi: 10.1016/S1360-1385(97)85225-9. - DOI
MeSH terms
Substances
Grants and funding
LinkOut - more resources
Full Text Sources
Medical
Research Materials
