. 2020 Jun;10(6):1115-1121.
doi: 10.1002/2211-5463.12861. Epub 2020 Apr 30.

PU.1 regulates Ccr7 gene expression by binding to its promoter in naïve CD4+ T cells

Affiliations

PU.1 regulates Ccr7 gene expression by binding to its promoter in naïve CD4+ T cells

Takuya Yashiro et al. FEBS Open Bio. 2020 Jun.

Abstract

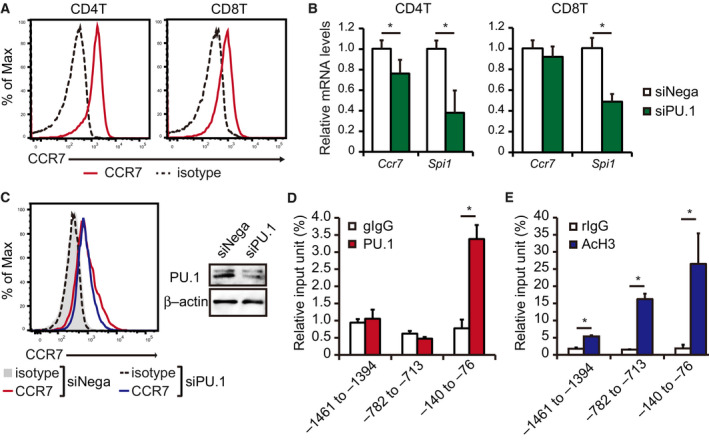
C-C chemokine receptor type 7 (CCR7) is expressed on naïve T cells, B cells, and activated dendritic cells (DCs). We previously demonstrated that the transcription factor PU.1/Spi1 positively regulates the expression of CCR7 in DCs. In the present study, we investigated the role of PU.1 in CCR7 expression in T cells. To confirm whether PU.1 is involved in the expression of CCR7, we conducted a ChIP assay in various T cells purified from splenocytes and thymocytes and found that PU.1 binds to the Ccr7 promoter-proximal region in spleen naïve CD4+ T cells, but not in thymocytes. Small interfering RNA-mediated PU.1 knockdown resulted in decreased CCR7 expression in spleen naïve CD4+ T cells. Compared to naïve CD4+ T cells, Spi1 and Ccr7 mRNA levels decreased in Th1 and Th2 cells, in which PU.1 did not bind to the Ccr7 promoter, suggesting that CCR7 expression decreases due to the dissociation of PU.1 from the Ccr7 promoter during the development of effector T cells from naïve T cells. Collectively, we concluded that CCR7 expression level correlates with the binding level of PU.1 to the Ccr7 promoter and PU.1 acts as a transcriptional activator of the Ccr7 gene in naïve CD4+ T cells.

Keywords: CCR7; Naïve CD4 T cells; PU.1.


Conflict of interest statement

The authors declare no conflict of interest.

Figures

Fig. 1
Fig. 1
PU.1 is not involved in Ccr7 gene expression during thymocyte development. (A) Thymocytes were stained with CD4‐FITC, CD8‐PECy5, and CCR7‐PE and analyzed by flow cytometry. Gates were placed around CD4CD8 (DN), CD4+CD8+ (DP), CD4+CD8 (CD4SP), and CD4CD8+ (CD8SP) cells. Representative histograms are shown. Similar results were obtained in three independent experiments. (B, C) Thymocytes were stained with CD4‐FITC and CD8‐PECy5, and sorted. ChIP assay was performed using either (B) goat IgG (gIgG) or anti‐PU.1 antibody (PU.1) or (C) rabbit IgG (rIgG) or anti‐acetyl histone H3 antibody (AcH3). The immunoprecipitated chromatin amount was determined by qPCR amplification of the indicated Ccr7 promoter region. Data are expressed as a percentage of input for each ChIP assay. Results are presented as the mean + SD (DP and CD4SP; n = 5, CD8SP; n = 3). *P < 0.05, two‐tailed Student’s t‐test analysis.
Fig. 2
Fig. 2
PU.1 is involved in Ccr7 gene expression in naïve CD4+T cells from the spleen. (A) Representative histograms of CCR7 expression in CD4+ and CD8+ T cells from the spleen. Similar results were obtained in three independent experiments. (B, C) Naïve CD4+ or CD8+ T cells were cultured with plate‐bound anti‐CD3ε and anti‐CD28 antibodies. After 24 h of incubation, the cells were introduced with either negative control (siNega) or PU.1 (siPU.1) siRNA. (B) Relative mRNA levels were determined by quantitative RT–PCR and normalized to GAPDH mRNA levels. (C) Fixed and permeabilized CD4+ T cells were stained with CCR7‐PE and analyzed by flow cytometry. Representative histograms are shown. Similar results were obtained in two independent experiments. Protein levels of PU.1 and β‐actin were determined by western blotting. (D, E) ChIP assays were performed with naïve CD4+ T cells isolated from the spleen using either (D) gIgG or PU.1 or (E) rIgG or AcH3. The immunoprecipitated chromatin amount was determined by qPCR amplification of the indicated region of the Ccr7 promoter. Data are expressed as a percentage of input for each ChIP assay. (B, D, E) Results are presented as the mean + SD (n = 3). *P < 0.05, two‐tailed Student’s t‐test analysis.
Fig. 3
Fig. 3
Relationship between CCR7 expression and PU.1–Ccr7 promoter binding in helper T cells. (A–C) Naïve CD4+ T cells were cultured under Th1‐ or Th2‐polarizing conditions for 7 days. (A) Cells were stained with CCR7‐PE and analyzed by flow cytometry. Representative histograms are shown. Similar results were obtained in three independent experiments. (B) Relative mRNA levels were determined by quantitative RT–PCR after being normalized to GAPDH mRNA level. Data are expressed as a ratio to the mRNA expression levels in naïve T cells. (C) ChIP assay was performed using either gIgG or PU.1. The amount of immunoprecipitated chromatin was determined by qPCR amplification of the indicated Ccr7 promoter region. Data are expressed as a percentage of input for each ChIP assay. (B, C) Results are presented as the mean + SD (n = 3). (B) *P < 0.05, Tukey–Kramer test. (C) *P < 0.05, two‐tailed Student’s t‐test analysis.

References

    1. Forster R, Davalos‐Misslitz AC and Rot A (2008) CCR7 and its ligands: balancing immunity and tolerance. Nat Rev Immunol 8, 362–371. - PubMed
    1. Nitta T, Murata S, Ueno T, Tanaka K and Takahama Y (2008) Thymic microenvironments for T‐cell repertoire formation. Adv Immunol 99, 59–94. - PubMed
    1. von Andrian UH and Mempel TR (2003) Homing and cellular traffic in lymph nodes. Nat Rev Immunol 3, 867–878. - PubMed
    1. Takada K and Jameson SC (2009) Naive T cell homeostasis: from awareness of space to a sense of place. Nat Rev Immunol 9, 823–832. - PubMed
    1. Randolph GJ, Angeli V and Swartz MA (2005) Dendritic‐cell trafficking to lymph nodes through lymphatic vessels. Nat Rev Immunol 5, 617–628. - PubMed

Publication types