. 2020 Jun 30;30(8):4496-4514.
doi: 10.1093/cercor/bhaa049.

Mapping Short Association Fibers in the Early Cortical Visual Processing Stream Using In Vivo Diffusion Tractography

Affiliations

Mapping Short Association Fibers in the Early Cortical Visual Processing Stream Using In Vivo Diffusion Tractography

Fakhereh Movahedian Attar et al. Cereb Cortex. .

Abstract

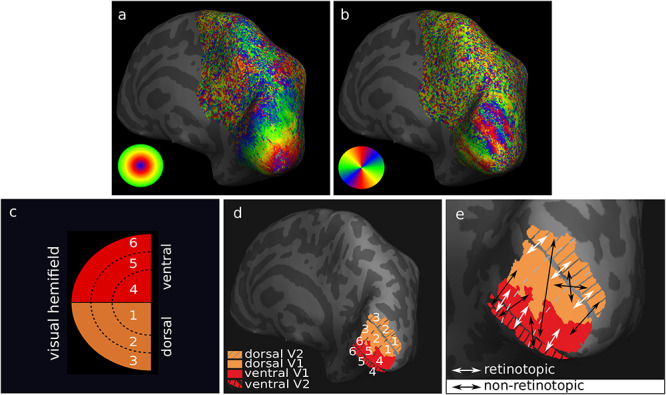
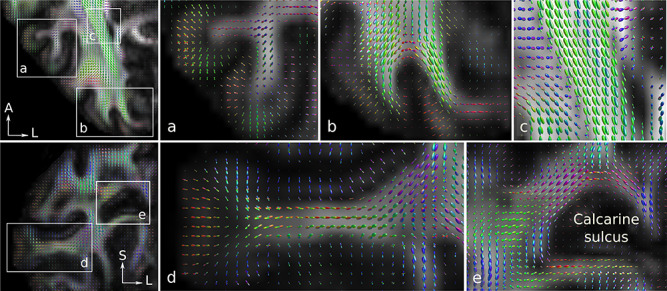
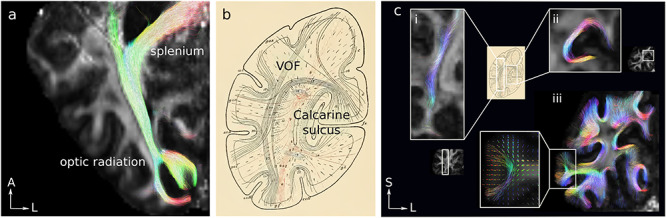
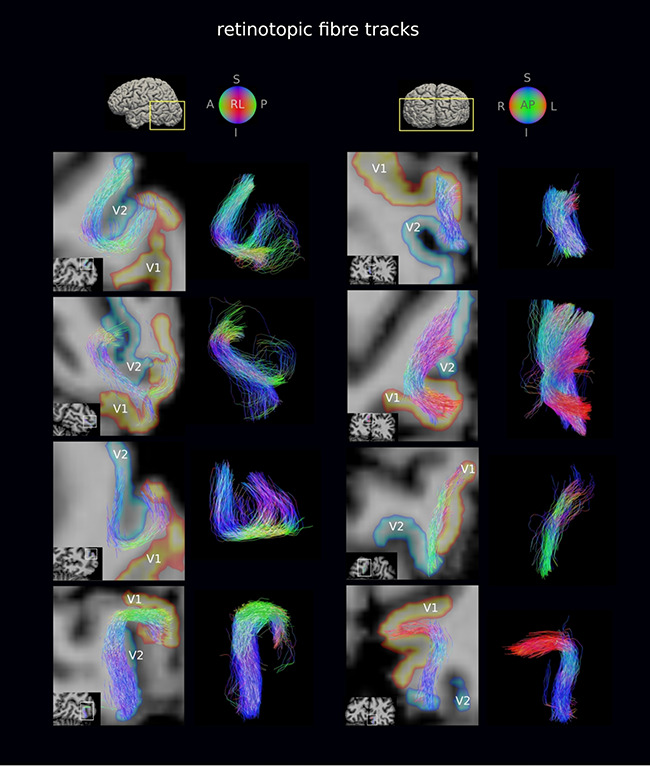
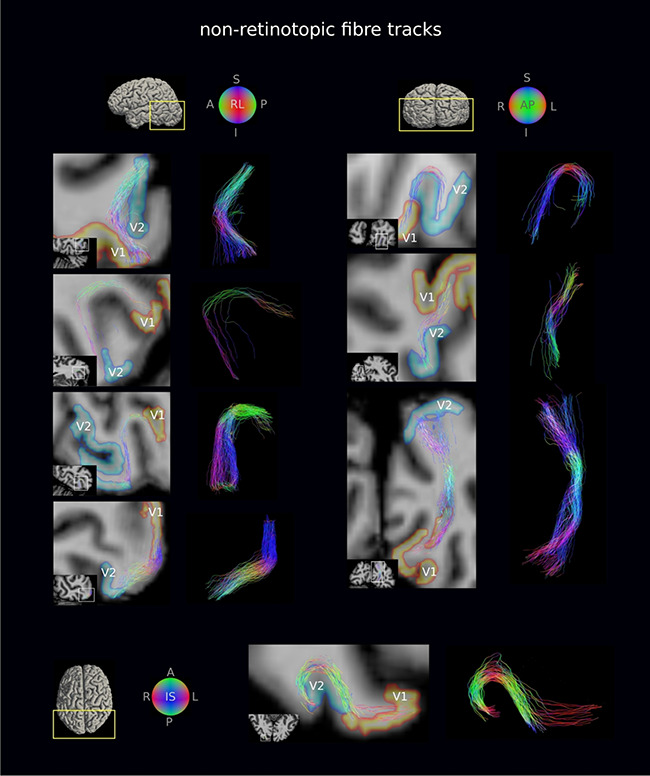
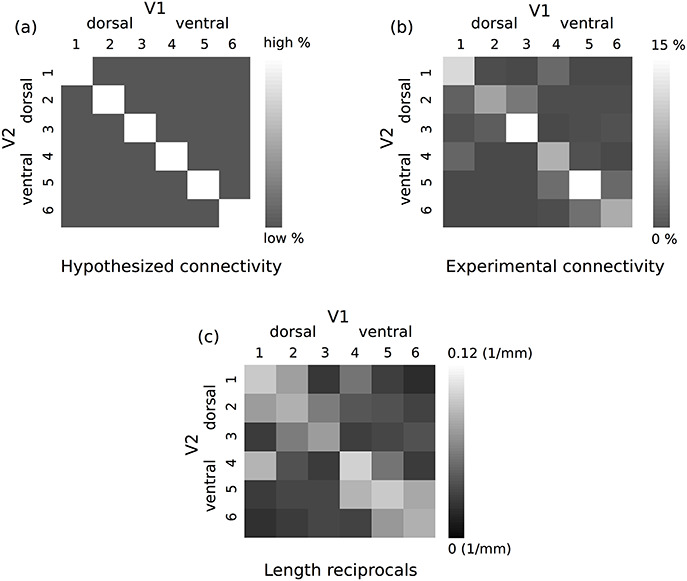
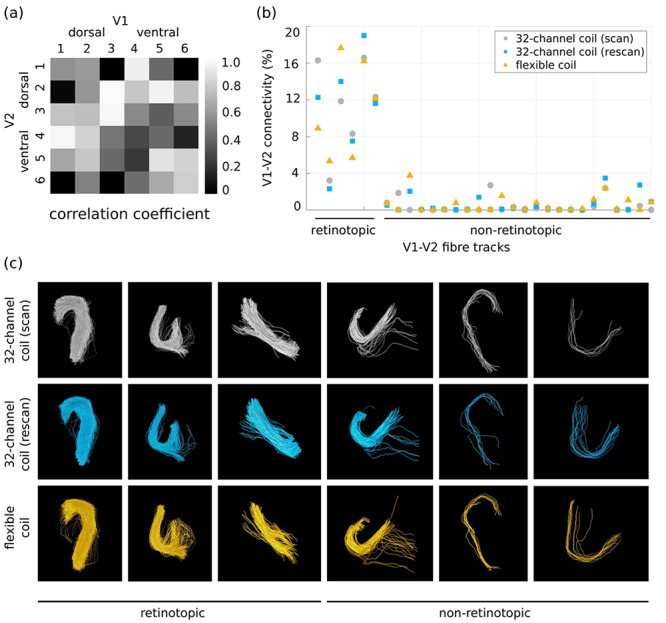
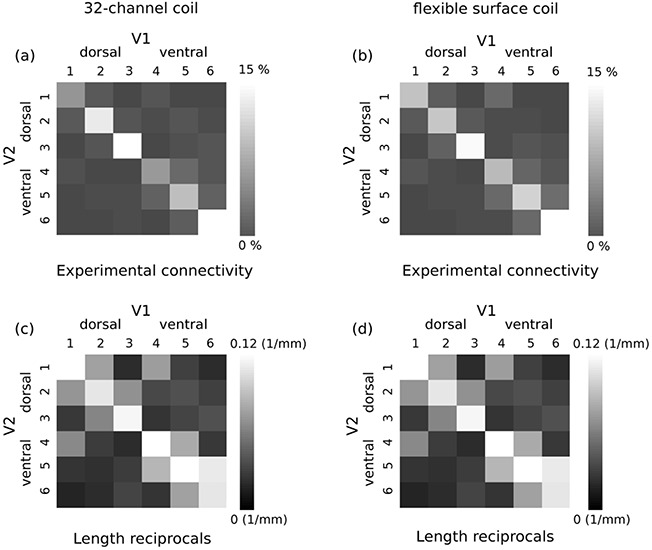
Short association fibers (U-fibers) connect proximal cortical areas and constitute the majority of white matter connections in the human brain. U-fibers play an important role in brain development, function, and pathology but are underrepresented in current descriptions of the human brain connectome, primarily due to methodological challenges in diffusion magnetic resonance imaging (dMRI) of these fibers. High spatial resolution and dedicated fiber and tractography models are required to reliably map the U-fibers. Moreover, limited quantitative knowledge of their geometry and distribution makes validation of U-fiber tractography challenging. Submillimeter resolution diffusion MRI-facilitated by a cutting-edge MRI scanner with 300 mT/m maximum gradient amplitude-was used to map U-fiber connectivity between primary and secondary visual cortical areas (V1 and V2, respectively) in vivo. V1 and V2 retinotopic maps were obtained using functional MRI at 7T. The mapped V1-V2 connectivity was retinotopically organized, demonstrating higher connectivity for retinotopically corresponding areas in V1 and V2 as expected. The results were highly reproducible, as demonstrated by repeated measurements in the same participants and by an independent replication group study. This study demonstrates a robust U-fiber connectivity mapping in vivo and is an important step toward construction of a more complete human brain connectome.

Keywords: U-fibers; retinotopy; subcortical; submillimeter resolution; superficial white matter.


Figures

Figure 1
Figure 1
Retinotopic segmentation of V1 and V2 cortical borders was enabled by functional MRI retinotopy. Images are shown on the inflated surface of the right hemisphere for one participant and cortical curvature is shown with dark (sulci) and light (gyri) gray. (a) Eccentricity and (b) polar angle maps were obtained, and (c) schematic projections of the six subdivisions of V1 and V2 visual hemifields were represented by the corresponding (d) six retinotopically segmented V1 and V2 areas. (e) Connectivity between the six V1 and V2 segments was defined as retinotopic (white arrows) for retinotopically corresponding connectivity and non-retinotopic (black arrows) for non-retinotopic connectivity on the inflated cortical surface.
Figure 2
Figure 2
Robust fODF estimates were enabled using submillimeter resolution DWI and MSMT-CSD. The flexible surface coil fODF estimates are shown for a representative participant and are superimposed on the DWI-derived fractional anisotropy map. A, S, and L: anterior, superior, and left, respectively. In a selected axial slice, (a) intracortical radial fibers running perpendicular to the cortical GM boundary in the gyri and along the walls of the sulci were detected (see Supplementary Video 1). (b) U-fibers running parallel to the cortical GM boundary are shown in a sulcus in the early visual cortex. U-fibers form crossing regions with long-range fibers (Reveley et al. 2015) and obscure their penetration into the cortical GM using submillimeter spatial resolution DWI techniques (see Supplementary Video 2). (c) Optic radiation and the posterior tail of the splenium of the corpus callosum tracts were detected to run predominantly anterior–posterior with few or no secondary peaks as expected (see Supplementary Video 1). In a selected coronal slice, (d) intracortical radial fibers running perpendicular to the cortical GM boundary in the gyrus and along the wall of the sulcus were reconstructed (see Supplementary Video 3). (e) Fibers near the calcarine sulcus were detected to run predominantly parallel to the cortical GM boundary (see Supplementary Video 4).
Figure 3
Figure 3
Delineation of known fiber pathways using submillimeter resolution MSMT-CSD probabilistic tractography demonstrated for the flexible surface coil DWI of one representative participant, superimposed on the DWI-derived fractional anisotropy map. (a) Fiber tracks corresponding to the optic radiation and the posterior tail of the splenium of the corpus callosum tracts. (b) The short fiber connections of the occipital lobe were mapped using histology by Sachs (reproduced from Sachs 1892). Fiber tracks corresponding to (c-i) the VOF and (c-ii) fibers connecting the upper and lower banks of the calcarine sulcus. (c-iii) The short U-shaped fiber tracks mapped by user-defined streamline length and curvature thresholds (see Supplementary Video 5 for a map of the short connections obtained from a 32-channel coil DWI acquisition). U-shaped streamlines penetrated the cortical GM at the gyri. U-shaped streamlines connecting directly adjacent gyral GM are shown in the inset of c-iii. The underlying fODF distribution shows intracortical radial fibers. A, S, and L: anterior, superior, and left, respectively.
Figure 4
Figure 4
Retinotopic V1–V2 fiber tracks were generally short (16 mm mean length) and followed the pattern of cortical folding. A representative subset of retinotopic V1–V2 fiber tracks are shown for the flexible surface coil DWI of a representative participant. Fiber tracks are shown on oblique slices and are superimposed on the T1w image transformed to DWI space. The volumetric V1 and V2 retinotopic segments transformed to the DWI space are also shown. The detected retinotopic fiber tracks followed the pattern of cortical folding, but not all were strictly U-shaped. A, L, R, I, S, P: anterior, left, right, inferior, superior, posterior.
Figure 5
Figure 5
Non-retinotopic V1–V2 fiber tracks were less abundant and on average longer (32 mm mean length) than retinotopic fiber tracks (cf. Fig. 4). A representative subset of non-retinotopic V1–V2 fiber tracks are shown for the flexible surface coil DWI of a representative participant. Fiber tracks are shown on oblique slices and are superimposed on the T1w image transformed to DWI space. The volumetric V1 and V2 retinotopic segments transformed to the DWI space are also shown. The detected non-retinotopic fiber tracks followed the pattern of cortical folding in many cases, but not all were strictly U-shaped. A, L, R, I, S, P: anterior, left, right, inferior, superior, posterior.
Figure 6
Figure 6
Consistent connectivity patterns were observed between V1 and V2 (see Fig. 1 for the definition of retinotopic segments). (a) Hypothesized connectivity matrix with higher expected retinotopic V1–V2 connectivity. The retinotopic and non-retinotopic connections are shown with on- and off-diagonal elements of the connectivity matrix, respectively. (b) Group-average V1–V2 connectivity matrix computed across six hemispheres (i.e., three subjects). On average higher connectivity was detected for the V1 and V2 retinotopic segments. (c) Corresponding group-average proximity matrix computed based on the reciprocals of the streamline lengths across all subjects and all acquisitions. Retinotopic connectivity showed, on average, higher proximity.
Figure 7
Figure 7
The mapped V1–V2 connectivity is reproducible across scans (scan–rescan) with the 32-channel and the flexible surface coils. (a) ICC matrix computed between the mean of the scan–rescan 32-channel coil connectivity and the flexible surface coil connectivity across six hemispheres shows mostly high correlation. (b) Percentage connectivity for all detected retinotopic and non-retinotopic fiber tracks using the 32-channel and flexible surface coils averaged over all subjects supports high reproducibility for the three experiments. (c) Corresponding fiber track geometries show high reproducibility across the scan–rescan and the flexible surface coil experiments as demonstrated for a representative subset of V1–V2 fiber tracks.
Figure 8
Figure 8
Consistent connectivity patterns between V1 and V2 were reproduced in Experiment 2 on the larger group of 14 participants (see Fig. 1 for the definition of retinotopic segments and Fig. 6a for hypothesized connectivity pattern and definition of retinotopic and non-retinotopic connections in the connectivity matrix). (a) Group-average V1–V2 connectivity matrix computed across 28 hemispheres (i.e., 14 subjects) for the 32-channel coil scans. (b) Group-average V1–V2 connectivity matrix computed across 26 hemispheres (i.e., 13 subjects) for the flexible surface coil scans. On average higher connectivity was detected for the V1 and V2 retinotopic segments for both 32-channel and flexible surface coil DWI. (c,d) Corresponding group-average proximity matrices computed based on the reciprocals of the streamline lengths across all hemispheres. Retinotopic connectivity showed, on average, higher proximity.

References

    1. Aggarwal M, Nauen DW, Tronocoso JC, Mori S. 2015. Probing region-specific microstructure of human cortical areas using high angular and spatial resolution diffusion MRI. NeuroImage. 105:198–207. - PMC - PubMed
    1. Alexander AL, Hasan KM, Lazar M, Tsuruda JS, Parker DL. 2001. Analysis of partial volume effects in diffusion-tensor MRI. Magn Reson Med. 45:770–780. - PubMed
    1. Andersson JLR, Skare S, Ashburner J. 2003. How to correct susceptibility distortions in spin-echo echo-planar images: application to diffusion tensor imaging. NeuroImage. 20:870–888. - PubMed
    1. Andersson JLR, Sotiropoulos SN. 2016. An integrated approach to correction for off-resonance effects and subject movement in diffusion MR imaging. NeuroImage. 125:1063–1078. - PMC - PubMed
    1. Andersson JLR, Graham MS, Zsoldos E, Sotiropoulos SN. 2016. Incorporating outlier detection and replacement into a non-parametric framework for movement and distortion correction of diffusion MR images. NeuroImage. 141:556–572. - PubMed

Publication types