. 2020 Jun;34(6):7885-7904.
doi: 10.1096/fj.201902815R. Epub 2020 Apr 16.

Small proline-rich repeat 3 is a novel coordinator of PDGFRβ and integrin β1 crosstalk to augment proliferation and matrix synthesis by cardiac fibroblasts

Affiliations

Small proline-rich repeat 3 is a novel coordinator of PDGFRβ and integrin β1 crosstalk to augment proliferation and matrix synthesis by cardiac fibroblasts

Sarika Saraswati et al. FASEB J. 2020 Jun.

Abstract

Nearly 6 million Americans suffer from heart failure. Increased fibrosis contributes to functional decline of the heart that leads to heart failure. Previously, we identified a mechanosensitive protein, small proline-rich repeat 3 (SPRR3), in vascular smooth muscle cells of atheromas. In this study, we demonstrate SPRR3 expression in cardiac fibroblasts which is induced in activated fibroblasts following pressure-induced heart failure. Sprr3 deletion in mice showed preserved cardiac function and reduced interstitial fibrosis in vivo and reduced fibroblast proliferation and collagen expression in vitro. SPRR3 loss resulted in reduced activation of Akt, FAK, ERK, and p38 signaling pathways, which are coordinately regulated by integrins and growth factors. SPRR3 deletion did not impede integrin-associated functions including cell adhesion, migration, or contraction. SPRR3 loss resulted in reduced activation of PDGFRβ in fibroblasts. This was not due to the reduced PDGFRβ expression levels or decreased binding of the PDGF ligand to PDGFRβ. SPRR3 facilitated the association of integrin β1 with PDGFRβ and subsequently fibroblast proliferation, suggesting a role in PDGFRβ-Integrin synergy. We postulate that SPRR3 may function as a conduit for the coordinated activation of PDGFRβ by integrin β1, leading to augmentation of fibroblast proliferation and matrix synthesis downstream of biomechanical and growth factor signals.

Keywords: collagen; fibrosis; heart failure; pressure overload; transverse aortic constriction.


Conflict of interest statement

The authors declare no conflict of interest.

Figures

FIGURE 1
FIGURE 1
SPRR3 protein and transcripts are expressed only in fibroblasts in murine heart. A, Tissue extracts from mouse organs were probed with anti‐SPRR3 antibody by western blot and showed detectable levels only in the heart. β‐actin served as a loading control. B, Tissue extracts from human, mouse, and rat heart were assayed by western blot for SPRR3 and all showed presence of protein. Esophagus served as a positive control. C, cDNA from cardiomyocytes and cardiac fibroblasts isolated from wild‐type mice were analyzed by RT‐PCR for the presence of Sprr3 and appropriate markers (cTnT for cardiomyocytes; Fsp1 and Col1a1 for fibroblasts). Sprr3 transcript expression was only detected in the fibroblast population. A 18S served as a loading control. D, Hearts were isolated from wild‐type mice that received either sham or TAC surgery and were assayed for Sprr3 transcript levels by RT‐PCR and normalized to 18S. Statistical analysis was performed by t test, where *P < .05, n = 4. For data presented as box‐and‐whiskers plots, horizontal lines indicate the medians, cross marks indicate the means, boxes indicate the 25th to 75th percentiles, and whiskers indicate the minimum and maximum values of the data set
FIGURE 2
FIGURE 2
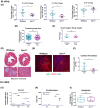
Sprr3 loss preserved cardiac function from TAC and induced fibrosis by decreased fibroblast proliferation and collagen synthesis. A, Male wild‐type (n = 14) and Sprr3 −/− (n = 8) mice received TAC surgery at 3 months of age. Echocardiography analysis was performed at day 7 and day 60 after TAC. Data for left ventricular internal diameter end diastole (LVIDd), left ventricular internal diameter end systole (LVIDs) and ejection fraction (EF) were plotted as percentage difference between 7 and 60 days after TAC to reflect that presence of Sprr3 led to worsening cardiac function. Statistical analysis was performed by Mann‐Whitney test where *P < .05, **P < .01. For wild‐type samples, n = 14, for Sprr3 −/− samples, n = 8. B, Cardiomyocyte size was unchanged between genotypes. For wild‐type n = 100; for Sprr3 −/− n = 58. C, Heart weight vs body weight was quantified 60 days after TAC, n = 9. B and C, Statistical analysis was performed by two‐tailed t test where ns = > .05. D, Masson's trichrome staining of hearts from wild‐type and Sprr3 −/− mice was performed 60 days after TAC. Fibrotic area is indicated in blue by arrows, where wild‐type hearts exhibit more fibrosis. Scale bars represent 100 µm. E, Confocal microscopy of immunofluorescent staining of heart tissue 60 days after TAC for anti‐αSMA (green) and anti‐periostin (red) was performed to identify fibroblasts. Scale bars represent 40 µm. F, Quantification of periostin positive cells per field indicates that wild‐type hearts contain more activated fibroblasts. Statistical analysis was performed by t test where *P < .05, wild‐type n = 10, Sprr3 −/− n = 6. G, Levels of Col1a1 were analyzed in cardiac fibroblasts (P1‐P3) from wild‐type and Sprr3 −/− mice 60 days post sham or TAC surgery. Collagen transcripts were significantly elevated in both genotypes after TAC, but at a lower level in Sprr3 −/− fibroblasts compared to wild‐type. Statistical analysis was performed by one‐way ANOVA with Bonferroni multiple comparisons analysis where *P < .05, **P < .01, ***P < .001, n = 3. H, Proliferation was measured using a DNA quantification kit after plating (0 hrs) or after 48 hours. Proliferation was lower in Sprr3 −/− fibroblasts ((P1‐P3), indicating that the reduced fibroblast numbers in vivo may be due to decreased proliferation rather than differing apoptosis levels. Statistical analysis was performed by t test only at 48 hours where *P < .05, n = 3. At 0 hours the same number of cells were plated, thus, no statistical test was performed. I, Apoptosis was analyzed by TUNEL staining (P1‐P3). Statistical analysis was performed by t test where P > .05 (ns, not significant), n = 5. For data presented as box‐and‐whiskers plots, horizontal lines indicate the medians, cross marks indicate the means, boxes indicate the 25th to 75th percentiles, and whiskers indicate the minimum and maximum values of the data set
FIGURE 3
FIGURE 3
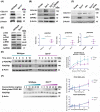
Sprr3 upregulates collagen expression through the PI3K/Akt pathway and modulates PDGFRβ activation and downstream signaling. A, Mouse embryonic fibroblasts (MEFs; P1‐P5) were analyzed by western blot for p‐Akt, total Akt and type I collagen. Both collagen and activated Akt levels were reduced in Sprr3 −/− cardiac fibroblasts. β‐actin served as a loading control. B, Sprr3 −/− MEFs were transfected with empty vector or vector expressing Sprr3. After 24 hours of transfection, cells were treated with or without PI3K inhibitor (Ly294002) for 24 hours. Cell lysates were probed for type I collagen, p‐AKT, and SPRR3 by immunoblot. Sprr3 expression could increase both activated AKT and collagen levels, but after AKT inhibition, levels of activated AKT and collagen were reduced to baseline. β‐actin served as a loading control. C, Sprr3 −/− MEFs were transfected with empty vector or vector expressing Sprr3, Akt or dominant negative Akt (dnAkt). Protein was isolated 72 hours after transfection and probed for type I collagen and SPRR3. Collagen levels could be increased with either Sprr3 or Akt expression alone but were not increased in cells expressing both Sprr3 and dnAkt. β‐actin served as a loading control. D, MEFs were serum starved for 4 hours and lysates were probed for p‐Akt, total Akt, p‐ERK, total ERK, p‐FAK, and total FAK by western analysis. Activated AKT and FAK were all reduced in Sprr3 −/− fibroblasts. GAPDH served as a loading control. Relative ratio of phosphorylated to total protein normalized to GAPDH is shown. Data were analyzed using a t test where *P < .05, **P < .01, n = 3‐4. E, MEFs were serum starved and treated with recombinant PDGFBB at 2‐minute intervals. Cell lysates were probed with p‐PDGFRβ and total PDGFRβ by western blot and normalized to β‐actin. Densitometry analysis of three independent experiments shows phosphorylated/total receptor levels normalized to β‐actin. Sprr3−/− fibroblasts were unable to activate PDGRB at similar levels to wild‐type cells after 6 minutes of stimulation with PDGF. Data were analyzed using a 2‐way ANOVA with repeated measures with a Sidak multiple comparisons test, where *P < .05, **P < .01, ***P < .001, n = 3. F, MEFs were serum starved then treated with biotinylated PDGFBB for 2 minutes at the indicated concentrations. Cell lysates were analyzed by western blot with antibodies against biotin or PDGRB. β‐Actin served as a loading control. PDGFBB binding was unchanged between wild‐type and Sprr3 −/− fibroblasts when normalized to either β‐Actin or PDGFRβ levels. Statistical analysis was performed using a 2‐way ANOVA with a Sidak multiple comparisons test, where P > .05, n = 3
FIGURE 4
FIGURE 4
Integrin β1 levels, activation and mediated cell activity are not modulated by Sprr3, but downstream signaling activation is impaired in Sprr3 −/− fibroblasts. A, Flow cytometry analysis of integrin β1 (total and active conformation) in wild‐type and Sprr3 −/− MEFs (P1) show no differences in percentage of cell expression or mean fluorescence intensity (MFI). Statistical analysis was performed by 2‐way ANOVA with Sidak multiple comparisons test, ns P > .05, n = 3. B, MEFs (P1‐P5) were serum starved and plated within a collagen gel and allowed to contract the gel over 72 hours. Data are presented in percentage of total area, where no differences were observed between genotypes. Statistical analysis was performed by 2‐way ANOVA with repeated measures and a Sidak multiple comparisons test, P > .05, n = 12. C, MEFs (P1‐P5) were serum starved then plated in transwells to perform a Boyden's chamber assay. Membranes were coated with BSA (negative control) or fibronectin. FBS or PDGF was placed in media in the bottom well as a stimulus. No differences were detected in any condition. Statistical analysis was performed by t test where ns P > .05, n = 6. D, MEFs (P1‐P5) were serum starved then plated on 10 µg/mL or 0 µg/mL (negative control) fibronectin (FN) at 15‐minute intervals to determine cell adhesion. Crystal violet stained cells were quantified by absorbance, and no differences were noted between genotypes. Statistical analysis was performed by 2‐way ANOVA with Sidak multiple comparisons test, ns P > .05, n = 3. E, MEFs (P1‐P5) were serum starved, then, plated on 1 µg/mL fibronectin coated plates at 15‐minute intervals in serum‐free media. Lysates were analyzed by western blot for phosphorylated and total Akt, FAK and p38, then, normalized to GAPDH loading control. Densitometry analysis of normalized ratios is presented in the graphs. Densitometry over time is n = 1 for all timepoints. Differences between 0 and 15 minutes were performed by t test where *P < .05, **P < .01, n = 3‐7
FIGURE 5
FIGURE 5
SPRR3 interacts with PDGFRβ and integrin β1 and facilitates their interaction. A, Sprr3 −/− MEFs (P1‐P5) overexpressing either GFP or SPRR3 were used for immunoprecipitation (IP) of PDGFRβ, integrin β1 and SPRR3. Western blot analysis of the input cell lysates and IP eluate are shown. IP of PDGRβ was able to pull down integrin β1 only in the presence of SPRR3, as well as SPRR3 itself. Conversely, IP of integrin β1 was only able to pull‐down PDGFRβ in the presence of SPRR3, as well as SPRR3. SPRR3 pull‐down identified both integrin β1 and PDGFRβ in cells positive for SPRR3 (not GFP knockout cells). Negative isotype controls did not display any of the proteins after pull‐down. B, In situ proximity ligation of Integrin β1 and PDGFRβ showed enhanced receptor pairs in wild‐type MEFs compared to Sprr3 −/− MEFs (indicated by red). Secondary probes showed minimal staining. Scale bars represent 20 µm. Average interactions per cell (indicated by DAPI stain) per field were quantified. Statistical analysis was performed by t test where ***P < .001, n = 4‐7. C, WT and Sprr3 −/− MEFs (P1‐P5) were serum starved, then, plated on 1 µg/mL fibronectin coated plates in serum‐free media for 24 hours. Cells were treated with/without 10 µg/mL Integrin β1 antibody for 1 hour at 37°C prior to stimulation with PDGF. BrdU labeling was done for 18 hours and BrdU proliferation assay was performed as per manufacturer's instructions (Millipore). Statistical analysis was performed using a 2‐way ANOVA, where P < .05, n = 3
FIGURE 6
FIGURE 6
A model depicting the function of SPRR3 in modulating growth factor mediated signaling to promote collagen production. SPRR3 facilitates the coordinated activation of Integrin β1 and PDGFRβ to activate shared signaling pathways such as ERK, FAK, and AKT pathways. This harmonized augmentation of growth factor mediated signals with mechano‐signals mediated by integrin β1 promotes fibroblast proliferation and the synthesis of collagen in fibroblasts. Model figure is adapted from Veevers‐Lowe et al 70

Similar articles

Cited by

References

    1. Valiente‐Alandi I, Potter SJ, Salvador AM, et al. Inhibiting fibronectin attenuates fibrosis and improves cardiac function in a model of heart failure. Circulation. 2018;138:1236–1252. - PMC - PubMed
    1. Camelliti P, Borg TK, Kohl P. Structural and functional characterisation of cardiac fibroblasts. Cardiovasc Res. 2005;65:40‐51. - PubMed
    1. Travers JG, Kamal FA, Robbins J, Yutzey KE, Blaxall BC. Cardiac fibrosis: The fibroblast awakens. Circ Res. 2016;118:1021‐1040. - PMC - PubMed
    1. Souders CA, Bowers SL, Baudino TA. Cardiac fibroblast: The renaissance cell. Circ Res. 2009;105:1164‐1176. - PMC - PubMed
    1. Souders CA, Borg TK, Banerjee I, Baudino TA. Pressure overload induces early morphological changes in the heart. Am J Pathol. 2012;181:1226‐1235. - PMC - PubMed

Publication types

MeSH terms

Substances

LinkOut - more resources