. 2020 Apr 16;21(Suppl 2):219.
doi: 10.1186/s12864-020-6608-y.

Integrated likelihood for phylogenomics under a no-common-mechanism model

Affiliations

Integrated likelihood for phylogenomics under a no-common-mechanism model

Hunter Tidwell et al. BMC Genomics. .

Abstract

Background: Multi-locus species phylogeny inference is based on models of sequence evolution on gene trees as well as models of gene tree evolution within the branches of species phylogenies. Almost all statistical methods for this inference task assume a common mechanism across all loci as captured by a single value of each branch length of the species phylogeny.

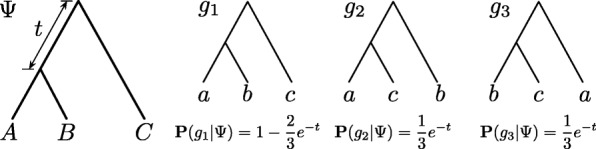
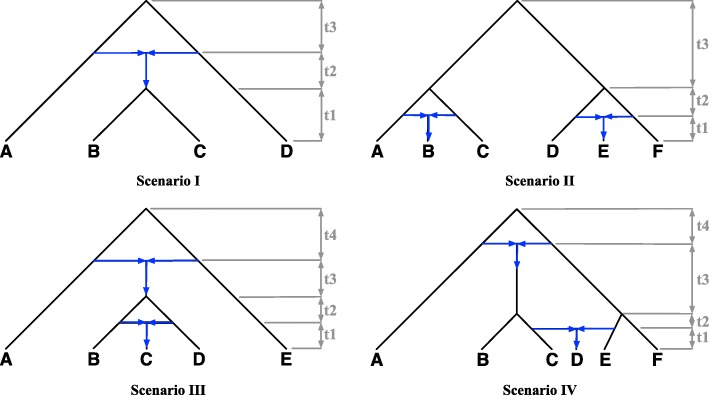
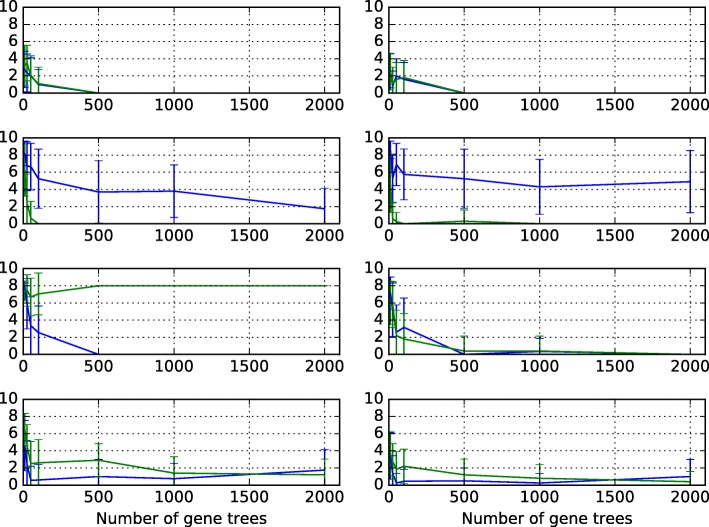
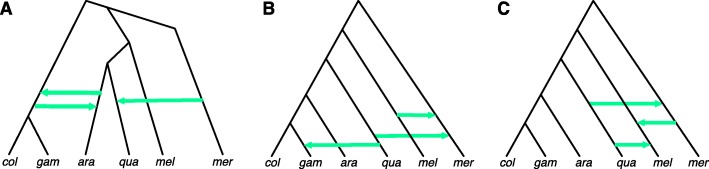
Results: In this paper, we pursue a "no common mechanism" (NCM) model, where every gene tree evolves according to its own parameters of the species phylogeny. Based on this model, we derive an analytically integrated likelihood of both species trees and networks given the gene trees of multiple loci under an NCM model. We demonstrate the performance of inference under this integrated likelihood on both simulated and biological data.

Conclusions: The model presented here will afford opportunities for exploring connections among various criteria for estimating species phylogenies from multiple, independent loci. Furthermore, further development of this model could potentially result in more efficient methods for searching the space of species phylogenies by focusing solely on the topology of the phylogeny.

Keywords: Integrated likelihood; Multispecies coalescent; No common mechanism; Phylogenomics.


Conflict of interest statement

The authors declare that they have no competing interests.

Figures

Fig. 1
Fig. 1
The multispecies coalescent (MSC) model. The species tree Ψ defines a probability distribution on gene tree topologies, as shown for the three gene trees on three taxa, where t is the branch length in coalescent units
Fig. 2
Fig. 2
Model phylogenetic networks. Blue arrows indicated directions into and out of the reticulation nodes
Fig. 3
Fig. 3
Accuracy of network inference on data simulated under a common mechanism. The symmetric network difference between the inferred and model network, averaged over 100 trials, using the MDC criterion as implemented in [18] (green) and the maximum integrated likelihood under the NCM model (blue). Rows from top to bottom correspond to Scenarios I-IV, respectively, of Fig. 2. Left and right columns correspond to branch length settings 1 and 2, respectively
Fig. 4
Fig. 4
The incorrect networks inferred under the NCM model. While the correct networks were inferred for many data sets, incorrect networks were inferred in other cases, and those incorrect networks are shown in this figure. a The network inferred from the data generated on the network of Scenario I and branch length setting 2. b The network inferred from the data generated on the network of Scenario II and both branch length settings. c The network inferred from the data generated on the network of Scenario III and branch length setting 2. Red arrows indicate the reticulations whose direction was inferred in the reverse order
Fig. 5
Fig. 5
Accuracy of network inference on data simulated under NCM. The symmetric network difference between the inferred and model network, averaged over 20 trials, using the MDC criterion as implemented in [18] (green) and the maximum integrated likelihood under the NCM model (blue). Rows from top to bottom correspond to Scenarios I-IV, respectively, of Fig. 2. Left and right columns correspond to branch length settings 1 and 2, respectively
Fig. 6
Fig. 6
Networks for the mosquito data set. a The phylogenetic network reported in [26]. b The phylogenetic network analyzed using the maximum likelihood method of [5] and reported in [27]. c The phylogenetic network inferred under the NCM model
Fig. 7
Fig. 7
Different optimal species trees under the MDC criterion and NCM model. a Three gene trees assumed to have equal frequencies. b Optimal species tree under the MDC criterion (has a cost of 4 extra lineages). The other two trees each have a cost of 5 extra lineages. c and d Optimal species trees under the NCM model

References

    1. Maddison W. Gene trees in species trees. Syst Biol. 1997;46(3):523–36.
    1. Degnan JH, Rosenberg NA. Gene tree discordance, phylogenetic inference and the multispecies coalescent. Trends Ecol Evol. 2009;24(6):332–40. - PubMed
    1. Nakhleh L. Evolutionary phylogenetic networks: models and issues. In: Problem Solving Handbook in Computational Biology and Bioinformatics. Springer: 2010. p. 125–158. 10.1007/978-0-387-09760-2_7. - DOI
    1. Yu Y, Degnan JH, Nakhleh L. The probability of a gene tree topology within a phylogenetic network with applications to hybridization detection. PLoS Genet. 2012;8:1002660. - PMC - PubMed
    1. Yu Y, Dong J, Liu K, Nakhleh L. Maximum likelihood inference of reticulate evolutionary histories. Proc Natl Acad Sci. 2014;111(46):16448–53. - PMC - PubMed

LinkOut - more resources