. 2020 Jul;19(7):1120-1131.
doi: 10.1074/mcp.RA120.001983. Epub 2020 Apr 16.

Proteaphagy in Mammalian Cells Can Function Independent of ATG5/ATG7

Affiliations

Proteaphagy in Mammalian Cells Can Function Independent of ATG5/ATG7

Tatjana Goebel et al. Mol Cell Proteomics. 2020 Jul.

Abstract

The degradation of intra- and extracellular proteins is essential in all cell types and mediated by two systems, the ubiquitin-proteasome system (UPS) and the autophagy-lysosome pathway. This study investigates the changes in autophagosomal and lysosomal proteomes upon inhibition of proteasomes by bortezomib (BTZ) or MG132. We find an increased abundance of more than 50 proteins in lysosomes of cells in which the proteasome is inhibited. Among those are dihydrofolate reductase (DHFR), β-Catenin and 3-hydroxy-3-methylglutaryl-coenzym-A (HMGCoA)-reductase. Because these proteins are known to be degraded by the proteasome they seem to be compensatorily delivered to the autophagosomal pathway when the proteasome is inactivated. Surprisingly, most of the proteins which show increased amounts in the lysosomes of BTZ or MG132 treated cells are proteasomal subunits. Thus an inactivated, non-functional proteasome is delivered to the autophagic pathway. Native gel electrophoresis shows that the proteasome reaches the lysosome intact and not disassembled. Adaptor proteins, which target proteasomes to autophagy, have been described in Arabidopsis, Saccharomyces and upon starvation in mammalians. However, in cell lines deficient of these proteins or their mammalian orthologues, respectively, the transfer of proteasomes to the lysosome is not impaired. Obviously, these proteins do not play a role as autophagy adaptor proteins in mammalian cells. We can also show that chaperone-mediated autophagy (CMA) does not participate in the proteasome delivery to the lysosomes. In autophagy-related (ATG)-5 and ATG7 deficient cells the delivery of inactivated proteasomes to the autophagic pathway was only partially blocked, indicating the existence of at least two different pathways by which inactivated proteasomes can be delivered to the lysosome in mammalian cells.

Keywords: Proteases; autophagy; lysosome; proteasome; protein degradation; protein turnover; subcellular analysis.


Conflict of interest statement

The authors declare that they have no conflicts of interest with the contents of this article

Figures

None
Graphical abstract
Fig. 1.
Fig. 1.
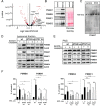
Analysis of the lysosomal proteome after proteasome inhibition. A, Experimental set-up of the study B, β-hexosaminidase enzyme assay. All fractions of the lysosome isolation procedure were subjected to N-acetyl-β-d-glucosaminide and the total enzyme activity was determined using Lambert-Beer's Law. A representative experiment is shown. FT = flow through of magnetic column. C, Chymotrypsin-like proteasome activity was determined after treatment of HEK293 cells with MG132 or Bortezomib, respectively. The fluorogenic substrate LLVY-R110 was used, n = 3, values are depicted +S.D., * = p < 0.05 as determined by student's t test. D, and E, Volcano Plots of identified proteins in dataset of BTZ- or MG132 treated versus control cells, respectively. Values were normalized to total protein amount in the respective channel. p values were determined using t test with Benjamini-Hochberg correction using Proteome Discoverer. n = 4 (D) or 5 (E). Proteins mentioned in the text and Top10 regulated proteasome subunits are marked in blue, proteins with p-values <0.05 in red, others in black.
Fig. 2.
Fig. 2.
Enrichment of proteasomal subunits in lysosome-enriched fractions. Overlap of statistically significant (p < 0.05) upregulated (A) or downregulated (C) proteins in BTZ-treated (left circle) and MG132-treated (right circle) datasets of lysosome-enriched fractions. B, Enriched KEGG pathways were analyzed for the intersection between up-regulated proteins from BTZ- and MG132-treated datasets. D–G, Western Blots and their densitometric quantification of proteasomal subunits in the lysosomal fraction and postnuclear supernatants after proteasome inhibition. D, F, MG132-treated HEK cells. E, G, BTZ-treated cells. Equal protein amounts of each fraction were separated, blotted and probed with antibodies against different proteasomal subunits and GAPDH (inputs) or cathepsin D/LAMP1 (lysosomes) as loading controls. One representative experiment out of at least 3 is shown. Densitometric quantification was performed for n = 3–8 and significance was determined by paired student's t test, * = p < 0.05. Untreated control samples were set to 1.
Fig. 3.
Fig. 3.
Immunofluorescence of MEF cells incubated with BOD-TMR-Epoxomycin. MEF cells were seeded on glass cover slips and incubated for different time periods with the fluorescent activity-based probe BOD-TMR-Epoxomycin. Afterwards cells were fixed with MeOH and stained with an antibody against LAMP2 and DAPI staining. Scale bar = 10 μm.
Fig. 4.
Fig. 4.
Analysis of macroautophagy. A, Volcano Plot of identified proteins in dataset isolated autophagosomes of BTZ-treated versus control cells. Values were normalized to LC3 protein amount in the respective channel. p values were determined using t test with Benjamini-Hochberg correction using Proteome Discoverer. Proteins mentioned in the text and Proteasome subunits are labeled. B, HEK293 cells were transiently transfected with GFP-LC3 an either treated with 25 μm MG132 or DMSO as control. Autophagosomes were isolated by GFP-Trap beads, eluates were separated, blotted and probed with antibodies against different proteasomal subunits. Ponceau staining is shown as loading control. C, Lysosome-enriched fractions were separated under native conditions, blotted and probed with an antibody against PSMA7. Three independent replicates are shown. D–E, Lysosomal and input (PNS) fractions were isolated from wt, ATG5 and ATG7 ko cells after 5h of treatment with 1 μm BTZ and 100 μm Leupeptin, equal protein amounts were loaded, separated, blotted and probed with antibodies against different proteasomal subunits and GAPDH (inputs) or cathepsin D (lysosomes) as loading controls. One representative experiment out of at least 3 is shown. F, Densitometric quantification was performed for n = 3–8 and significance was determined by paired student's t test, * = p < 0.05. Untreated wt control samples were set to 1.
Fig. 5.
Fig. 5.
Immunofluorescence of ATG5 and ATG7 KO HEK cells incubated with BOD-TMR- L3VS. HEK cells were seeded on glass cover slips and incubated for 2h time periods with the fluorescent activity-based probe BOD-TMR-L3VS. Afterward cells were fixed with MeOH and stained with an antibody against LAMP2 and DAPI staining. Scale bar = 10 μm.
Fig. 6.
Fig. 6.
Potential proteaphagy adaptor proteins. Western blotting of proteasomal subunits in the lysosomal fraction and postnuclear supernatants after proteasome inhibition of p62 (A) and TOLLIP-deficient cells (B) after BTZ treatment. Equal protein amounts of each fraction were separated, blotted and probed with antibodies against different proteasomal subunits and Actin (inputs) or cathepsin D/LAMP1 (lysosomes) as loading controls. One representative experiment out of at least 3 is shown. Immunofluorescence of wt and LAMP2-deficient MEF cells incubated with BOD-TMR- Epoxomycin. MEF cells were seeded on glass cover slips and incubated for 5h with the fluorescent activity-based probe BOD- TMR-Epoxomycin. Afterward cells were fixed with MeOH and stained with an antibody against LAMP1 and DAPI staining. Scale bar = 10 μm.

References

    1. Saftig P., and Klumperman J. (2009) Lysosome biogenesis and lysosomal membrane proteins: trafficking meets function. Nat. Rev. Mol. Cell Biol. 10, 623–635 - PubMed
    1. Tekirdag K., and Cuervo A. M. (2018) Chaperone-mediated autophagy and endosomal microautophagy: Joint by a chaperone. J. Biol. Chem. 293, 5414–5424 - PMC - PubMed
    1. Bento C. F., Renna M., Ghislat G., Puri C., Ashkenazi A., Vicinanza M., Menzies F. M., and Rubinsztein D. C. (2016) Mammalian Autophagy: How Does It Work? Annu. Rev. Biochem. 85, 685–713 - PubMed
    1. Wyant G. A., Abu-Remaileh M., Frenkel E. M., Laqtom N. N., Dharamdasani V., Lewis C. A., Chan S. H., Heinze I., Ori A., and Sabatini D. M. (2018) NUFIP1 is a ribosome receptor for starvation-induced ribophagy. Science 360, 751–758 - PMC - PubMed
    1. Mancias J. D., Wang X., Gygi S. P., Harper J. W., and Kimmelman A. C. (2014) Quantitative proteomics identifies NCOA4 as the cargo receptor mediating ferritinophagy. Nature 509, 105–109 - PMC - PubMed

Publication types

MeSH terms