

Effective diabetes complication management is a step toward a carbon-efficient planet: an economic modeling study
- PMID: 32299897
- PMCID: PMC7199151
- DOI: 10.1136/bmjdrc-2019-001017
Effective diabetes complication management is a step toward a carbon-efficient planet: an economic modeling study
Abstract
Background: The management of diabetes-related complications accounts for a large share of total carbon dioxide equivalent (CO2e) emissions. We assessed whether improving diabetes control in people with type 2 diabetes reduces CO2e emissions, compared with those with unchanging glycemic control.
Methods: Using the IQVIA Core Diabetes Model, we estimated the impact of maintaining glycated hemoglobin (HbA1c) at 7% (53 mmol/mol) or reducing it by 1% (11 mmol/mol) on total CO2e/patient and CO2e/life-year (LY). Two different cohorts were investigated: those on first-line medical therapy (cohort 1) and those on third-line therapy (cohort 2). CO2e was estimated using cost inputs converted to carbon inputs using the UK National Health Service's carbon intensity factor. The model was run over a 50-year time horizon, discounting total costs and quality adjusted life years (QALYs) up to 5% and CO2e at 0%.
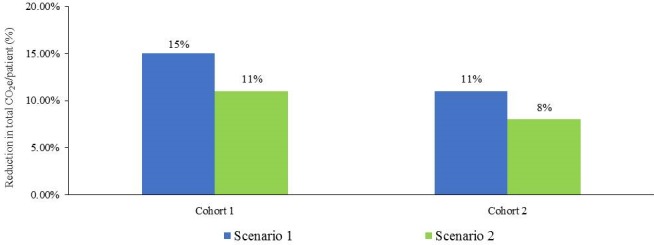
Results: Maintaining HbA1c at 7% (53 mmol/mol) reduced total CO2e/patient by 18% (1546 kgCO2e/patient) vs 13% (937 kgCO2e/patient) in cohorts 1 and 2, respectively, and led to a reduction in CO2e/LY gain of 15%-20%. Reducing HbA1c by 1% (11 mmol/mol) caused a 12% (cohort 1) and 9% (cohort 2) reduction in CO2e/patient with a CO2e/LY gain reduction of 11%-14%.
Conclusions: When comparing people with untreated diabetes, maintaining glycemic control at 7% (53 mmol/mol) on a single agent or improving HbA1c by 1% (11 mmol/mol) by the addition of more glucose-lowering treatment was associated with a reduction in carbon emissions.
Keywords: cost effectiveness; economic impact; environmental factors; type 2 diabetes.
© Author(s) (or their employer(s)) 2020. Re-use permitted under CC BY-NC. No commercial re-use. See rights and permissions. Published by BMJ.
Conflict of interest statement
Competing interests: MC, MM, and LT have received personal fees and non-financial support from Novo Nordisk, NHS Sustainable Development Unit and IQVIA. UHP is an employee of Novo Nordisk AS.
Figures


Similar articles
-
Evaluating the burden of poor glycemic control associated with therapeutic inertia in patients with type 2 diabetes in the UK.J Med Econ. 2020 Jan;23(1):98-105. doi: 10.1080/13696998.2019.1645018. Epub 2019 Aug 2. J Med Econ. 2020. PMID: 31311364
-
Improving management of glycaemic control in people with T2DM in primary care: estimation of the impact on the clinical complications and associated costs.BMC Health Serv Res. 2020 Aug 26;20(1):803. doi: 10.1186/s12913-020-05360-w. BMC Health Serv Res. 2020. PMID: 32847581 Free PMC article.
-
Evaluation of the Clinical and Economic Burden of Poor Glycemic Control Associated with Therapeutic Inertia in Patients with Type 2 Diabetes in the United States.Adv Ther. 2020 Feb;37(2):869-882. doi: 10.1007/s12325-019-01199-8. Epub 2020 Jan 10. Adv Ther. 2020. PMID: 31925649 Free PMC article.
-
Repaglinide : a pharmacoeconomic review of its use in type 2 diabetes mellitus.Pharmacoeconomics. 2004;22(6):389-411. doi: 10.2165/00019053-200422060-00005. Pharmacoeconomics. 2004. PMID: 15099124 Review.
-
Psychological interventions to improve self-management of type 1 and type 2 diabetes: a systematic review.Health Technol Assess. 2020 Jun;24(28):1-232. doi: 10.3310/hta24280. Health Technol Assess. 2020. PMID: 32568666 Free PMC article.
Cited by
-
Environmental Sustainability in Respiratory Care: An Overview of the healthCARe-Based envirONmental Cost of Treatment (CARBON) Programme.Adv Ther. 2022 May;39(5):2270-2280. doi: 10.1007/s12325-022-02076-7. Epub 2022 Mar 13. Adv Ther. 2022. PMID: 35279810 Free PMC article.
-
Environmental impact of cardiovascular healthcare.Open Heart. 2023 May;10(1):e002279. doi: 10.1136/openhrt-2023-002279. Open Heart. 2023. PMID: 37130659 Free PMC article.
-
Long non-coding RNA screening and identification of potential biomarkers for type 2 diabetes.J Clin Lab Anal. 2022 Apr;36(4):e24280. doi: 10.1002/jcla.24280. Epub 2022 Mar 7. J Clin Lab Anal. 2022. PMID: 35257412 Free PMC article.
-
Ambition With Uncertainty: Exploring Policy-Makers' Perspectives on Pathways to Net Zero Healthcare.Int J Health Policy Manag. 2025;14:8440. doi: 10.34172/ijhpm.8440. Epub 2025 Jan 15. Int J Health Policy Manag. 2025. PMID: 40767189 Free PMC article.
-
Health Technology Assessment and Environmental Impact: A Scoping Review of State of Art and Future Perspective.Appl Health Econ Health Policy. 2025 Jun 23. doi: 10.1007/s40258-025-00984-7. Online ahead of print. Appl Health Econ Health Policy. 2025. PMID: 40549262 Review.
References
-
- International Diabetes Federation IDF atlas. 9th edn, 2019. https://www.diabetesatlas.org/en/
-
- Sustainable Development Unit Carbon footprint update for NHS in England 2015, 2016. Available: https://www.sduhealth.org.uk/documents/publications/2016/Carbon_Footprin... [Accessed 19 Feb 2020].
-
- HM Government Climate change act 2008, 2008. Available: https://www.legislation.gov.uk/ukpga/2008/27/pdfs/ukpga_20080027_en.pdf [Accessed 19 Feb 2020].
Publication types
MeSH terms
Substances
LinkOut - more resources
Full Text Sources
Medical
Miscellaneous