. 2020 Apr 17;368(6488):eaba0712.
doi: 10.1126/science.aba0712.

Mechanisms generating cancer genome complexity from a single cell division error

Affiliations

Mechanisms generating cancer genome complexity from a single cell division error

Neil T Umbreit et al. Science. .

Abstract

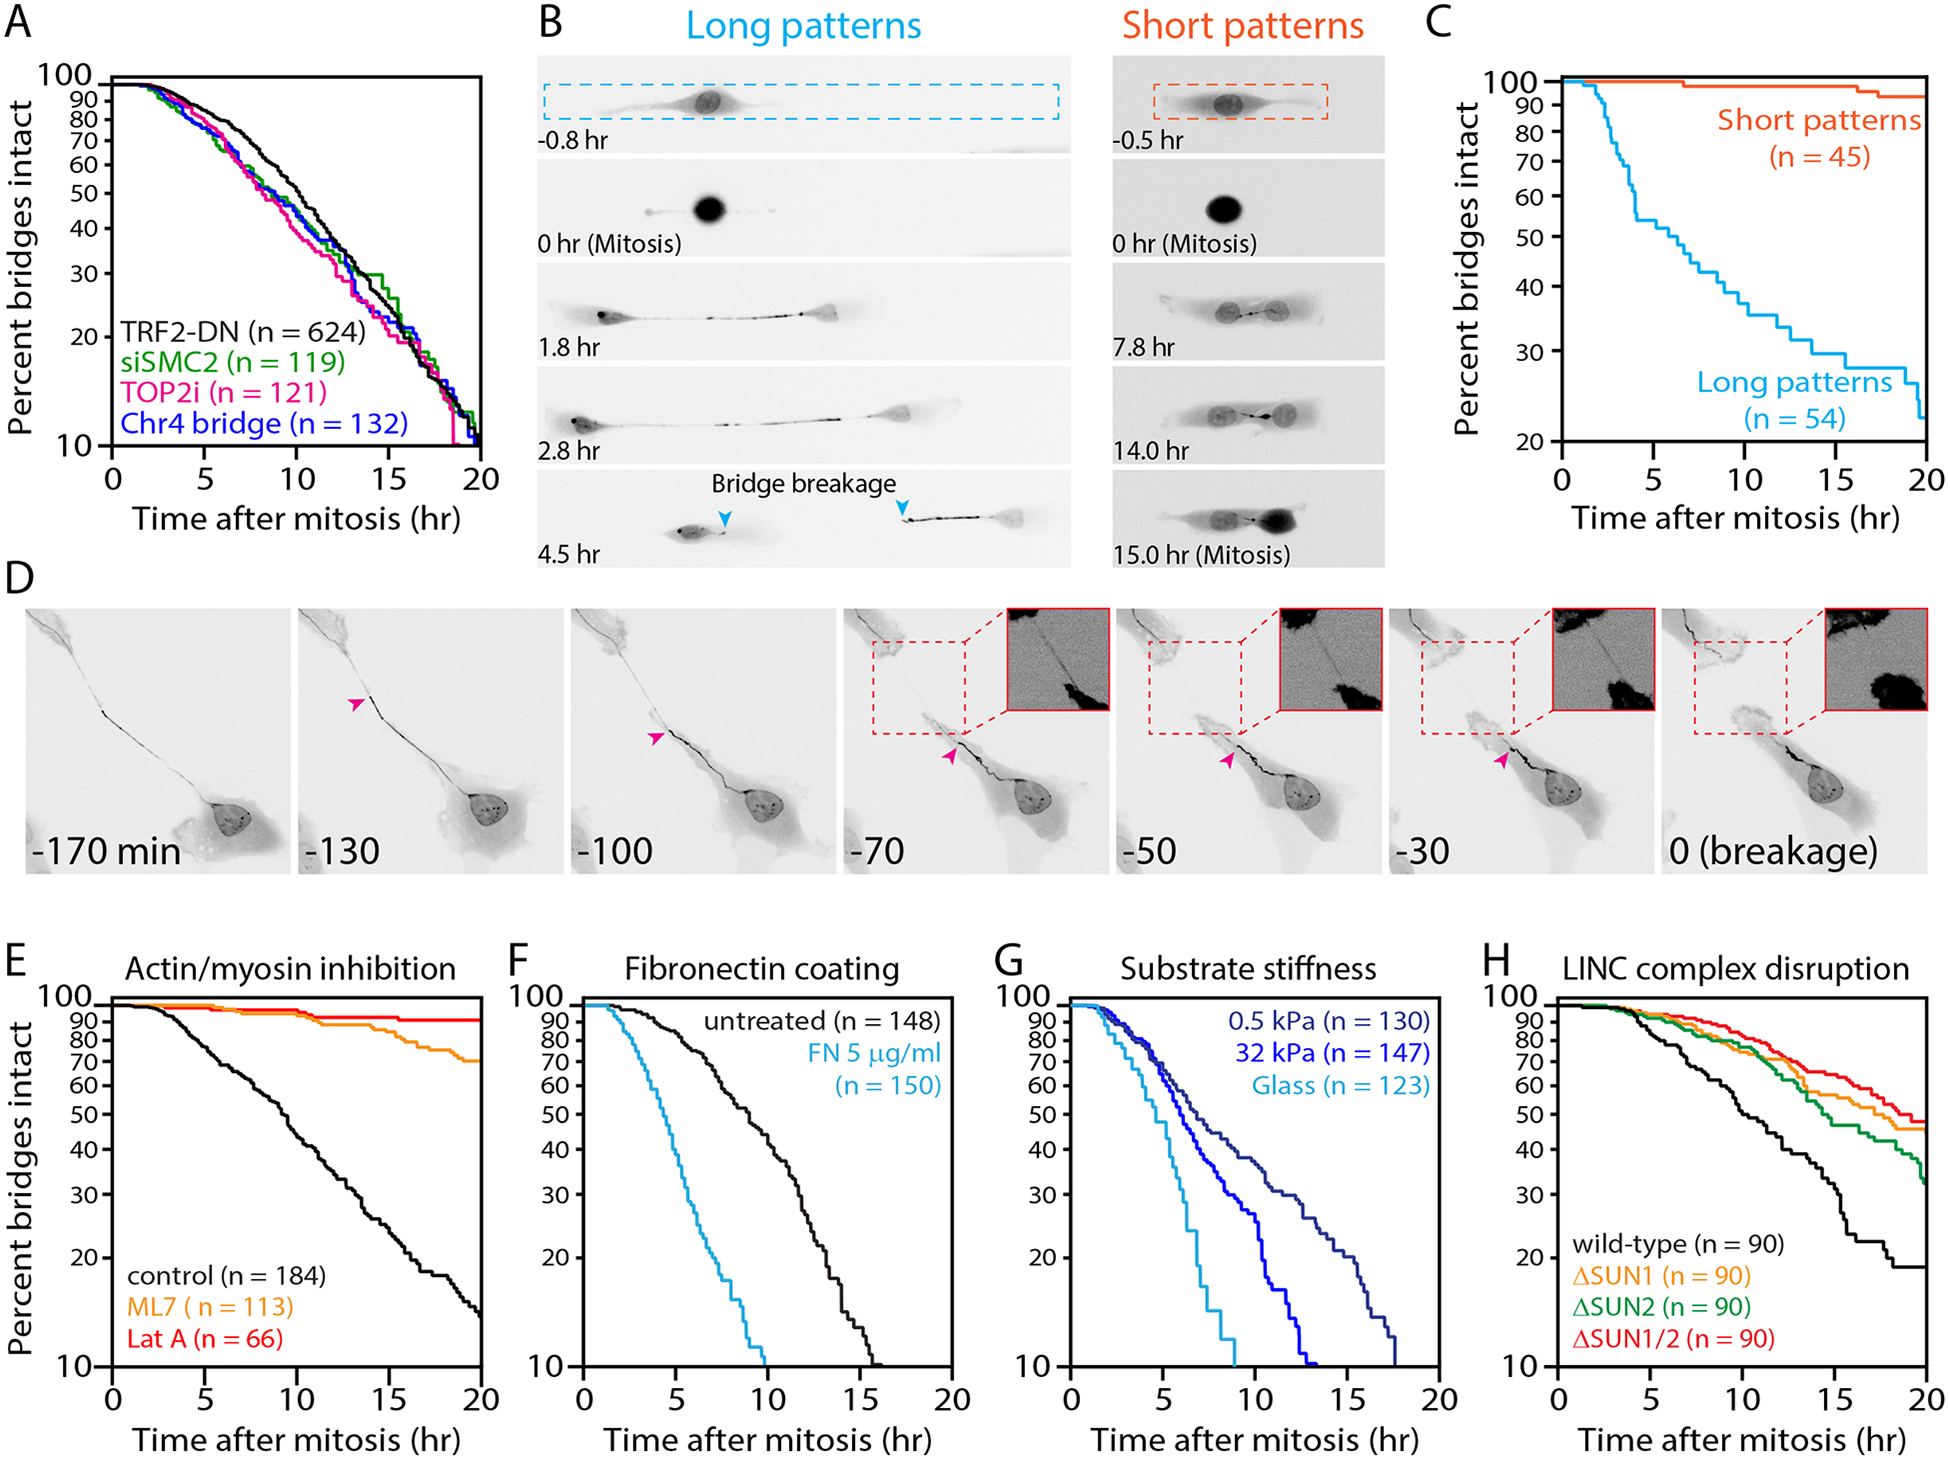
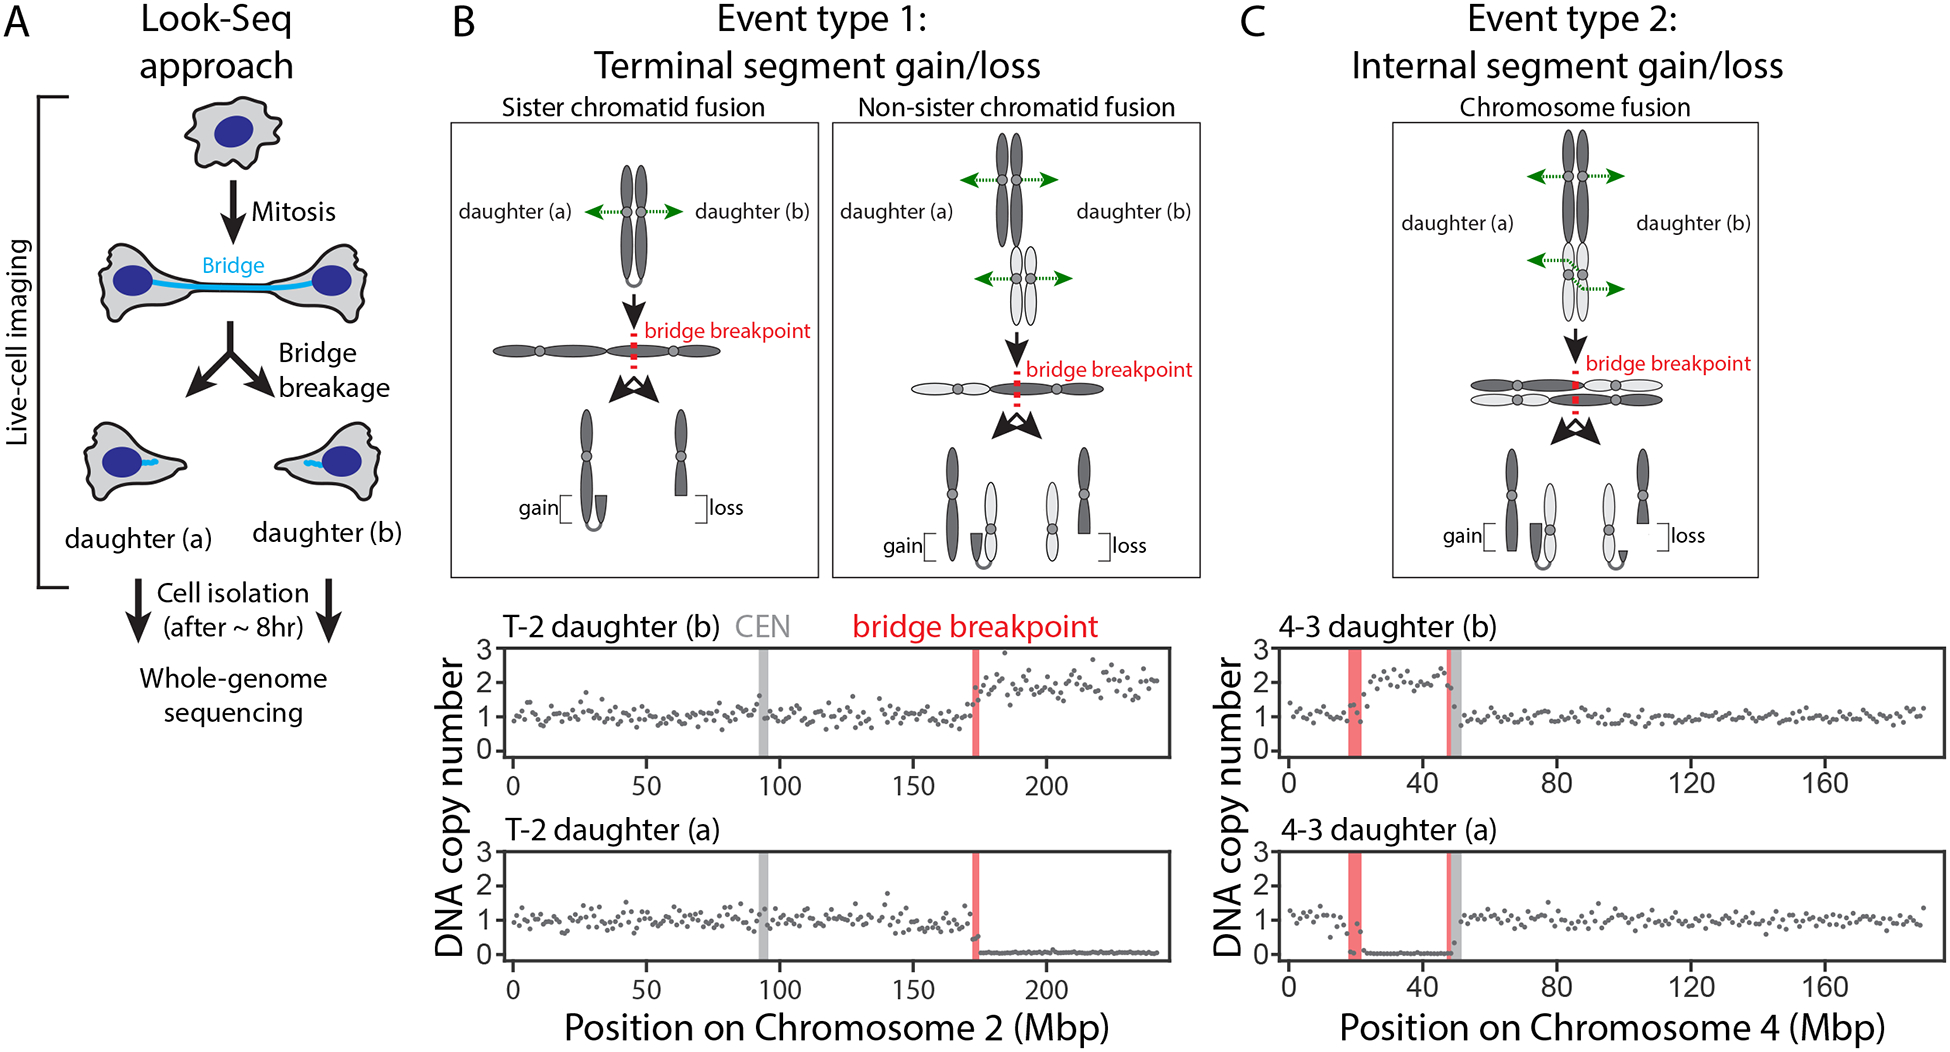
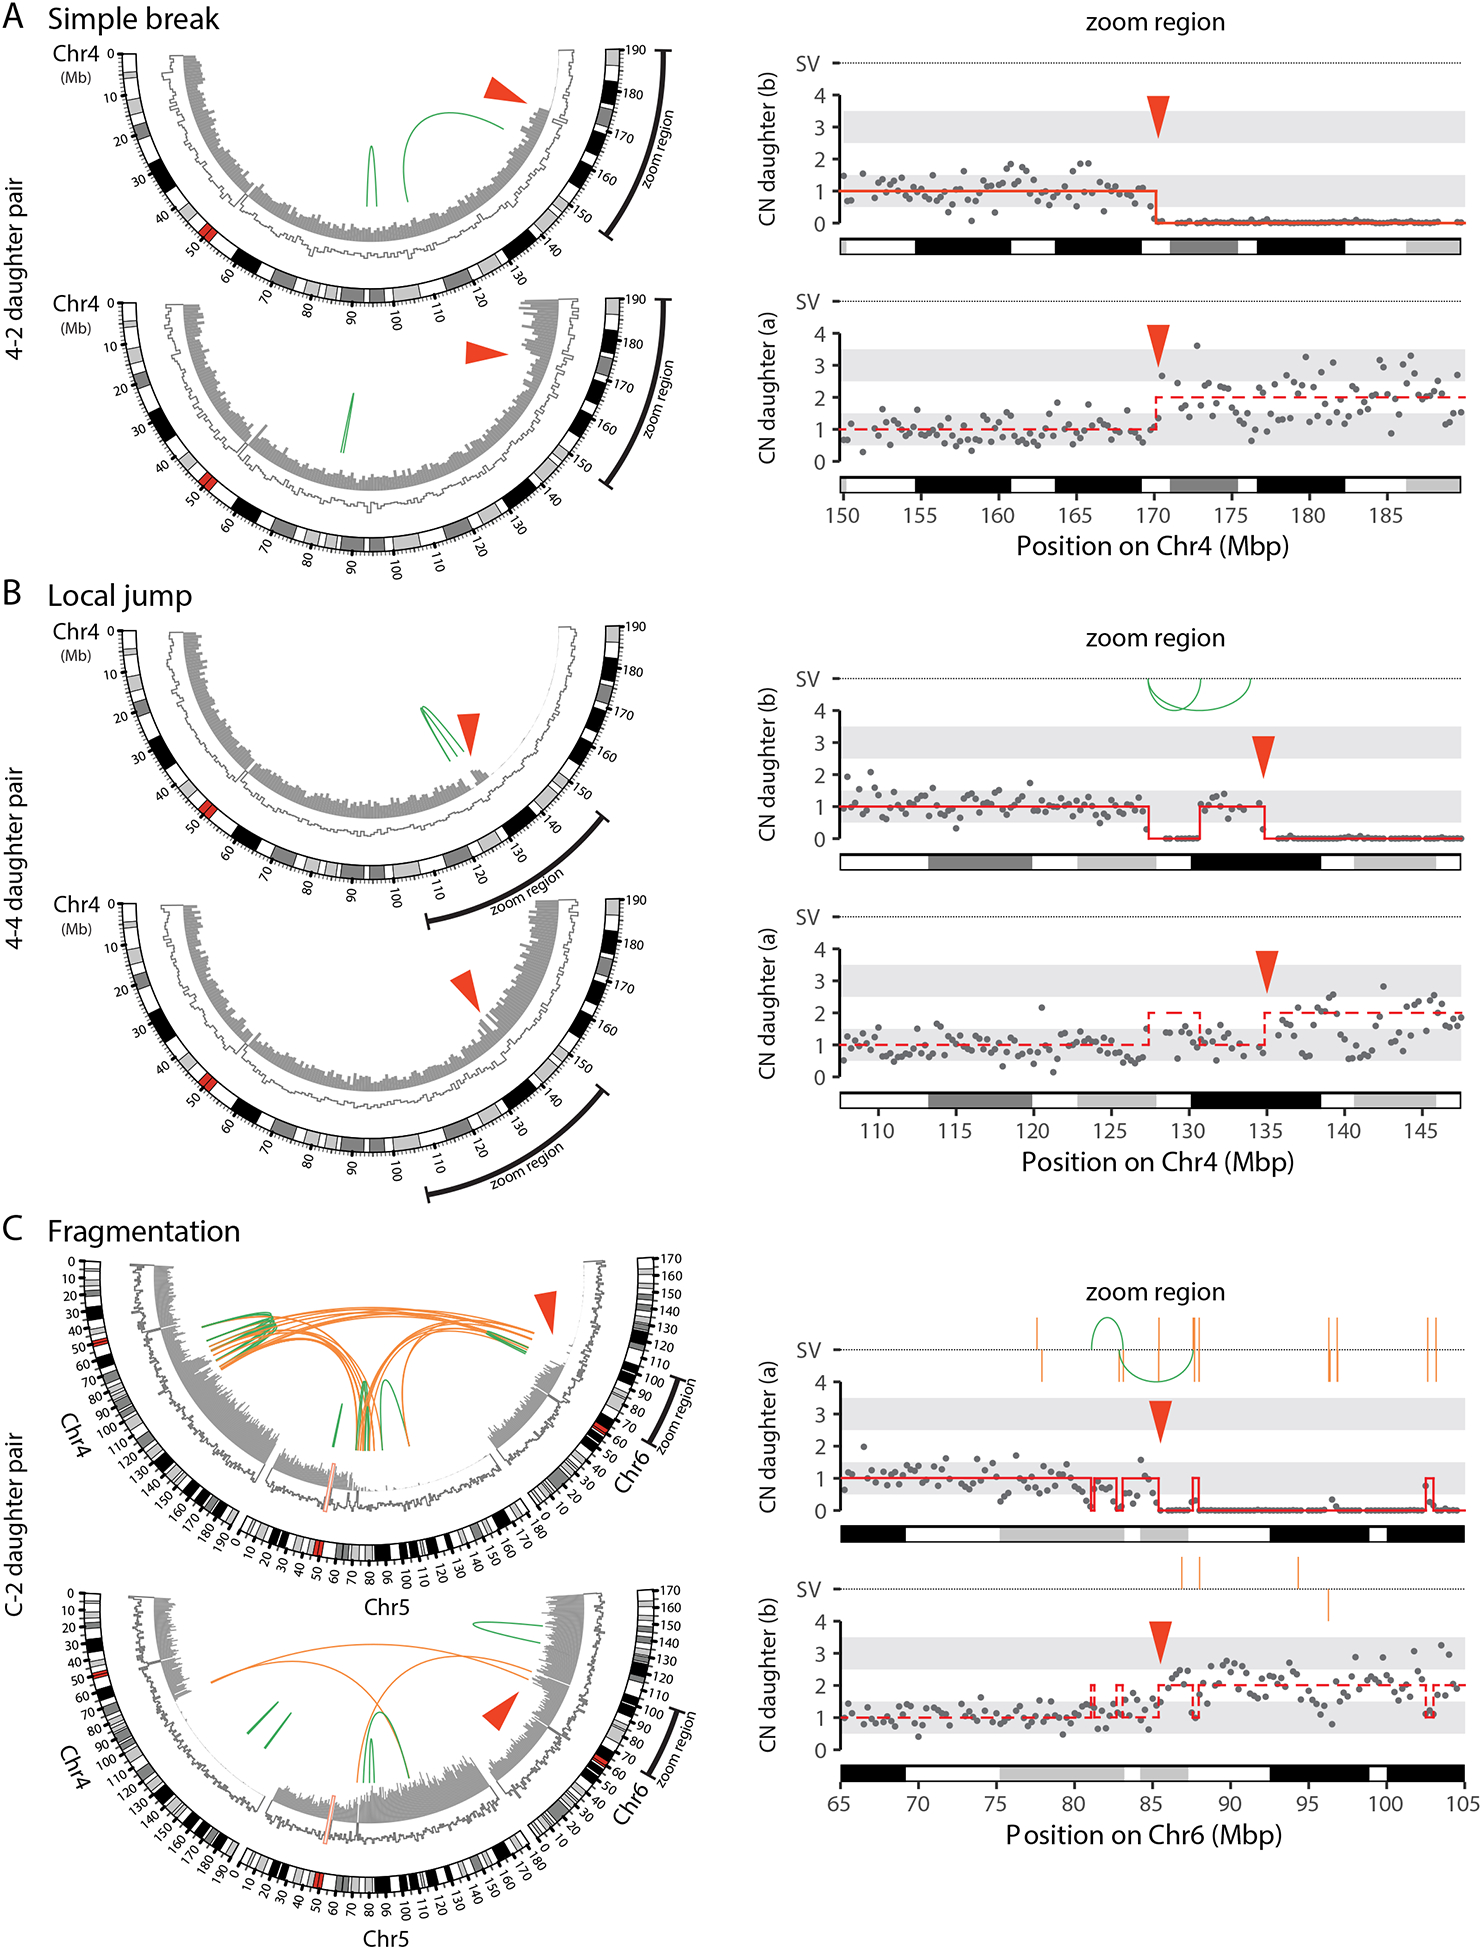
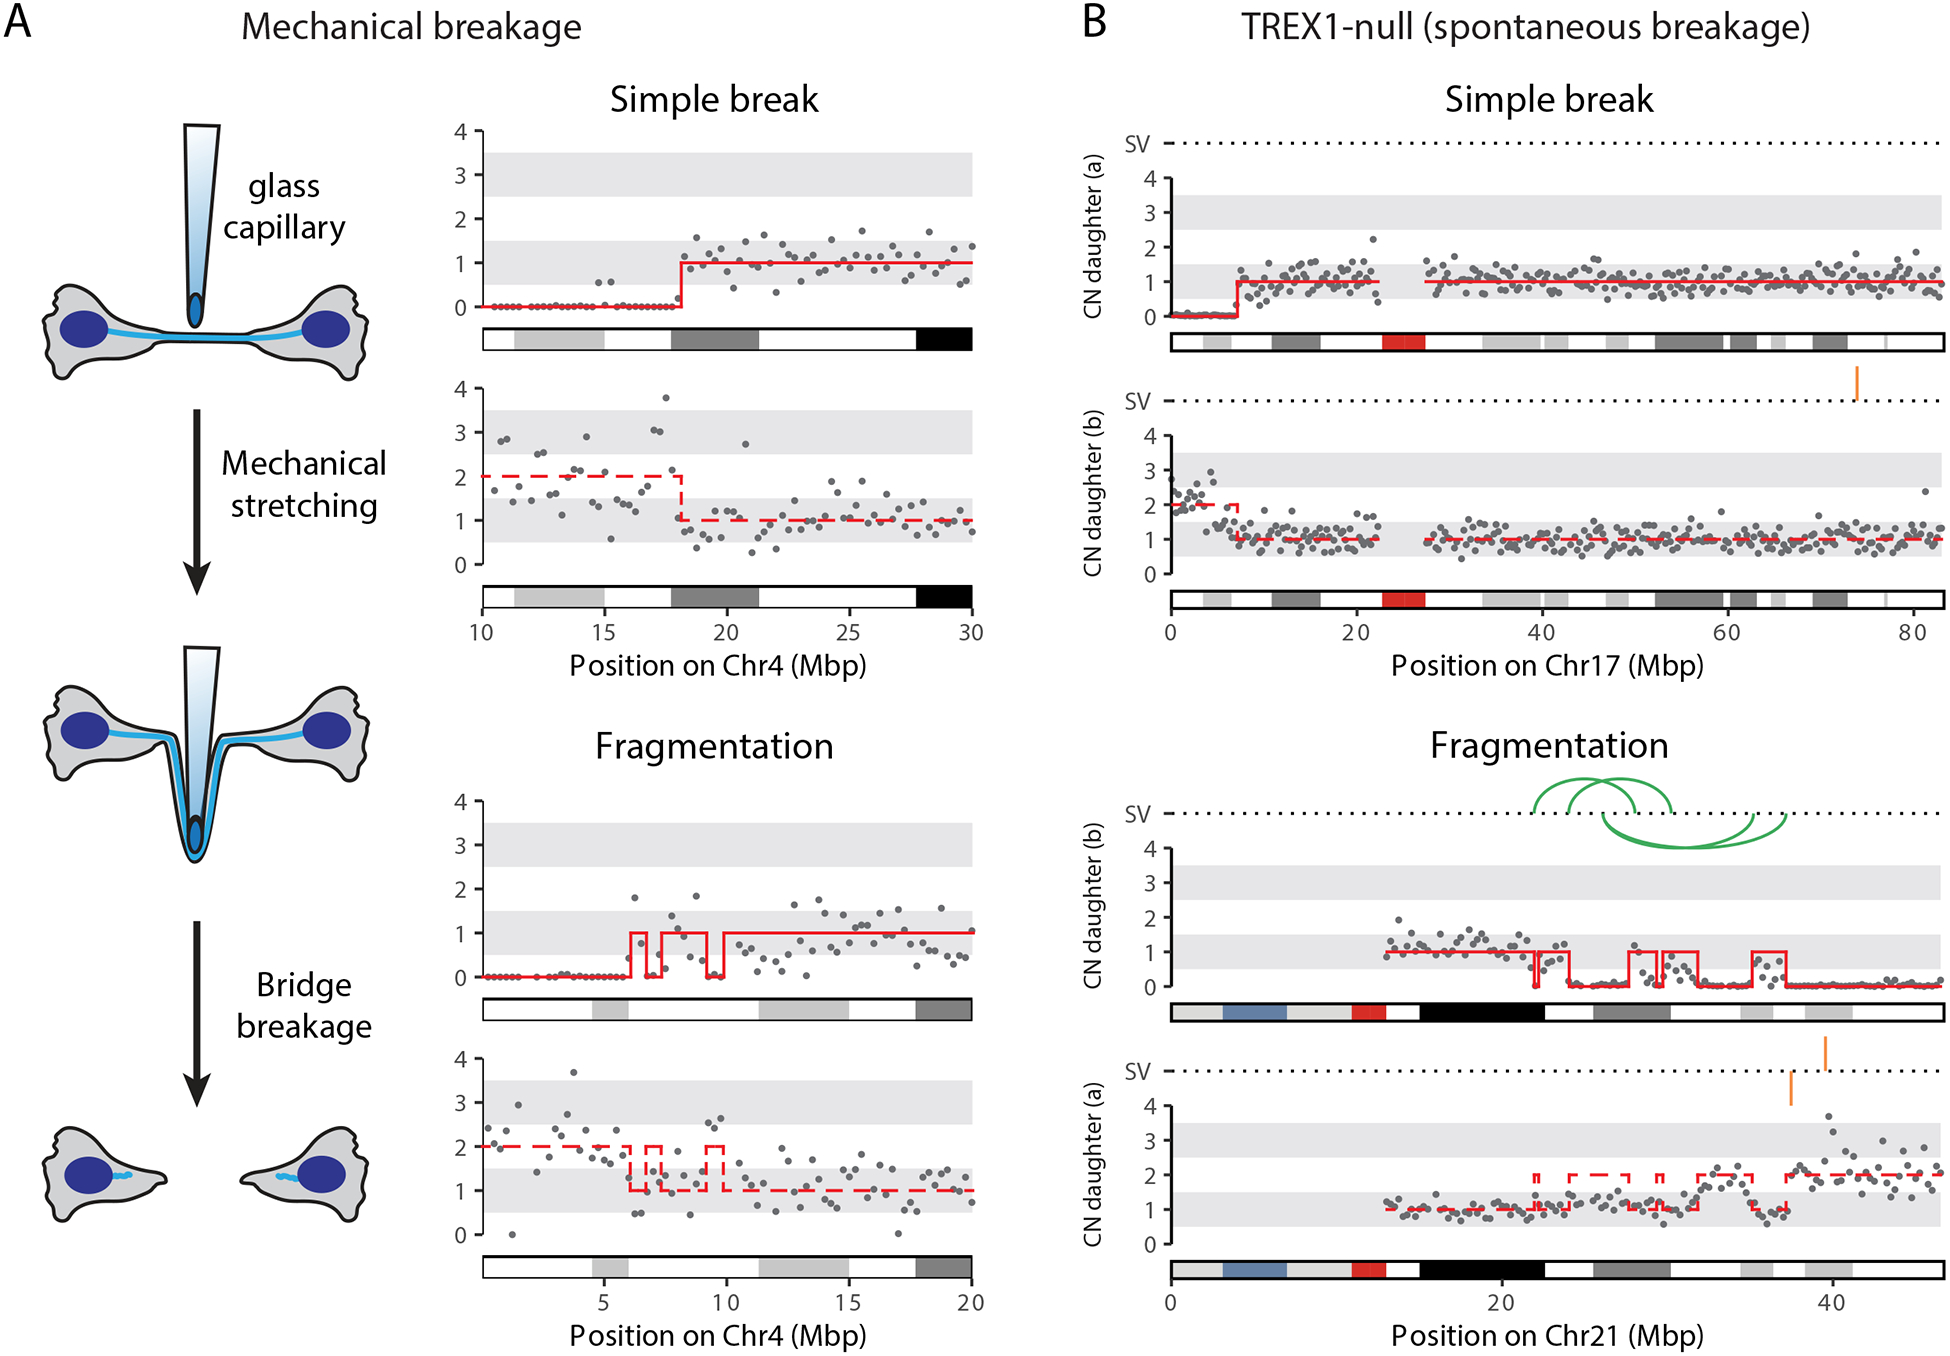
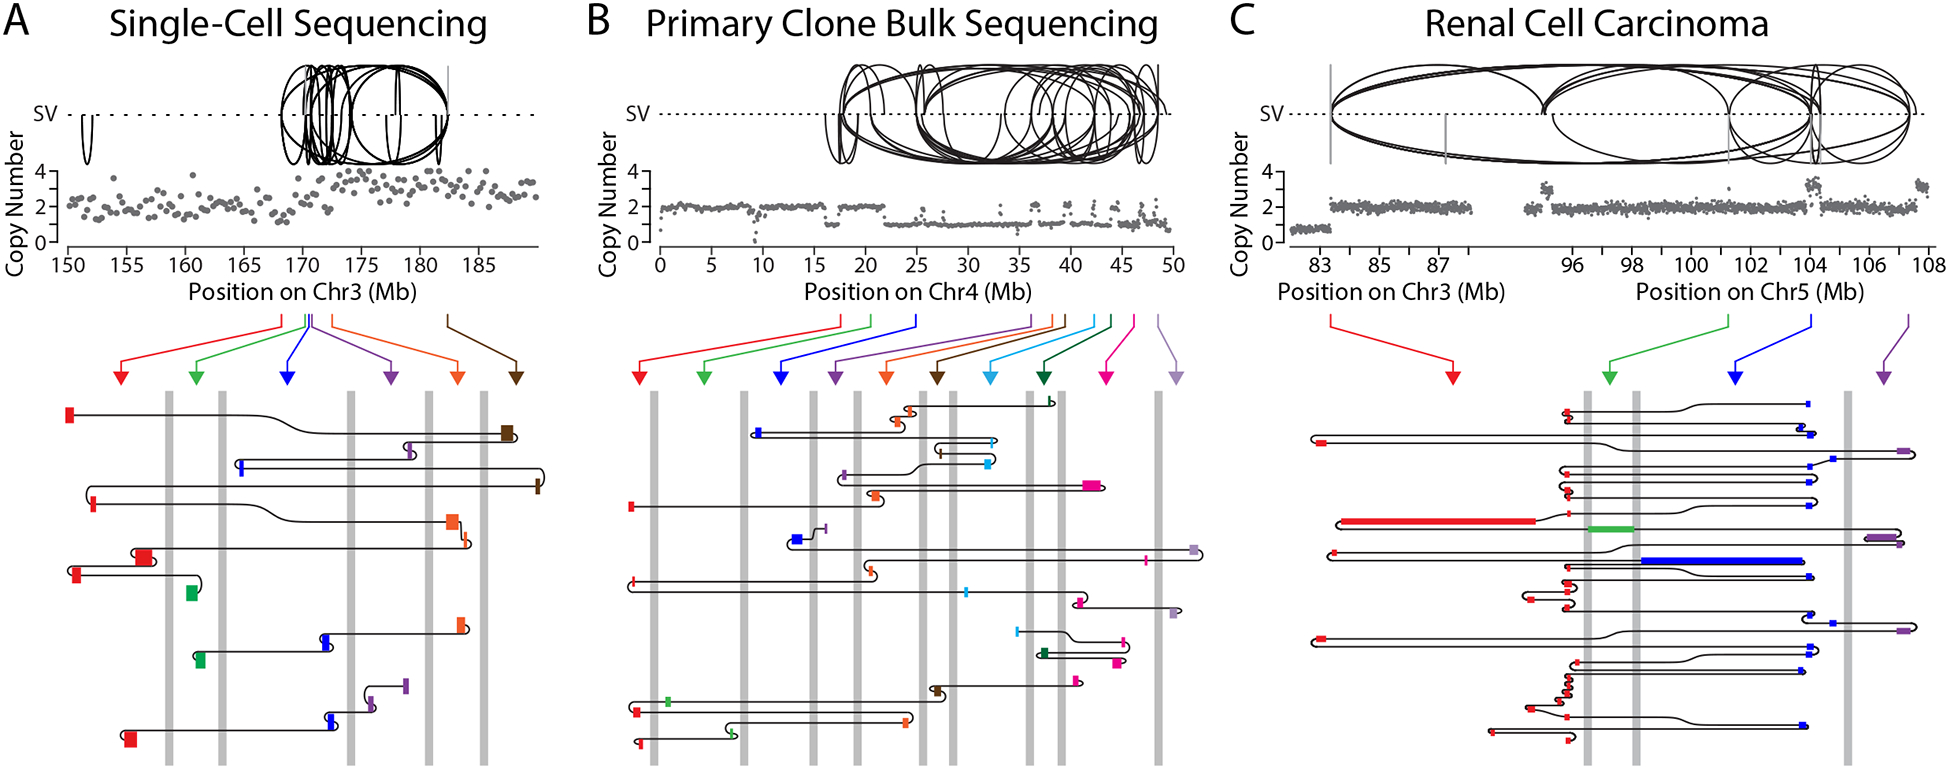
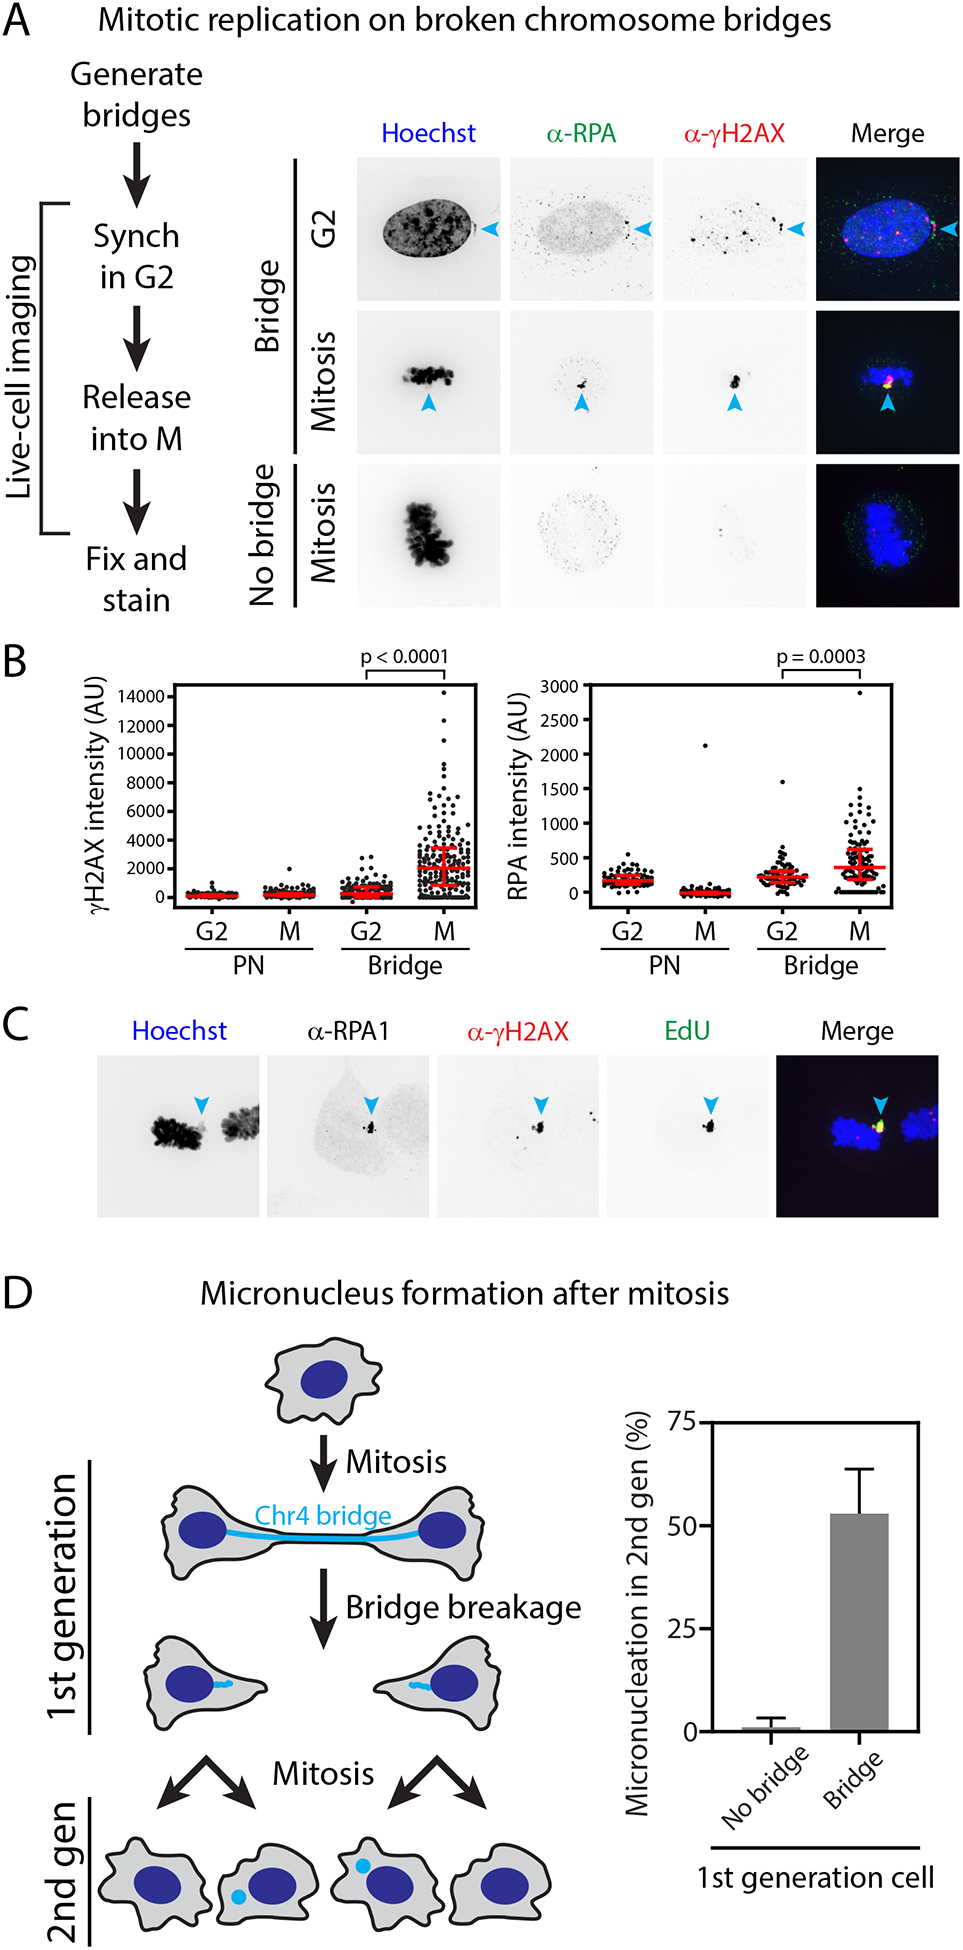
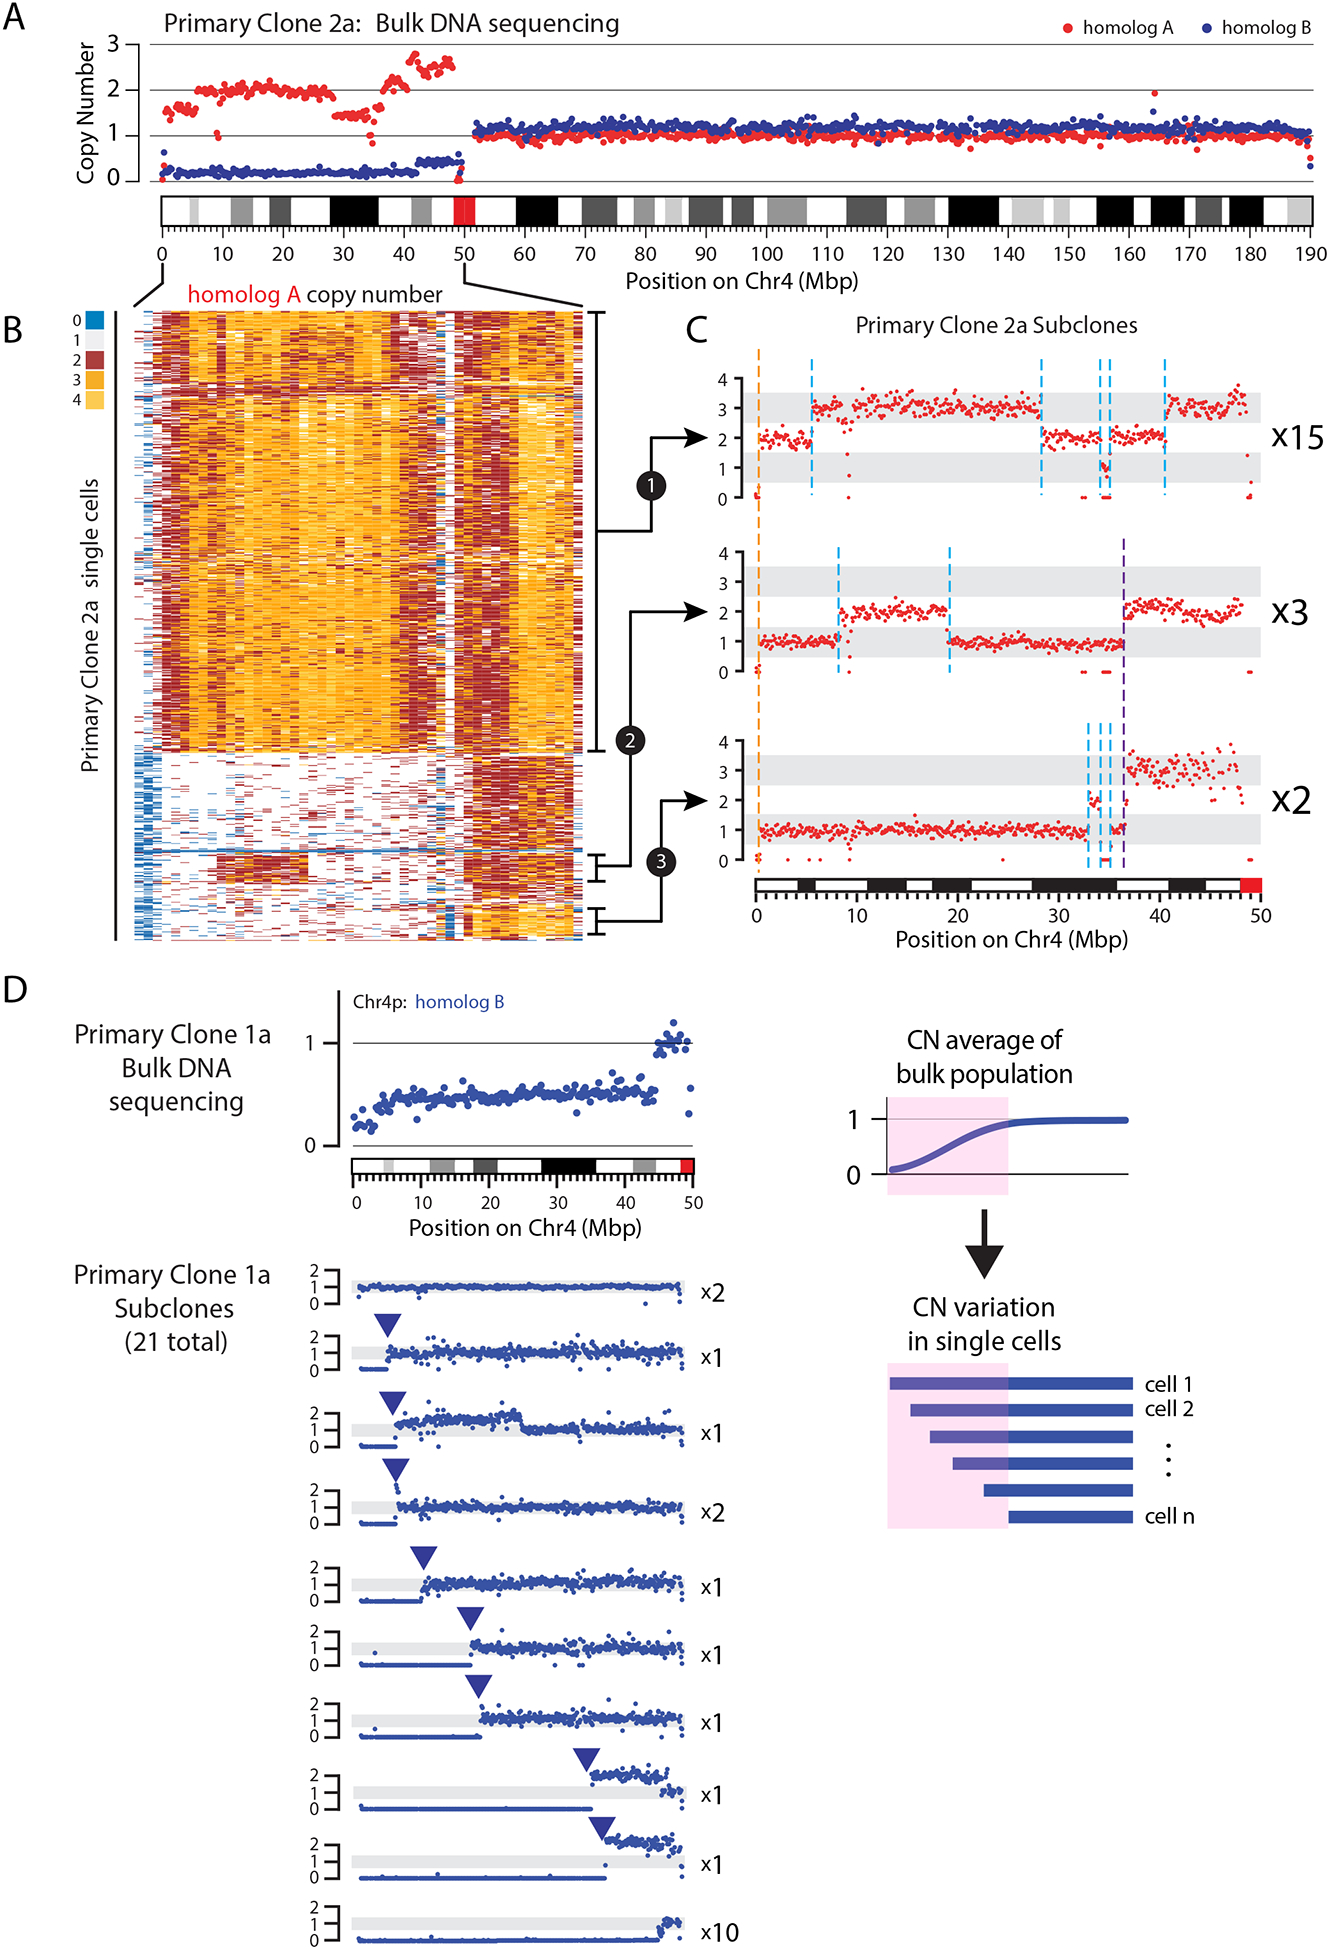
The chromosome breakage-fusion-bridge (BFB) cycle is a mutational process that produces gene amplification and genome instability. Signatures of BFB cycles can be observed in cancer genomes alongside chromothripsis, another catastrophic mutational phenomenon. We explain this association by elucidating a mutational cascade that is triggered by a single cell division error-chromosome bridge formation-that rapidly increases genomic complexity. We show that actomyosin forces are required for initial bridge breakage. Chromothripsis accumulates, beginning with aberrant interphase replication of bridge DNA. A subsequent burst of DNA replication in the next mitosis generates extensive DNA damage. During this second cell division, broken bridge chromosomes frequently missegregate and form micronuclei, promoting additional chromothripsis. We propose that iterations of this mutational cascade generate the continuing evolution and subclonal heterogeneity characteristic of many human cancers.


Conflict of interest statement

COMPETING INTERESTS

The authors declare no competing interests.

Figures

Figure 1.
Figure 1.. Chromosome bridge breakage requires actomyosin contractility.
(A) Indistinguishable chromosome bridge lifetimes observed with different methods for bridge induction. Shown are bridge lifetimes (time from bridge formation until breakage or mitotic entry). Bridges were visualized with GFP-BAF and generated by: inducible TRF2-DN (n=624 bridges analyzed), condensin partial knockdown (siSMC2, n=119), low-dose ICRF-193 (n=121), or inducible CRISPR/Cas9 cutting of Chr4 subtelomere (n=132). These mean bridge lifetimes are not significantly different (p=0.14, one-way ANOVA). (B) Extension of chromosome bridges is required for their breakage. Time-lapse images (GFP-BAF) of cells with bridges on “long” (20×300 μm) or “short” (20×100 μm) fibronectin micropatterns. Bridge length does not exceed ~50 μm on short patterns. Dashed lines: micropattern borders. Teal arrowheads: broken bridge ends. Timestamp is relative to completion of the previous mitosis. (C) Quantification from (B): bridge lifetime on short (n=45) and long (n=54) micropatterns (p<0.0001, Mann-Whitney). (D) Representative chromosome bridge breakage event. Prior to breakage, there is apparent non-uniform stretching of the bridge (GFP-BAF). Magenta arrowhead: a transition between “taut” and “slack” regions of the bridge. The taut region progressively stretches, the slack region progressively retracts, and breakage occurs in the taut region. Inset images: high contrast of the taut region (dashed red boxes) before and after breakage. Timestamp is relative to bridge breakage. (E) Actomyosin contractility is required for bridge breakage. Cells were allowed to divide and form bridges before exchange into drug medium (see Fig. S5D for scheme). Plot shows bridge lifetimes with actin disruption (LatA, n=66), myosin-II inhibition (ML7, n=113), and control (DMSO, n=184). (F) Increased cellular contractility decreases bridge lifetime. Bridge lifetimes on untreated glass (n=148) or fibronectin (FN)-coated glass (n=150). (G) Bridge breakage timing depends on substrate stiffness: glass (>106 kPa, n=123), stiff gel (32 kPa, n=147), and soft gel (0.5 kPa, n=130). All substrates were coated with 5 μg/ml fibronectin. (H) Partial requirement of LINC complex for bridge breakage: wild-type (n=90), ΔSUN1 (n=90), ΔSUN2 (n=90), and ΔSUN1/ΔSUN2 (n=90) RPE-1 cells.
Figure 2.
Figure 2.. Immediate effect of chromosome bridge breakage on DNA copy number.
(A) Cartoon illustrating Look-Seq experiments. (B) Type 1 events are daughter cells with reciprocal gain and loss of a terminal chromosome segment. Top: Sister (left) and Non-sister (right) chromatid fusions. In mitosis, the resulting dicentrics are segregated (green dashed arrows), forming a bridge. Bridge breakage (dashed red line) produces copy number alterations as shown. Bottom: representative copy number plot (gray dots, 1-Mb bins for the affected Chr2 haplotype). Red bar: inferred bridge breakpoint. Light gray bar: centromere. (C) Type 2 events are reciprocal gain and loss of an internal chromosome segment between the daughter cells. Top: a chromosome fusion (40). If the kinetochores of each dicentric attach to microtubules from opposite poles as shown (dashed green arrows), the dicentric chromatids invert relative to each other. Cleavage of the antiparallel chromatid pair yields reciprocal copy number alterations of an internal chromosome segment. Bottom: DNA copy number plot as in (B).
Figure 3.
Figure 3.. Localized DNA breakage and rearrangement with bridge breakage.
(A) Simple bridge breakage. Left: CIRCOS plots showing the bridge chromosome (Chr4). Outer arc: chromosome cytoband. Inner arcs: DNA copy number for the bridge haplotype (filled gray bars) and the non-bridge haplotype (white bars, gray outline). Green lines: intrachromosomal structural variants (SVs). Red arrowhead: bridge breakpoint. Right: Zoom-region plot shows copy number (gray dots: 250-kb bins) near the bridge breakpoint. Copy-number segments (red solid lines) were determined using SNP-level coverage in the top daughter (Supplemental Methods); the bottom daughter is inferred to contain reciprocal copy-number segments (dashed red lines). SVs, as in CIRCOS plots, are shown above. (B) Bridge breakage can produce the “local jump” pattern. As in (A), CIRCOS plots (Left) and zoom-region plot (Right) for the bridge chromosome (Chr4). (C) Local fragmentation and complex rearrangement with bridge breakage. As in (A), CIRCOS plots (Left) and zoom-region plot (Right) for a bridge containing three different chromosomes (Chr4, Chr5, and Chr6) showing local fragmentation. The pattern of rearrangements in daughter (b) indicates end-joining of these fragments, producing intra- and inter-chromosomal rearrangements (green and orange lines, respectively). Daughter (a) additionally evidences the TST jump rearrangement pattern (see Fig. 5).
Figure 4.
Figure 4.. Local fragmentation accompanies mechanical bridge breakage and does not require TREX1.
(A) Mechanical bridge breakage produces simple breaks and local fragmentation. Left: schematic of the experiment. Cells were collected immediately after mechanical bridge breakage to determine its direct consequences (i.e. not allowing time to generate chromosomal rearrangements). Right: Copy number plots, as in Fig. 3, show examples of simple bridge breakage (top) and local fragmentation (bottom). (B) Copy number and SV plots, in Fig. 3: simple bridge breakage (top) and local fragmentation (bottom) after spontaneous bridge breakage in TREX1-null cells.
Figure 5.
Figure 5.. The Tandem Short Template (TST) jump rearrangement signature.
(A) Features of the TST jump signature. Top: plots show copy number (gray dots, 250-kb bins) and SVs (black: intrachromosomal; gray interchromosomal) for a region near the bridge breakpoint on Chr3. Bottom: schematic shows three chains of templated insertions (rectangles), colored according to their origin from six breakpoint hotspots (arrows from Top). Templated insertions are connected as shown by black lines, in a zoom-region view for each breakpoint hotspot (≤10-kb window in each region). Grey vertical lines are axis breaks indicating distances of >10 kb between the hotspots. (B) The TST jump signature in bulk sequencing data from a primary clone after bridge breakage. As in (A), Top: copy number (250-kb bins) and SVs for the bridge chromosome (Chr4). Bottom: four chains of templated insertions originating from 10 breakpoint hotspots. (C) TST jump signature in long-read sequencing from a renal cell carcinoma sample. As in (A), Top: copy number (10-kb bins) and SVs for the region of unbalanced translocation between Chr3 and Chr5. Bottom: one chain of templated insertions originating from four breakpoint hotspots (3- to 10-kb windows).
Figure 6.
Figure 6.. Broken bridge chromosomes undergo mitotic DNA damage and frequent mis-segregation to form micronuclei.
(A) Mitosis-specific damage of bridge DNA detected by correlative live-cell/same-cell fixed imaging. Left: schematic of the experiment. Right: example images of cells with broken bridges in G2 or in mitosis, compared to a control mitotic cell (no bridge in the prior interphase). Cyan arrowheads: bridge chromosome. (B) Quantification from (A); p-values from Mann-Whitney test. (C) DNA damage (γ-H2AX) coincides with RPA accumulation and active DNA replication (EdU). Cyan arrowheads: bridge chromosome. (D) Frequent micronucleation in the second generation after bridge formation. Left: schematic of the live-cell imaging experiment. A cell divides, forming a CRISPR-induced Chr4 bridge (1st generation). After bridge breakage, daughter cells divide, forming “granddaughter” cells (2nd generation). Right: Frequency of micronucleation in 2nd-generation cells was measured for control cells that did not have a bridge in the 1st generation (No bridge) as compared to cells that did (Bridge).
Figure 7.
Figure 7.. Ongoing instability and subclonal heterogeneity after chromosome bridge formation.
(A) Bulk sequencing indicates subclonal heterogeneity within a primary clone derived from a single cell after bridge breakage. Plot shows DNA copy number (CN) for the two Chr4 homologs (red and blue dots, 25-kb bins). Regions of non-integer CN indicate the existence of subclones with different CN states. (B) CN heatmap for Chr4p (0–50 Mb) homolog A in 637 single cells. Each row represents one cell. Different subclonal populations can be identified that exhibit CN profiles consistent with those seen in single cell-derived subclones, shown in (C). (C) CN profiles for Chr4p homolog A (red dots, 25-kb bins) in 20 subclones grown from single cells isolated from one primary clone. One CN transition (breakpoint) is shared by all subclones (dashed orange line) whereas other CN changes are shared only among a subset of subclones (dashed purple line), or are private to individual subclones (dashed cyan lines). The number of subclones represented in each CN profile is listed next to each plot. (D) Detection of ongoing chromosomal instability in a primary clone. Left Top: CN for Chr4p homolog B from bulk sequencing of the primary clone. Left Bottom: 10 unique CN profiles identified from 21 single-cell derived subclones obtained from the primary clone. The number of subclones represented in each CN profile is listed next to each plot. Right: Schematic shows how gradual sloping copy number transitions in bulk populations are explained by subconal heterogeneity.

Comment in

  • Burning bridges in cancer genomes.
    Paiano J, Nussenzweig A. Paiano J, et al. Science. 2020 Apr 17;368(6488):240-241. doi: 10.1126/science.abb4899. Science. 2020. PMID: 32299935 No abstract available.

References

    1. Campbell PJ et al., Pan-cancer analysis of whole genomes. Nature 578, 82–93 (2020). - PMC - PubMed
    1. Cortés-Ciriano I et al., Comprehensive analysis of chromothripsis in 2,658 human cancers using whole-genome sequencing. Nature Genetics (2020). - PMC - PubMed
    1. Fujiwara T et al., Cytokinesis failure generating tetraploids promotes tumorigenesis in p53-null cells. Nature 437, 1043–1047 (2005). - PubMed
    1. Leibowitz ML, Zhang CZ, Pellman D, Chromothripsis: A New Mechanism for Rapid Karyotype Evolution. Annu Rev Genet 49, 183–211 (2015). - PubMed
    1. Ly P, Cleveland DW, Rebuilding Chromosomes After Catastrophe: Emerging Mechanisms of Chromothripsis. Trends Cell Biol 27, 917–930 (2017). - PMC - PubMed

Publication types