. 2020 Apr 17;368(6488):283-290.
doi: 10.1126/science.aaz6465.

Metabolomics and mass spectrometry imaging reveal channeled de novo purine synthesis in cells

Affiliations

Metabolomics and mass spectrometry imaging reveal channeled de novo purine synthesis in cells

Vidhi Pareek et al. Science. .

Abstract

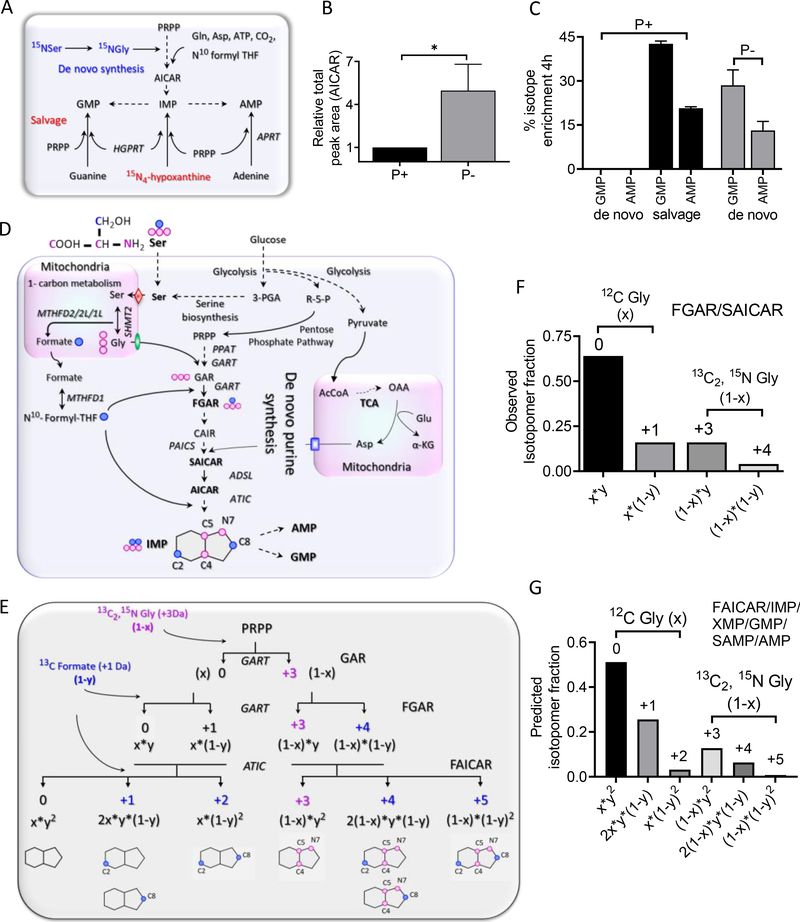
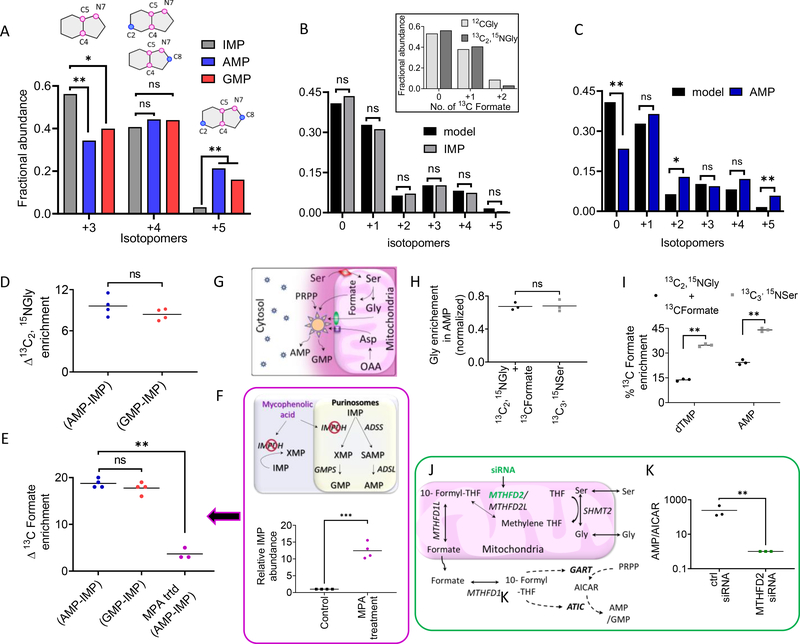
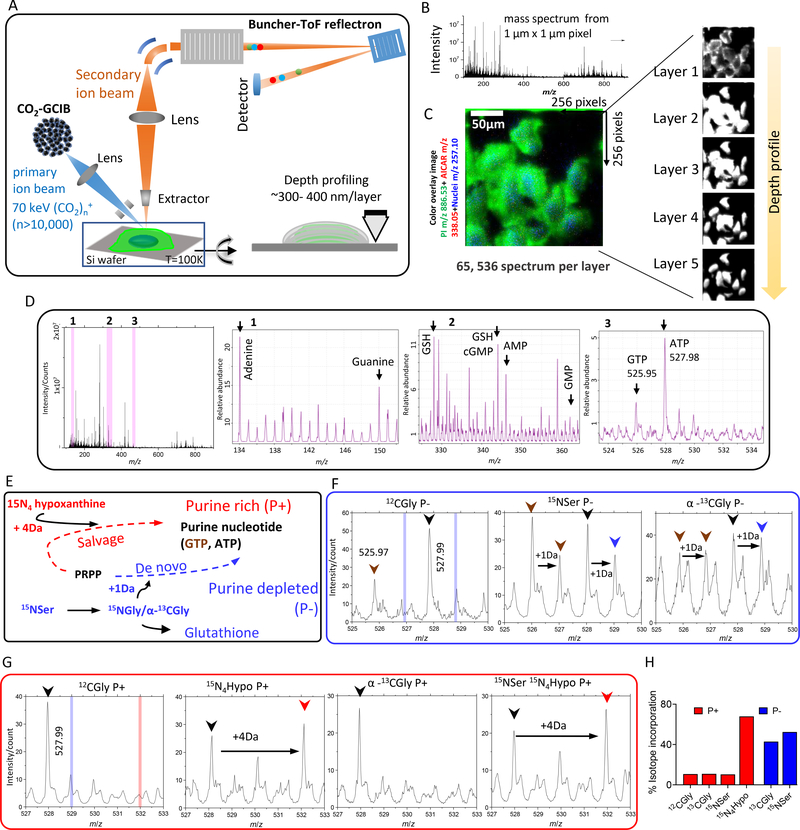
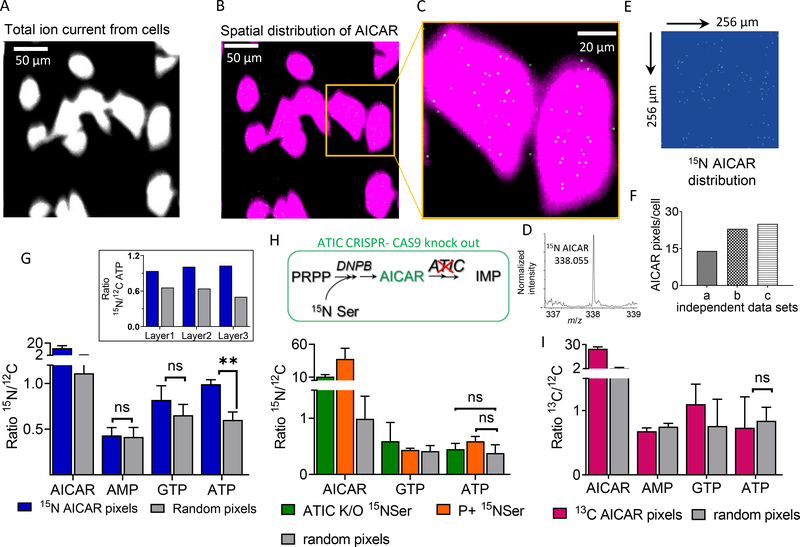
Metabolons, multiprotein complexes consisting of sequential enzymes of a metabolic pathway, are proposed to be biosynthetic "hotspots" within the cell. However, experimental demonstration of their presence and functions has remained challenging. We used metabolomics and in situ three-dimensional submicrometer chemical imaging of single cells by gas cluster ion beam secondary ion mass spectrometry (GCIB-SIMS) to directly visualize de novo purine biosynthesis by a multienzyme complex, the purinosome. We found that purinosomes comprise nine enzymes that act synergistically, channeling the pathway intermediates to synthesize purine nucleotides, increasing the pathway flux, and influencing the adenosine monophosphate/guanosine monophosphate ratio. Our work also highlights the application of high-resolution GCIB-SIMS for multiplexed biomolecular analysis at the level of single cells.


Conflict of interest statement

Competing interests: The authors declare no conflict of interest.

Figures

Fig. 1.
Fig. 1.. A theoretical model to interrogate DNPB in HeLa cells upon pathway upregulation.
(A) Purine nucleotides can be regenerated by salvage synthesis (conversion of free purine base back to the nucleotides) or a 10-step de novo purine biosynthesis (DNPB) starting with PRPP. [15N4]Hypoxanthine (Hypo) incorporation is used to monitor salvage; [15N]Serderived Gly ([15N]Gly) incorporation is used to monitor DNPB flux. (B) Abundance of the DNPB pathway intermediate AICAR for purine-rich (P+) or purine-depleted (P−) media conditions. *P < 0.02 (two-tailed t test). (C) [15N]Ser incorporation in the end products AMP and GMP. Data in (B) and (C) are means ± SD of three independent experiments. (D) The metabolic interdependence of the cytosolic and mitochondrial metabolism to support DNPB and the flow of stable isotope–labeled Gly and formate, generated in mitochondria from labeled [13C3,15N]Ser, into the DNPB pathway intermediates and the end-product nucleotides. Pink circles denote 13C and 15N atoms of the labeled Ser backbone (produces [13C2,15N]Gly, +3 Da); blue circles represent the 13C at its side-chain β position ([13C]formate, +1 Da). Each pink and blue circle denotes incorporation of one labeled atom. Red diamond, SFXN1 (mitochondrial Ser transporter); green oval, SLC25A38 (mitochondrial Gly transporter); blue rectangle, SLC25A12/SLC25A13 (mitochondrial glutamate/aspartate transporter). See fig. S1 caption for acronyms not defined in text. (E) The classical DNPB pathway model and the isotopomers of intermediates and end nucleotides, with the labeled positions indicated on the product purine ring. Labeled Gly [x, unlabeled fraction; (1 – x), labeled fraction] and labeled formate [y, unlabeled fraction; (1 – y), labeled fraction] generated from [13C3,15N]Ser enter the DNPB pathway at three different steps (curved arrows); the first two are catalyzed by the enzyme GART and the third is catalyzed by the enzyme ATIC. Note that the +3, +4, and +5 isotopomer species in the end nucleotides show no interference from the preexisting or unlabeled nucleotide pools that are generated in parallel. (F) Example showing the use of the model to calculate (1 – x) and (1 – y) from the observed FGAR and SAICAR isotopomers. The values were calculated for each individual experiment. (G) The isotopomer distribution in FAICAR is predicted using the values of (1 – x) and (1 – y) and the observed SAICAR isotopomer distribution. All the end-product nucleotides (IMP, AMP, GMP) generated via DNPB in the time course of the experiment are expected to have the same isotopic distribution as FAICAR (fig. S1, A to C).
Fig. 2.
Fig. 2.. HeLa cells show highly channeled DNPB by enzymes proximal to mitochondria.
(A) Fractional distribution of de novo synthesized +3, +4, and +5 isotopomers in IMP, AMP, and GMP. The +3 isotopomer has a significantly lower fractional contribution in AMP and GMP relative to IMP, but that of the +5 isotopomer is significantly higher than IMP. A paired two-tailed t test was performed to analyze the ratio of isotopic abundance of each isotopomer. Data from four independent replicates were combined to assess the significance of the isotopomeric differences between IMP and AMP/GMP. *P < 0.05, **P < 0.005; ns, not significant. (B and C) The isotopomer distribution calculated according to the model described in Fig. 1G matched the observed distribution in IMP (B) but not AMP (C) [or GMP (fig. S2F)]. Inset in (B) shows overlay of the observed fractional abundances of IMP isotopomers arising from 0, 1, or 2 13C incorporations (derived from formyl-THF) in purine ring containing either unlabeled Gly or [13C2,15N]Gly for one representative experiment. The values were computed as described in fig. S1C. (D and E) There is a ~10% difference in [13C2,15N]Gly (D) and a ~15 to 20% difference in [13C]formate enrichment (E) between newly synthesized AMP/GMP and IMP. (F) [13C]Formate enrichment difference between AMP and IMP is significantly lowered upon mycophenolic acid (MPA) treatment [magenta symbols in (E)]. (G) Localization of a “complete” functional purinosome (which shows channeling, shown as large sun symbol) near mitochondria, the site of production of isotopically labeled Gly and formate, leads to higher isotope enrichment in the purine nucleotides, AMP and GMP, produced by metabolic channeling. Free enzymes and incomplete purinosomes residing away from the mitochondria (small sun symbols) show lower isotope enrichment because of their limited accessibility to labeled substrates. Other symbols and acronyms are the same as in Fig. 1A and fig. S1A. (H and I) Comparison of Gly and formate enrichment, respectively, in AMP [and GMP (fig. S2H)] when molar equivalents of [13C2,15N]Gly + [13C]formate were added to the media instead of [13C3,15N]Ser. As a result of the regeneration of labeled Ser from Gly and formate (fig. S2G) and further Ser metabolism in the mitochondria, channeled synthesis of AMP/GMP was still supported. (I) Consistent with the lower formate uptake, indicated by lower isotope enrichment in deoxythymidine monophosphate (dTMP), enrichment in AMP was lower with Gly + formate than with Ser. (J) DNPB enzymes GART and ATIC use 10-formyl-THF, and the cytosolic availability of this cofactor depends on the mitochondrial one-carbon metabolism that generates formate from Ser. (K) Knockdown of the mitochondrial one-carbon metabolism enzyme MTHFD2 by siRNA treatment led to a significant reduction in the de novo synthesized AMP and GMP flux but significant AICAR accumulation. For each experiment, three or four biological replicates were performed with one or two technical replicates; (A), (B), and (C) and fig. S2, D to F, correspond to the same representative experiment. In (B) and (C), data from four independent experiments were used for statistical analysis. *P < 0.05, **P < 0.005. In (D), (E), (H), (I), and (K), the mean and individual data points are plotted. *P < 0.05, **P < 0.005 (paired two-tailed t tests).
Fig. 3.
Fig. 3.. Identification of unique molecular ions of purine nucleotides in the intracellular pool by in situ GCIB-SIMS.
(A) Schematic of GCIB-SIMS imaging of HeLa cells. Imaging uses a finely focused 70-keV (CO2)n+ (n > 10,000) cluster beam to interrogate frozen hydrated HeLa cells three-dimensionally at 1-μm spatial resolution. Coupled with a buncher-ToF and direct-current beam setup, maximum spatial resolution and mass resolution can be retained. A pixel-by-pixel analysis was performed across a lateral field of view of 256 μm × 256 μm. (B) Mass spectra in the m/z range 0 to 900 were recorded for each pixel. (C) A composite two-dimensional colored image was generated combining the signal across all the layers PI (38:4; green) at m/z 886.53, phosphate-sugar backbone at m/z 257.10 (blue) from nucleotides, and 15N-enriched DNPB intermediate AICAR (red). Combination of mass spectral analysis and the spatial distribution of specific cellular signals demonstrates the reliability of the method for in situ biochemical studies. (D) Complete negative ion spectra from frozen hydrated HeLa cells with the unique peak assignments for the metabolites relevant to the study. The ordinate axis represents absolute intensity for each ion. Zoom-in view of the m/z ranges marked as 1, 2, and 3 and highlighted in pink bar are presented to show the peaks corresponding to (1) adenine and guanine base, (2) reduced glutathione (GSH), AMP, and GMP, and (3) salt adducts of ATP and GTP (spectra of all the standard compounds can be found in fig. S3). The intensities are relative to the highest abundant molecular ion. (E) Stable isotope enrichment under purine-rich (P+) and purine-depleted (P−) conditions via salvage (red) or de novo synthesis (blue) pathways, respectively. Isotope tracer experiments were leveraged to specifically label the purine base ring using either [15N4]hypoxanthine, imparting +4 Da mass increment, or [15N]Ser (metabolized to [15N]Gly) or [13C]Gly, imparting +1 Da mass increment. (F and G) Select SIMS ion spectra from P− (F) and P+ (G) HeLa cells for unlabeled (black arrowhead), 15N4-labeled (red arrowhead), or [13C,15N]ATP (blue arrowhead) and GTP (brown arrowhead) are shown along with the expected peak positions corresponding to +4 Da (vertical red bar) or +1 Da (vertical blue bar) mass increment, respectively. The intensities are relative to the highest abundant molecular ion. (H) The isotope enrichment profile was similar to that obtained from the high-resolution LC/MS spectrum of metabolite extracts of similarly grown cells.
Fig. 4.
Fig. 4.. Combining GCIB-SIMS and isotope label incorporation to identify the loci of channeled DNPB in single cells.
(A) Representative GCIB-SIMS image of P− HeLa cells grown on a Si substrate, with a field of view of 256 μm × 256 μm, after allowing [15N]Ser enrichment for 14 hours. Image was generated using cumulative total ion current in negative ion mode. (B) Spatial distribution of [15N]AICAR pixels in each analyzed layer was generated using Δm/z = 0.01, centered at m/z 338.055. (C) Zoomed-in view of the area of interest [yellow box in (B)] shows an overlay of the pixels with high [15N]AICAR abundance (white) and cell image generated using total ion current (magenta). (D) Zoomed-in region of mass spectrum showing [15N]AICAR peak from the selected pixels within the cell boundary with AICAR signal/noise ratio above 30%. (E) Spatial distribution of the labeled AICAR pixels after applying the signal cutoff. (F) Total number of [15N]AICAR pixels per cell obtained from three independent biological replicates. (G) Comparison of level of 15N enrichment in the DNPB intermediate AICAR and the end-product nucleotides AMP, GTP, and ATP for the [15N]AICAR pixels and equivalent numbers of random pixels selected from across the cell. Error bar corresponds to the variation observed for each layer analyzed for a sample. The ratio of total signal intensity for the unique peak corresponding to the isotope-enriched (15N-labeled) and the respective unlabeled (12C) molecule of interest was determined for each layer using Δm/z = 0.02, centered at the expected exact mass corresponding to the molecular ions of interest. **P < 0.005. Inset: In each layer analyzed, the ratio of [15N]ATP/[12C]ATP in the [15N]AICAR pixels was consistently found to be higher than that in the random pixels selected from the whole cell. (H) In the HeLa cells with ATIC CRISPR-Cas9 knockout (ATIC K/O; deficient in ATIC, one of the de novo pathway enzymes) and in cells grown in purine-rich media, selective 15N enrichment in ATP in the pixels corresponding to [15N]AICAR was not observed upon [15N]Ser supplementation. (I) P− HeLa cells under high Gly concentration were used as a negative control where limited 10-formyl-THF results in diminished purinosome-mediated synthesis and thus leads to low ATP enrichment. [13C]AICAR pixels in the negative control showed no selective labeled ATP enrichment. MSI and statistical analysis were performed on at least three independent biological replicates.

Comment in

References

    1. Villa E, Ali ES, Sahu U, Ben-Sahra I, Cancers 11, 688 (2019). - PMC - PubMed
    1. Pedley AM, Benkovic SJ, Trends Biochem. Sci. 42, 141–154 (2017). - PMC - PubMed
    1. Buchanan JM, Hartman SC, in Advances in Enzymology and Related Areas of Molecular Biology, Vol. 21, Nord FF, Ed. (Wiley, 1959), pp. 199–261.
    1. Hartman SC, Buchanan JM, Annu. Rev. Biochem. 28, 365–410 (1959). - PubMed
    1. Greenberg GR, Jaenicke L, in CIBA Foundation Symposium on the Chemistry and Biology Of Purines, Wolstenholme GEW, O’Connor CM, Eds. (Wiley, 1957), pp. 204–232.

Publication types