. 2020 May 5;117(18):9981-9990.
doi: 10.1073/pnas.1917034117. Epub 2020 Apr 16.

A minor population of macrophage-tropic HIV-1 variants is identified in recrudescing viremia following analytic treatment interruption

Affiliations

A minor population of macrophage-tropic HIV-1 variants is identified in recrudescing viremia following analytic treatment interruption

Viviane M Andrade et al. Proc Natl Acad Sci U S A. .

Abstract

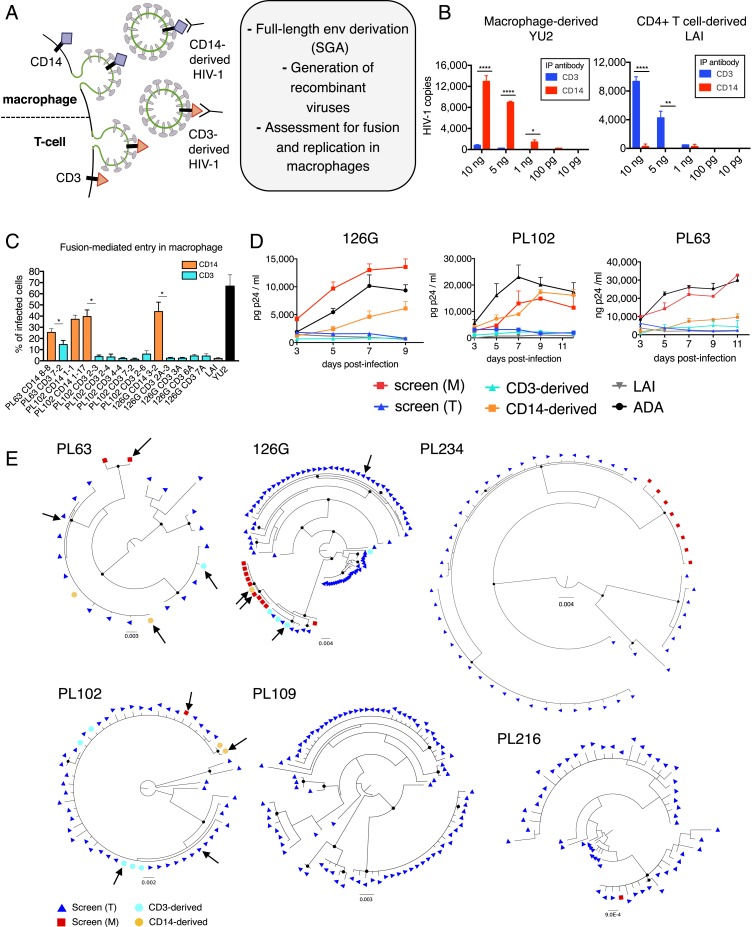
HIV-1 persists in cellular reservoirs that can reignite viremia if antiretroviral therapy (ART) is interrupted. Therefore, insight into the nature of those reservoirs may be revealed from the composition of recrudescing viremia following treatment cessation. A minor population of macrophage-tropic (M-tropic) viruses was identified in a library of recombinant viruses constructed with individual envelope genes that were obtained from plasma of six individuals undergoing analytic treatment interruption (ATI). M-tropic viruses could also be enriched from post-ATI plasma using macrophage-specific (CD14) but not CD4+ T cell-specific (CD3) antibodies, suggesting that M-tropic viruses had a macrophage origin. Molecular clock analysis indicated that the establishment of M-tropic HIV-1 variants predated ATI. Collectively, these data suggest that macrophages are a viral reservoir in HIV-1-infected individuals on effective ART and that M-tropic variants can appear in rebounding viremia when treatment is interrupted. These findings have implications for the design of curative strategies for HIV-1.

Keywords: HIV-1 reservoirs; analytical treatment interruption; macrophages.


Conflict of interest statement

The authors declare no competing interest.

Figures

Fig. 1.
Fig. 1.
Macrophage-adapted HIV-1 envelopes populate post-ATI viremia. (A) Schematic representation of the strategy for isolation of HIV-1 envelopes from plasma and construction of recombinant HIV-1 clones harboring envelopes from post-ATI viremia and laboratory controls (LAI, 4013P, ADA, and YU2). (B) Assessment of HIV-1 fusogenicity for primary macrophages. Data from ref. , which assesses hydrolyzation of CCF2 by an encapsidated β-lactamase. Hydrolyzed (indicative of fusion) and nonhydrolyzed CCF2-AM are distinguished by examination of infected cells at 450 nm. (C) Fusogenic capacities of macrophage and T-cell adapted laboratory controls on primary macrophages. Highly M-tropic controls (YU2, ADA) are displayed as blue bars and T-tropic controls (LAI, 4013P) are in red. Bars are representative of at least 47 independent macrophage donors. Error is displayed as mean ± SD, ****P < 0.0001 (two-tailed unpaired t test). Images are representative fields of each of the controls. (D) Fusogenicities of post-ATI–derived patient envelopes for macrophages. Fusion capacity in macrophages was assessed for ∼500 recombinant viruses from six subjects undergoing ATI (D, Left). Representative recombinants exhibiting high (greater than 50% macrophages with hydrolyzed CCF2-AM), intermediate (20 to 50%), and low (<20%) macrophage fusogenicity are indicated for each subject. Representative microscopic images for viruses designated H, I, and L are shown (D, Right). Frequencies of cells harboring hydrolyzed CCF2-AM were quantified as number of blue/total cells using ImageJ version 1.49u. Each dataset represents the mean of three independent macrophage preparations from independent donors. Graph is shown as mean ± SEM, ***P < 0.0005, ****P < 0.0001 (two-tailed Kruskal–Wallis multiple comparison). (Scale bars, 100 μm.)
Fig. 2.
Fig. 2.
Post-ATI–derived viral envelopes confer efficient replication capacity in macrophages and display increased CD4 inhibitor sensitivity. (A) Selected recombinant viruses with high (>50% infected macrophages), intermediate (20 to 50%), and low (<20%) capacity for fusing with macrophages were assessed for their ability to undergo spreading infection in these cells. Subject-matched Env-recombinant viruses were used to infect macrophages isolated from three independent donors. Replication was assessed by HIV-1 reverse transcriptase activity in the culture supernatants. Replication curves from subjects PL234, 126G, PL63, and PL102 are shown. Graphs are displayed as mean ± SD. (B) Summary of viral infectivity phenotypes assessed by fusion and replication capacity of recombinant viruses generated from six subjects undergoing ATI. (C) Antibody and CD4 inhibitor sensitivity of LAI, YU2, and recombinant viruses harboring PL234 (red), 126G (dark blue), PL63 (light blue), and PL102 (green) patient-derived envelopes with high (M-tropic) and low (T-tropic) macrophage fusogenicities tested in A. Env-recombinant viruses were exposed to increasing concentrations of soluble CD4 (sCD4), 3BNC117, and b12, in a TZM-bl neutralization assay. T- and M-tropic laboratory-adapted controls LAI and YU2 are also shown. Dashed line indicates highest antibody concentration tested. Error bars are shown as mean ± SEM, *P < 0.05 (two-tailed Mann–Whitney U test).
Fig. 3.
Fig. 3.
HIV-1 envelopes derive from a macrophage source and consist of a genetically diverse, independent reservoir. (A) Rationale for antibody-mediated enrichment of macrophage-adapted virions from post-ATI plasma. Virions in post-ATI plasma were immunoprecipitated with CD14 or CD3 Ab-coupled 2.8-mm epoxy magnetic beads. (B) Levels of enrichment using CD3, CD14, and isotype control antibodies were assessed on virions derived in vitro from macrophages and CD4+ T cells. Total HIV-1 DNA was quantified from immunoprecipitates by RT-PCR. Error bars are representative of two independent experiments. ****P < 0.0001, **P < 0.01, *P < 0.05 (two-way ANOVA, multiple comparison). (C and D) Viral envelopes were generated from genomic viral RNA in immunoprecipitated virions by SGA and used to construct full-length recombinant infectious viruses that were then assessed for (C) fusion and (D) replication capacity in primary macrophages. Fusion and replication capacity of recombinant viruses containing CD14- and CD3-enriched envelopes was assessed in parallel with patient-matched T- and M-tropic recombinant viruses whose envelopes had been derived by direct cloning from raw, post-ATI plasma. (C) Bars represent the mean of four independent replicates (mean ± SD, *P < 0.05; Mann–Whitney U test). (D) Error bars are representative of two (126G, PL63) or three (PL102) independent donor cells. Graphs are displayed as mean ± SEM. (E) Maximum-likelihood phylogenies of HIV-1 env sequences from all subjects sampled from post-ATI plasma. Phylogenetic trees were generated using IQ-TREE software. Arrows indicate representative infectious clones used to evaluate replication in macrophages in D.
Fig. 4.
Fig. 4.
Bayesian phyloanatomy analysis of HIV-1 env sequences from four patients sampled after therapy interruption. Maximum clade credibility trees inferred from HIV-1 env sequences for each patient (PL63, PL234, 126G, and PL102) were scaled in time by enforcing an uncorrelated relaxed molecular clock with prior mean evolutionary rate of 7.53⋅10−3 nt substitutions per site per year (24). Timescale is in days: 0 corresponds to the time of treatment interruption, dpreATI indicates days before ART interruption, and dpostATI days post-ART interruption. Origin of the tropism at ancestors was inferred using an asymmetric phylogeographic diffusion model, implemented in BEAST v1.8.4. Branches and internal nodes are colored according to phenotype (macrophage-tropic, brown; T-tropic, cyan); the most likely phenotype of ancestral nodes/lineages was inferred using an asymmetric phylogeographic diffusion model. Diamonds represent branches supported by posterior probability >0.9, and cyan or brown colors represent probability for the ancestor of being either T-tropic or M-tropic. M-tropic sequences are indicated in red squares, T-tropic in blue triangles, and CD3- or CD14-derived are colored in light blue or yellow circles, respectively.

References

    1. Finzi D., et al. , Identification of a reservoir for HIV-1 in patients on highly active antiretroviral therapy. Science 278, 1295–1300 (1997). - PubMed
    1. Chun T. W., et al. , Early establishment of a pool of latently infected, resting CD4(+) T cells during primary HIV-1 infection. Proc. Natl. Acad. Sci. U.S.A. 95, 8869–8873 (1998). - PMC - PubMed
    1. Ho D. D., Rota T. R., Hirsch M. S., Infection of monocyte/macrophages by human T lymphotropic virus type III. J. Clin. Invest. 77, 1712–1715 (1986). - PMC - PubMed
    1. Koenig S., et al. , Detection of AIDS virus in macrophages in brain tissue from AIDS patients with encephalopathy. Science 233, 1089–1093 (1986). - PubMed
    1. Igarashi T., et al. , Macrophage are the principal reservoir and sustain high virus loads in rhesus macaques after the depletion of CD4+ T cells by a highly pathogenic simian immunodeficiency virus/HIV type 1 chimera (SHIV): Implications for HIV-1 infections of humans. Proc. Natl. Acad. Sci. U.S.A. 98, 658–663 (2001). - PMC - PubMed

Publication types

Substances