

Severe air pollution events not avoided by reduced anthropogenic activities during COVID-19 outbreak
- PMID: 32300261
- PMCID: PMC7151380
- DOI: 10.1016/j.resconrec.2020.104814
Severe air pollution events not avoided by reduced anthropogenic activities during COVID-19 outbreak
Abstract
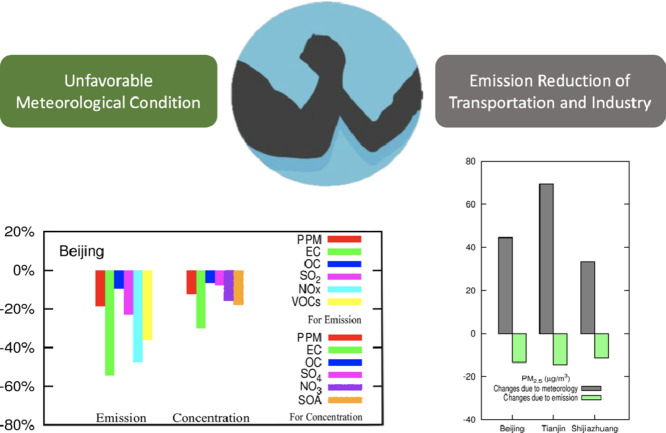
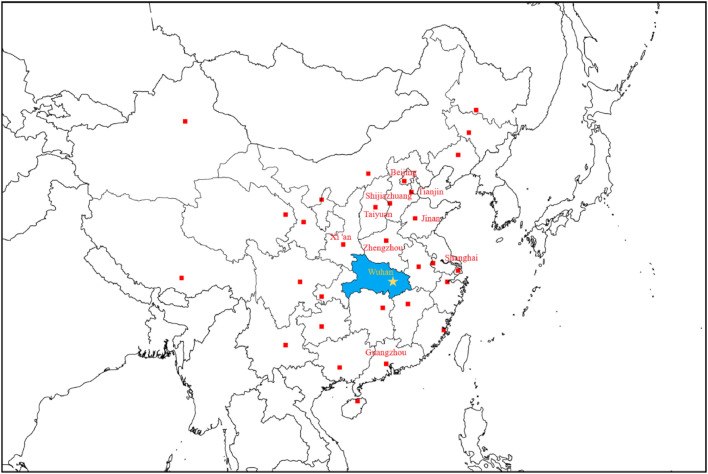
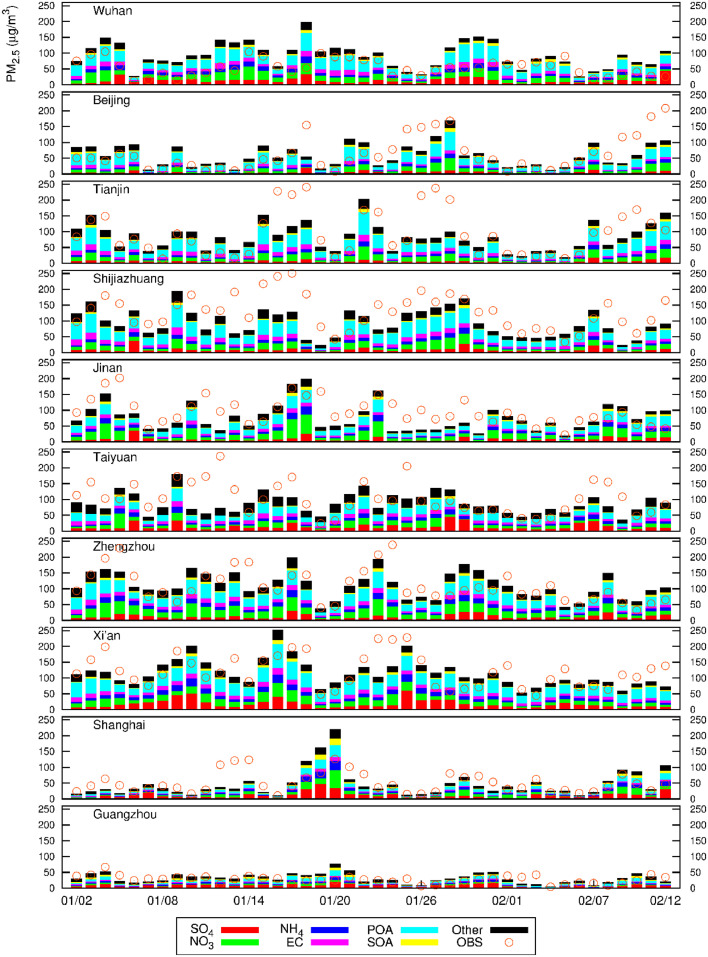
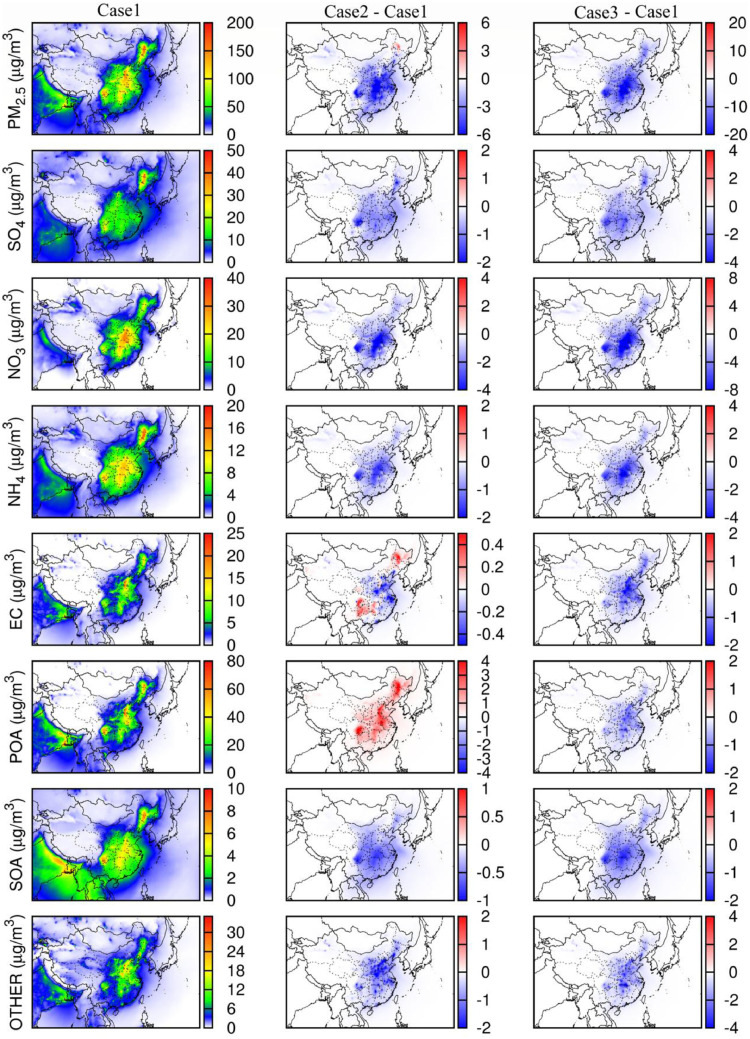
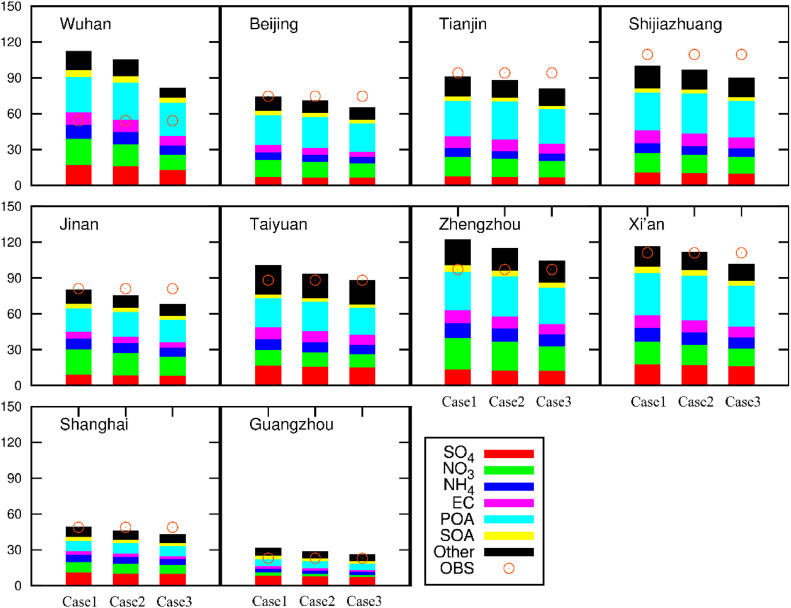
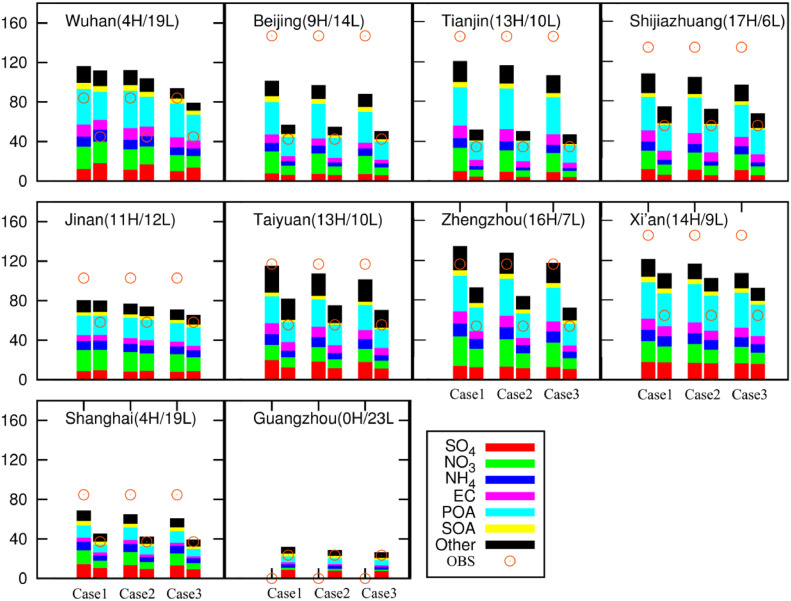
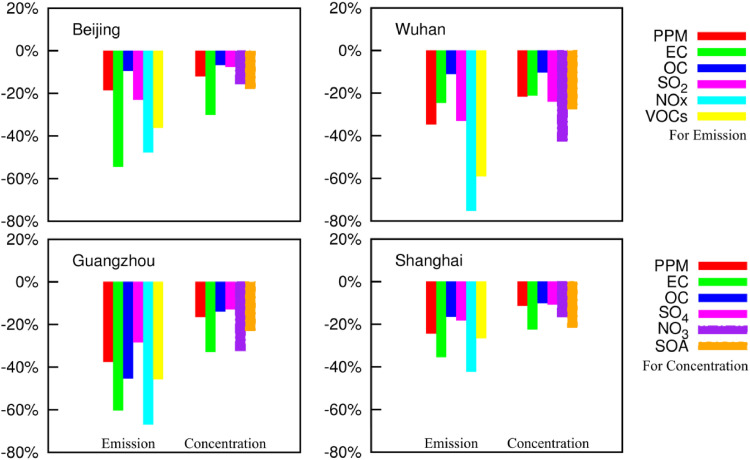
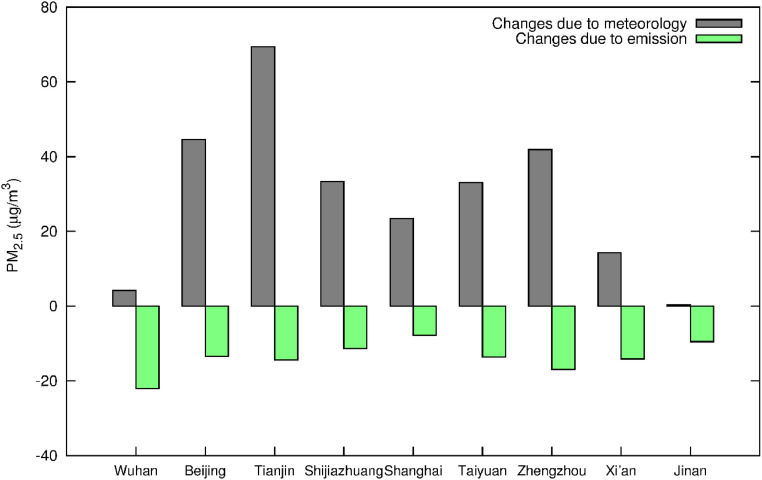
Due to the pandemic of coronavirus disease 2019 in China, almost all avoidable activities in China are prohibited since Wuhan announced lockdown on January 23, 2020. With reduced activities, severe air pollution events still occurred in the North China Plain, causing discussions regarding why severe air pollution was not avoided. The Community Multi-scale Air Quality model was applied during January 01 to February 12, 2020 to study PM2.5 changes under emission reduction scenarios. The estimated emission reduction case (Case 3) better reproduced PM2.5. Compared with the case without emission change (Case 1), Case 3 predicted that PM2.5 concentrations decreased by up to 20% with absolute decreases of 5.35, 6.37, 9.23, 10.25, 10.30, 12.14, 12.75, 14.41, 18.00 and 30.79 μg/m3 in Guangzhou, Shanghai, Beijing, Shijiazhuang, Tianjin, Jinan, Taiyuan, Xi'an, Zhengzhou, Wuhan, respectively. In high-pollution days with PM2.5 greater than 75 μg/m3, the reductions of PM2.5 in Case 3 were 7.78, 9.51, 11.38, 13.42, 13.64, 14.15, 14.42, 16.95 and 22.08 μg/m3 in Shanghai, Jinan, Shijiazhuang, Beijing, Taiyuan, Xi'an, Tianjin, Zhengzhou and Wuhan, respectively. The reductions in emissions of PM2.5 precursors were ~2 times of that in concentrations, indicating that meteorology was unfavorable during simulation episode. A further analysis shows that benefits of emission reductions were overwhelmed by adverse meteorology and severe air pollution events were not avoided. This study highlights that large emissions reduction in transportation and slight reduction in industrial would not help avoid severe air pollution in China, especially when meteorology is unfavorable. More efforts should be made to completely avoid severe air pollution.
Keywords: COVID-19; China; Emission reduction; Meteorology; Severe air pollution.
© 2020 Elsevier B.V. All rights reserved.
Conflict of interest statement
The authors declare that they have no known competing financial interests or personal relationships that could have appeared to influence the work reported in this paper.
Figures
References
-
- Cai S., Wang Y., Zhao B., Wang S., Chang X., Hao J. The impact of the “air pollution prevention and control action plan” on PM2. 5 concentrations in Jing-Jin-Ji region during 2012–2020. Sci. Total Environ. 2017;580:197–209. - PubMed
-
- Cai Z., Jiang F., Chen J., Jiang Z., Wang X. Weather condition dominates regional PM2.5 Pollutions in the Eastern Coastal Provinces of China during Winter. Aerosol Air Qual. Res. 2018;18(4):969–980.
-
- Cao J., Yang C., Li J., Chen R., Chen B., Gu D., Kan H. Association between long-term exposure to outdoor air pollution and mortality in China: a cohort study. J. Hazard. Mater. 2011;186(2-3):1594–1600. - PubMed
-
- CCTV. 2020. [News 30 minutes] Experts interpretation: the recent heavy pollution in Beijing-Tianjin-Hebei and surrounding areas are due to emissions and low environmental capacity. http://app.cctv.com/special/cbox/detail/index.html?guid=795fd7b3734d45a3....
-
- Chai F., Gao J., Chen Z., Wang S., Zhang Y., Zhang J., Zhang H., Yun Y., Ren C. Spatial and temporal variation of particulate matter and gaseous pollutants in 26 cities in China. J. Environ. Sci. 2014;26(1):75–82. - PubMed
LinkOut - more resources
Full Text Sources