. 2020 Apr 2:8:233.
doi: 10.3389/fbioe.2020.00233. eCollection 2020.

Statistical Modeling of Lower Limb Kinetics During Deep Squat and Forward Lunge

Affiliations

Statistical Modeling of Lower Limb Kinetics During Deep Squat and Forward Lunge

Joris De Roeck et al. Front Bioeng Biotechnol. .

Abstract

Purpose: Modern statistics and higher computational power have opened novel possibilities to complex data analysis. While gait has been the utmost described motion in quantitative human motion analysis, descriptions of more challenging movements like the squat or lunge are currently lacking in the literature. The hip and knee joints are exposed to high forces and cause high morbidity and costs. Pre-surgical kinetic data acquisition on a patient-specific anatomy is also scarce in the literature. Studying the normal inter-patient kinetic variability may lead to other comparable studies to initiate more personalized therapies within the orthopedics.

Methods: Trials are performed by 50 healthy young males who were not overweight and approximately of the same age and activity level. Spatial marker trajectories and ground reaction force registrations are imported into the Anybody Modeling System based on subject-specific geometry and the state-of-the-art TLEM 2.0 dataset. Hip and knee joint reaction forces were obtained by a simulation with an inverse dynamics approach. With these forces, a statistical model that accounts for inter-subject variability was created. For this, we applied a principal component analysis in order to enable variance decomposition. This way, noise can be rejected and we still contemplate all waveform data, instead of using deduced spatiotemporal parameters like peak flexion or stride length as done in many gait analyses. In addition, this current paper is, to the authors' knowledge, the first to investigate the generalization of a kinetic model data toward the population.

Results: Average knee reaction forces range up to 7.16 times body weight for the forwarded leg during lunge. Conversely, during squat, the load is evenly distributed. For both motions, a reliable and compact statistical model was created. In the lunge model, the first 12 modes accounts for 95.26% of inter-individual population variance. For the maximal-depth squat, this was 95.69% for the first 14 modes. Model accuracies will increase when including more principal components.

Conclusion: Our model design was proved to be compact, accurate, and reliable. For models aimed at populations covering descriptive studies, the sample size must be at least 50.

Keywords: inverse dynamics; lower limb kinetics; musculoskeletal model; principal component analysis; validation analysis.


Figures

FIGURE 1
FIGURE 1
Overview of data input for the motion capture musculoskeletal simulation model. (A) Motion is performed when standing on two force plates. Motion capture data synchronized with ground reaction forces are exported as .c3d file. (B) Twenty-eight reflective markers are placed on anatomical bony landmarks. A MRI scan of the full lower limb is performed. Segmentation of pelvis, thigh, and shank with corresponding positions of marker landscape. (C) Motion capture squat model. Anybody squat (D) and lunge (E) model.
FIGURE 2
FIGURE 2
Scree plot with the cumulative variance of the modes (or principal components) in the lunge (orange) and squat (purple) kinetic model.
FIGURE 3
FIGURE 3
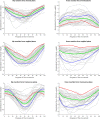
Relation between the kinetic waveform simulation output and the squat progress for each individual sample in gray. Mean values of the measurements in green ±2 standard deviations of the first mode in red and blue. The first mode accounts for 33.80% of the inter-subject population variance. Note the different y axis calibrations.
FIGURE 4
FIGURE 4
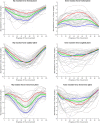
Mean values of joint reaction forces during deep squatting in green ±2 standard deviations of the second mode in red and blue. The second mode accounts for 14.05% of the inter-subject population variance.
FIGURE 5
FIGURE 5
Mean values of joint reaction forces during deep squatting in green ±2 standard deviations of the third mode in red and blue. The third mode accounts for 11.88% of the inter-subject population variance.
FIGURE 6
FIGURE 6
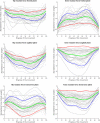
Mean values of joint reaction forces during lunging in green ±2 standard deviations of the first mode in red and blue. The first mode accounts for 40.87% of the inter-subject population variance.
FIGURE 7
FIGURE 7
Mean values of joint reaction forces during lunging in green ±2 standard deviations of the second mode in red and blue. The second mode accounts for 15.07% of the inter-subject population variance.
FIGURE 8
FIGURE 8
Mean values of joint reaction forces during lunging in green ±2 standard deviations of the third mode in red and blue. The third mode accounts for 10.46% of the inter-subject population variance.
FIGURE 9
FIGURE 9
RMSE for the original squat training data versus reconstructed squat data with an increasing number of principal components on the x axis.
FIGURE 10
FIGURE 10
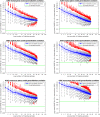
Accuracy evolution of kinetic lunge data with log–log scaling (boxplot with root-mean-square error of the reconstructed data with 95% variance versus the original training data) for different levels of prior knowledge expressed as amounts of training data in a kinetic model. The green horizontal line indicates the in-sample target accuracy.

References

    1. Almeida D. F., Ruben R. B., Folgado J., Fernandes P. R., Audenaert E., Verhegghe B., et al. (2016). Fully automatic segmentation of femurs with medullary canal definition in high and in low resolution CT scans. Med. Eng. Phys. 38 1474–1480. 10.1016/j.medengphy.2016.09.019 - DOI - PubMed
    1. Audenaert E. A., Pattyn C., Steenackers G., De Roeck J., Vandermeulen D., Claes P. (2019). Statistical shape modelling of skeletal anatomy for sex discrimination: their training size, sexual dimorphism and asymmetry. Front. Bioeng. Biotechnol. 7:302. 10.3389/fbioe.2019.00302 - DOI - PMC - PubMed
    1. Audenaert E. A., Peeters I., Vigneron L., Baelde N., Pattyn C. (2012). Hip morphological characteristics and range of internal rotation in femoroacetabular impingement. Am. J. Sports Med. 40 1329–1336. 10.1177/0363546512441328 - DOI - PubMed
    1. Bagwell J. J., Snibbe J., Gerhardt M., Powers C. M. (2016). Hip kinematics and kinetics in persons with and without cam femoroacetabular impingement during a deep squat task. Clin. Biomech. 31 87–92. 10.1016/j.clinbiomech.2015.09.016 - DOI - PubMed
    1. Benedetti M. G., Catani F., Bilotta T. W., Marcacci M., Mariani E., Giannini S. (2003). Muscle activation pattern and gait biomechanics after total knee replacement. Clin. Biomech. 18 871–876. 10.1016/s0268-0033(03)00146-3 - DOI - PubMed

LinkOut - more resources