Review
. 2020 Apr 30;56(34):4627-4639.
doi: 10.1039/d0cc01551b. Epub 2020 Apr 17.

High-resolution probing of early events in amyloid-β aggregation related to Alzheimer's disease

Affiliations
Review

High-resolution probing of early events in amyloid-β aggregation related to Alzheimer's disease

Bikash R Sahoo et al. Chem Commun (Camb). .

Abstract

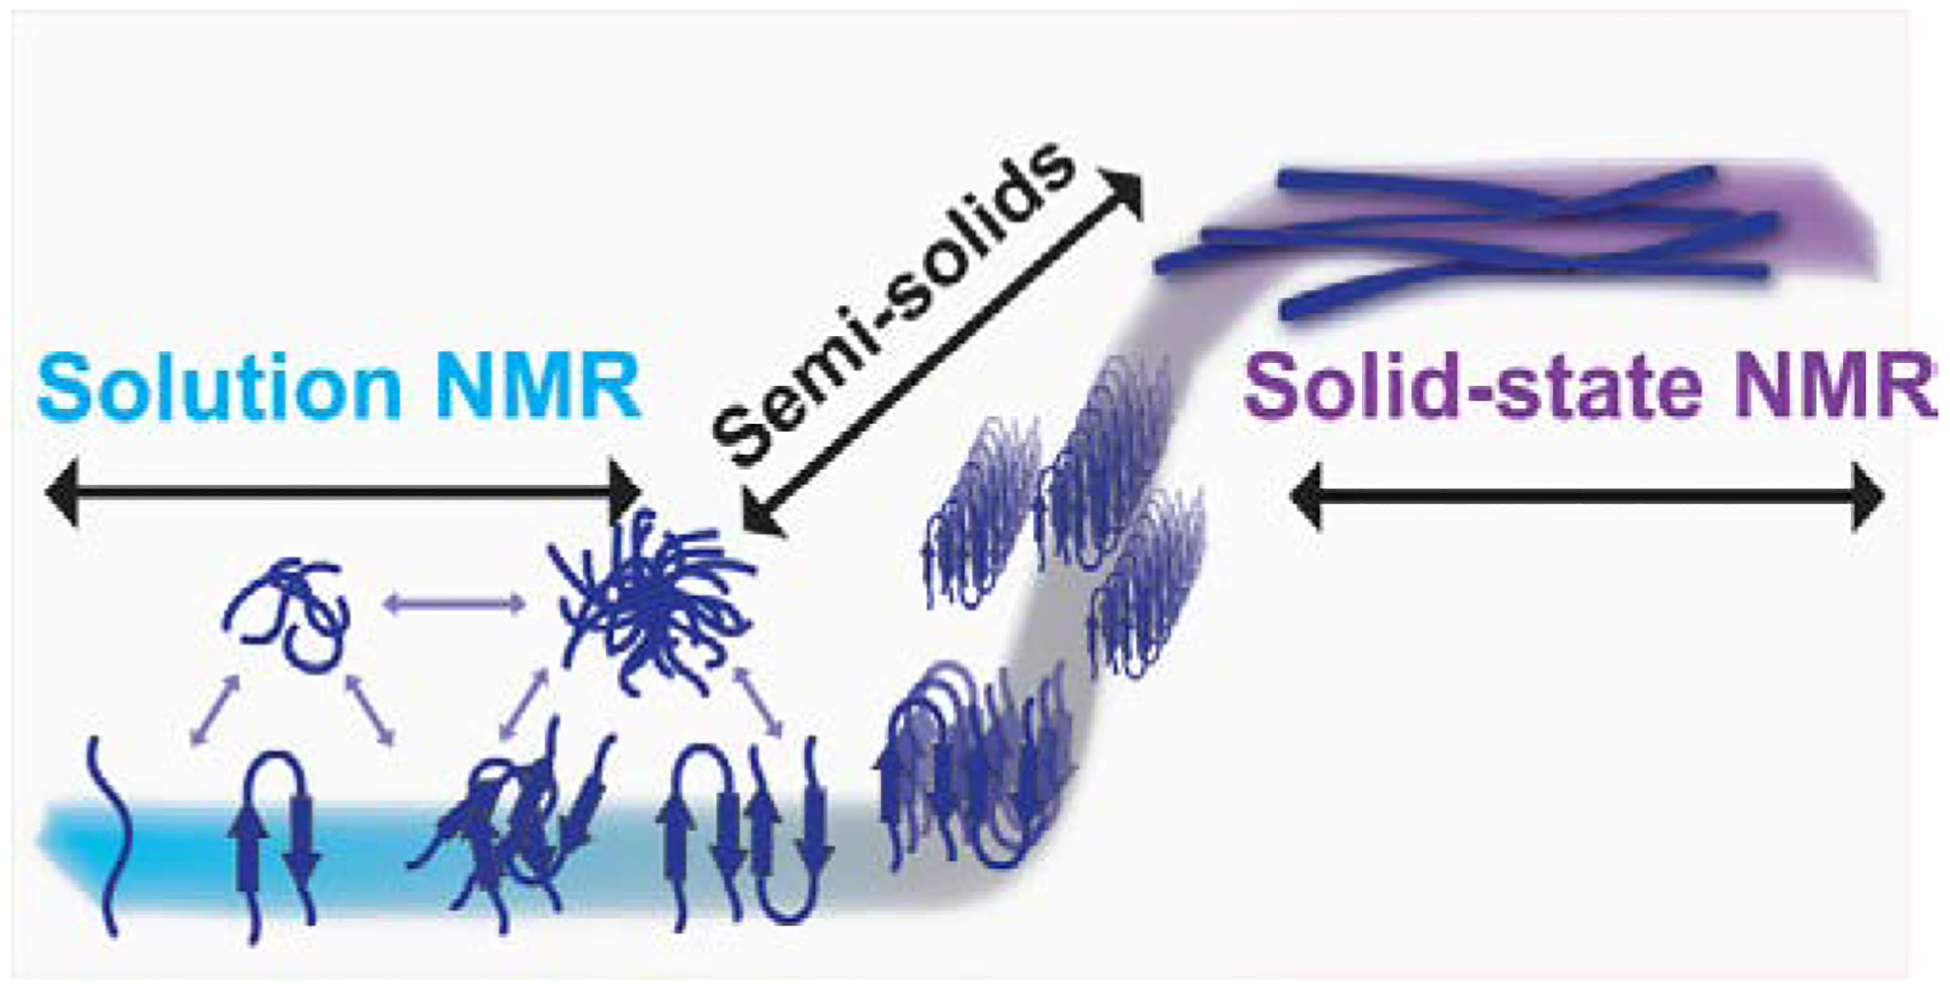
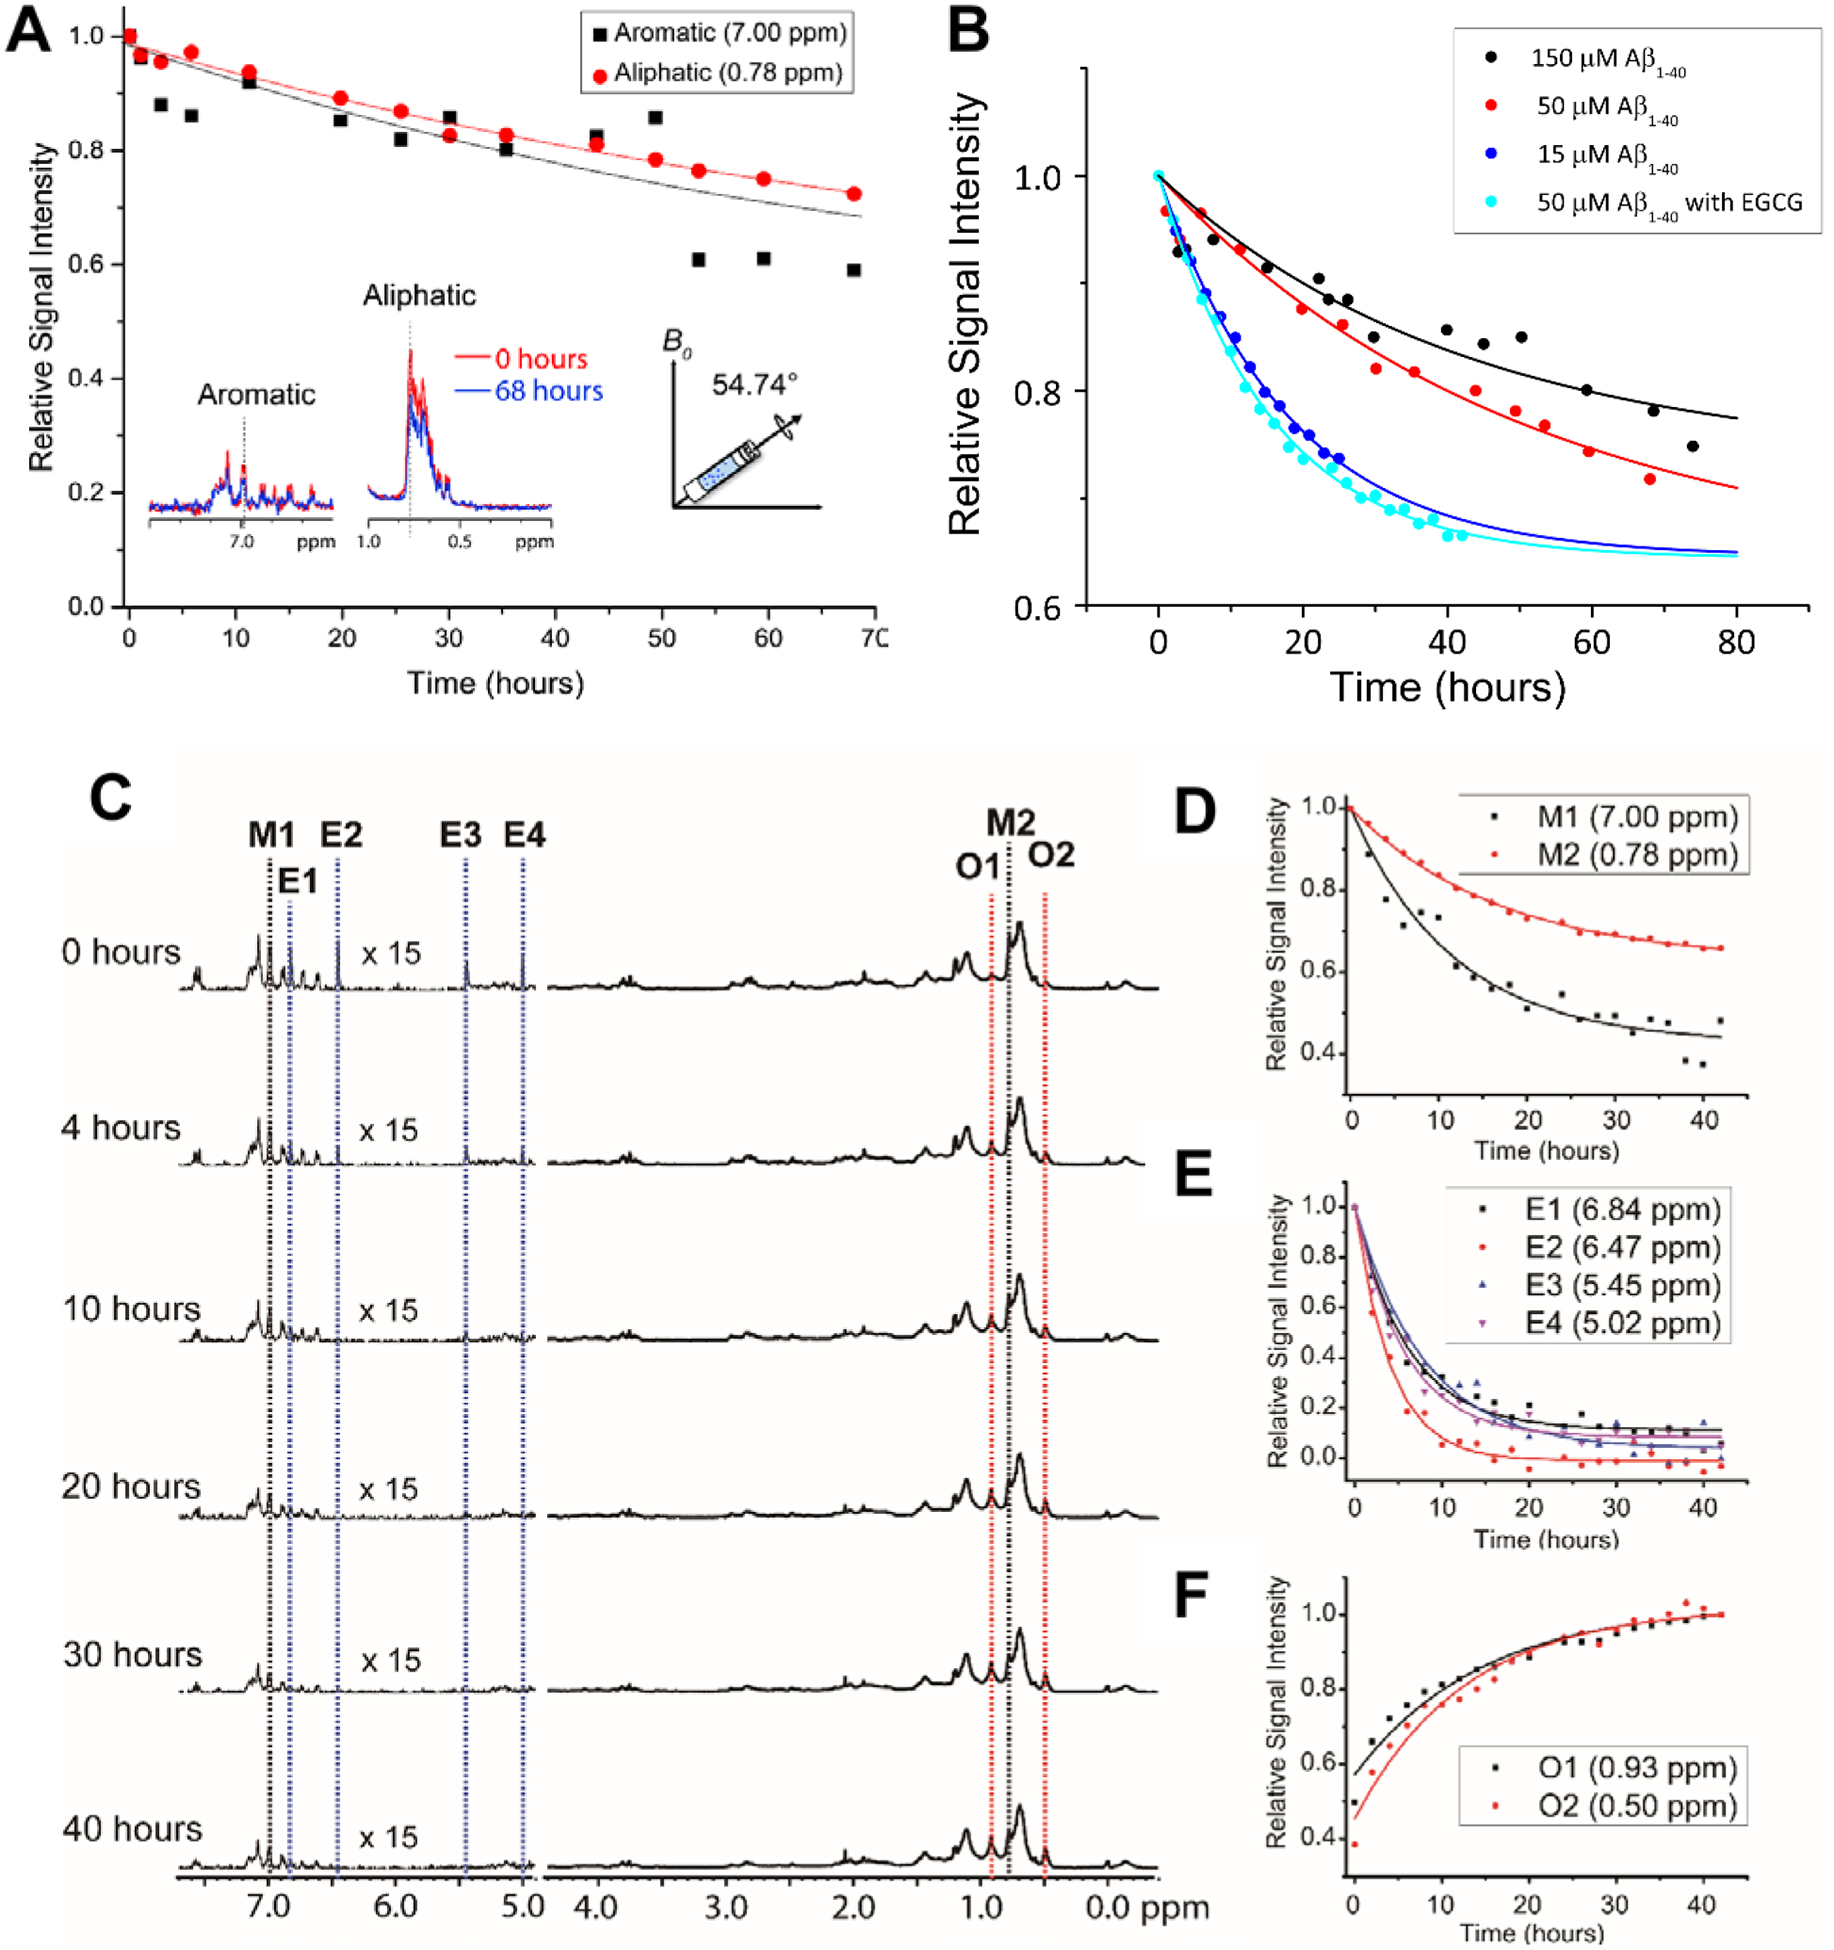
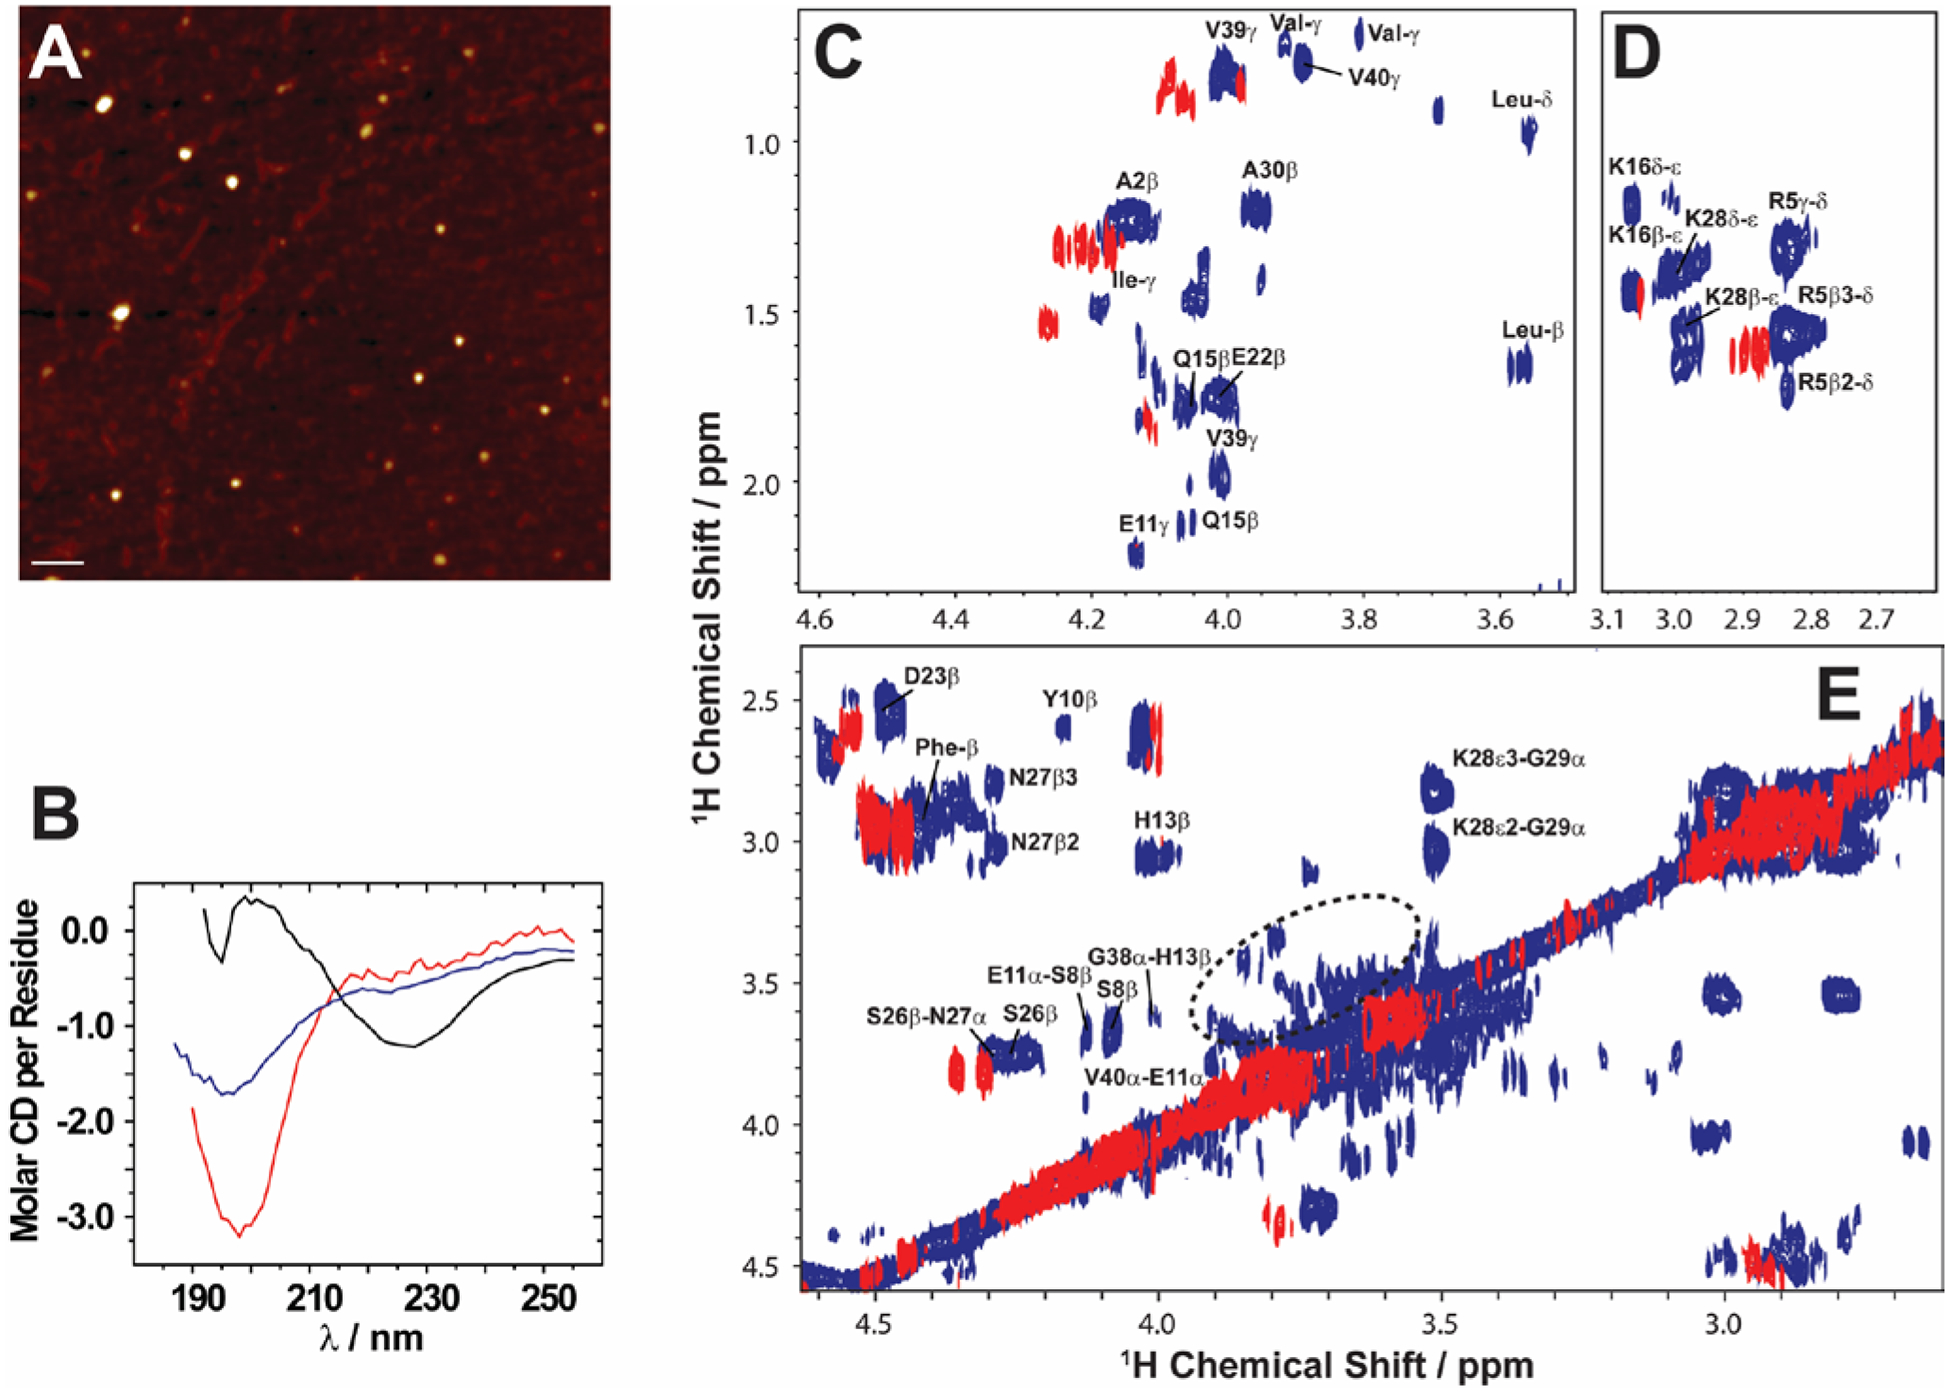
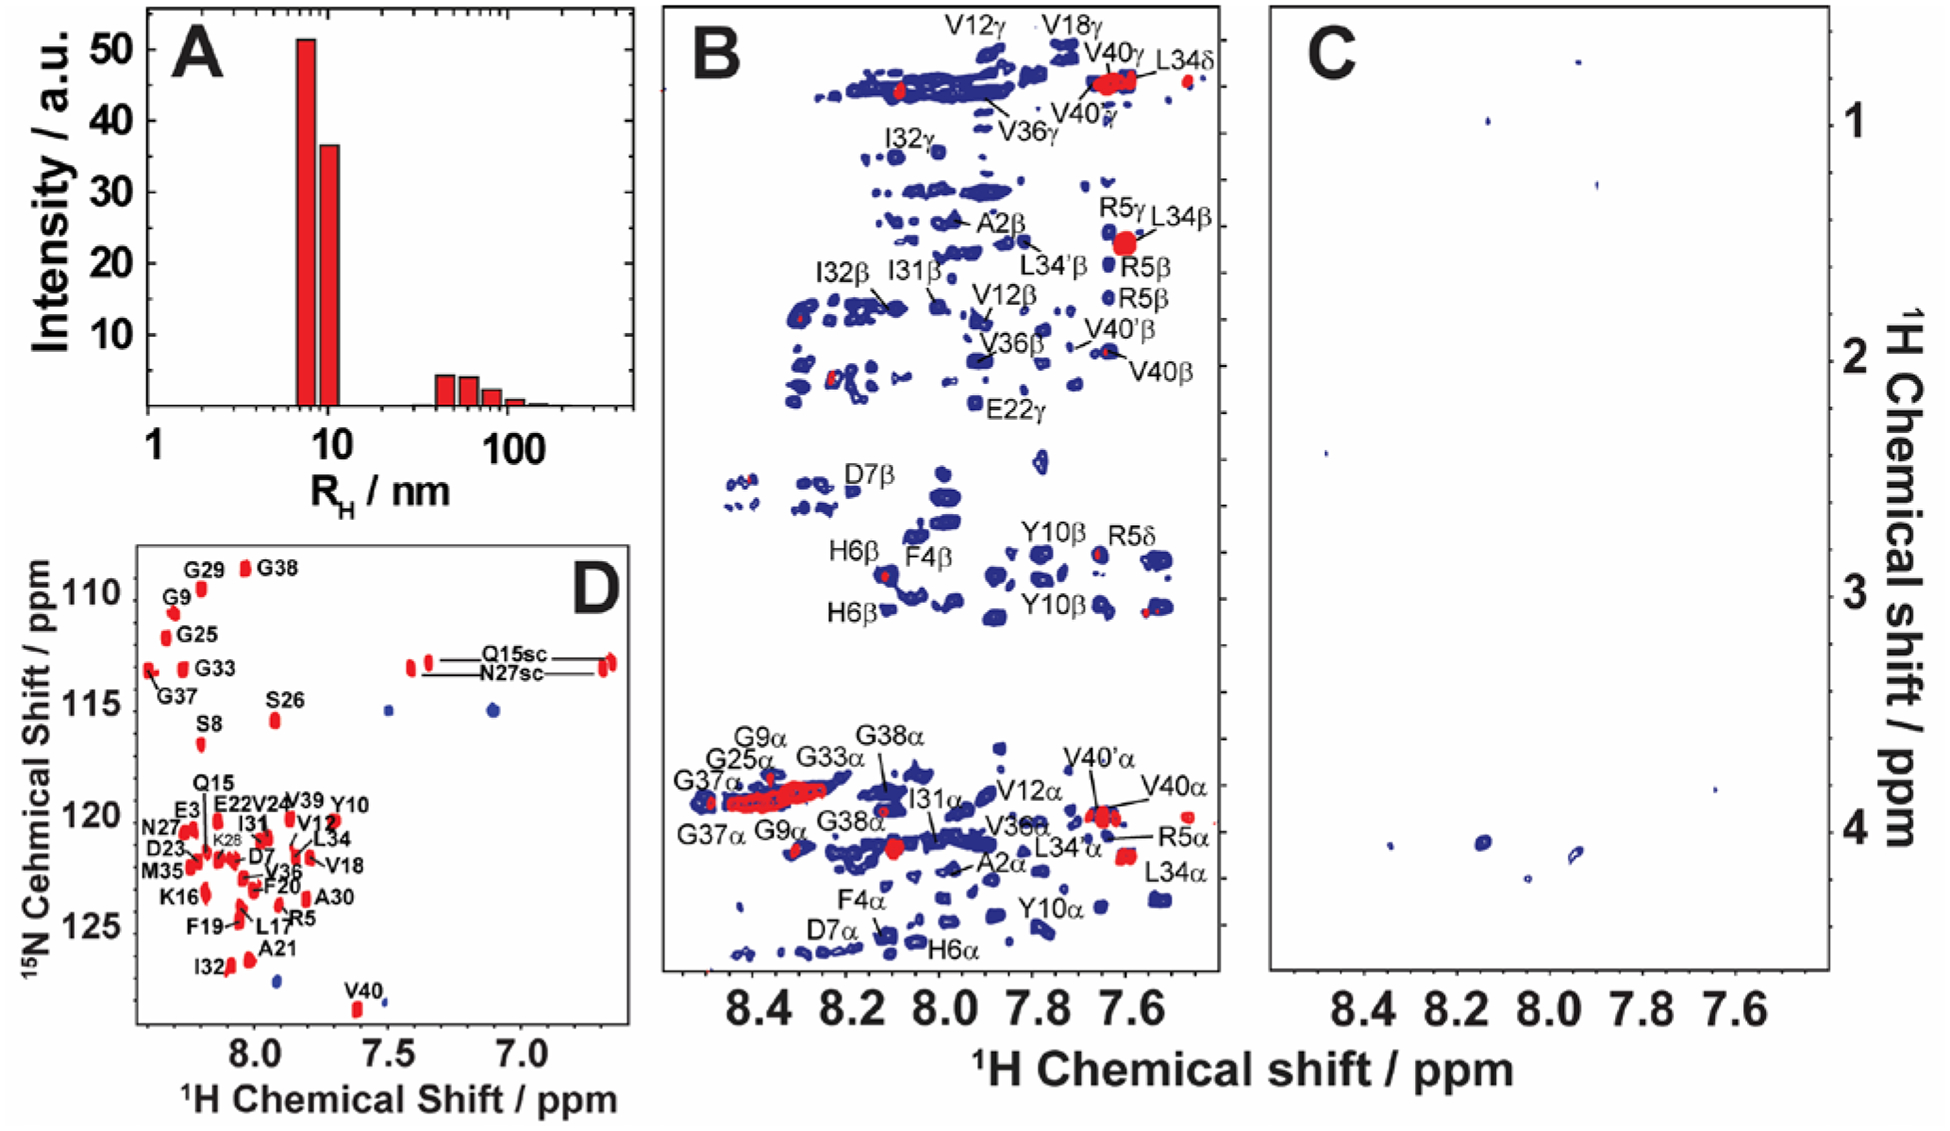
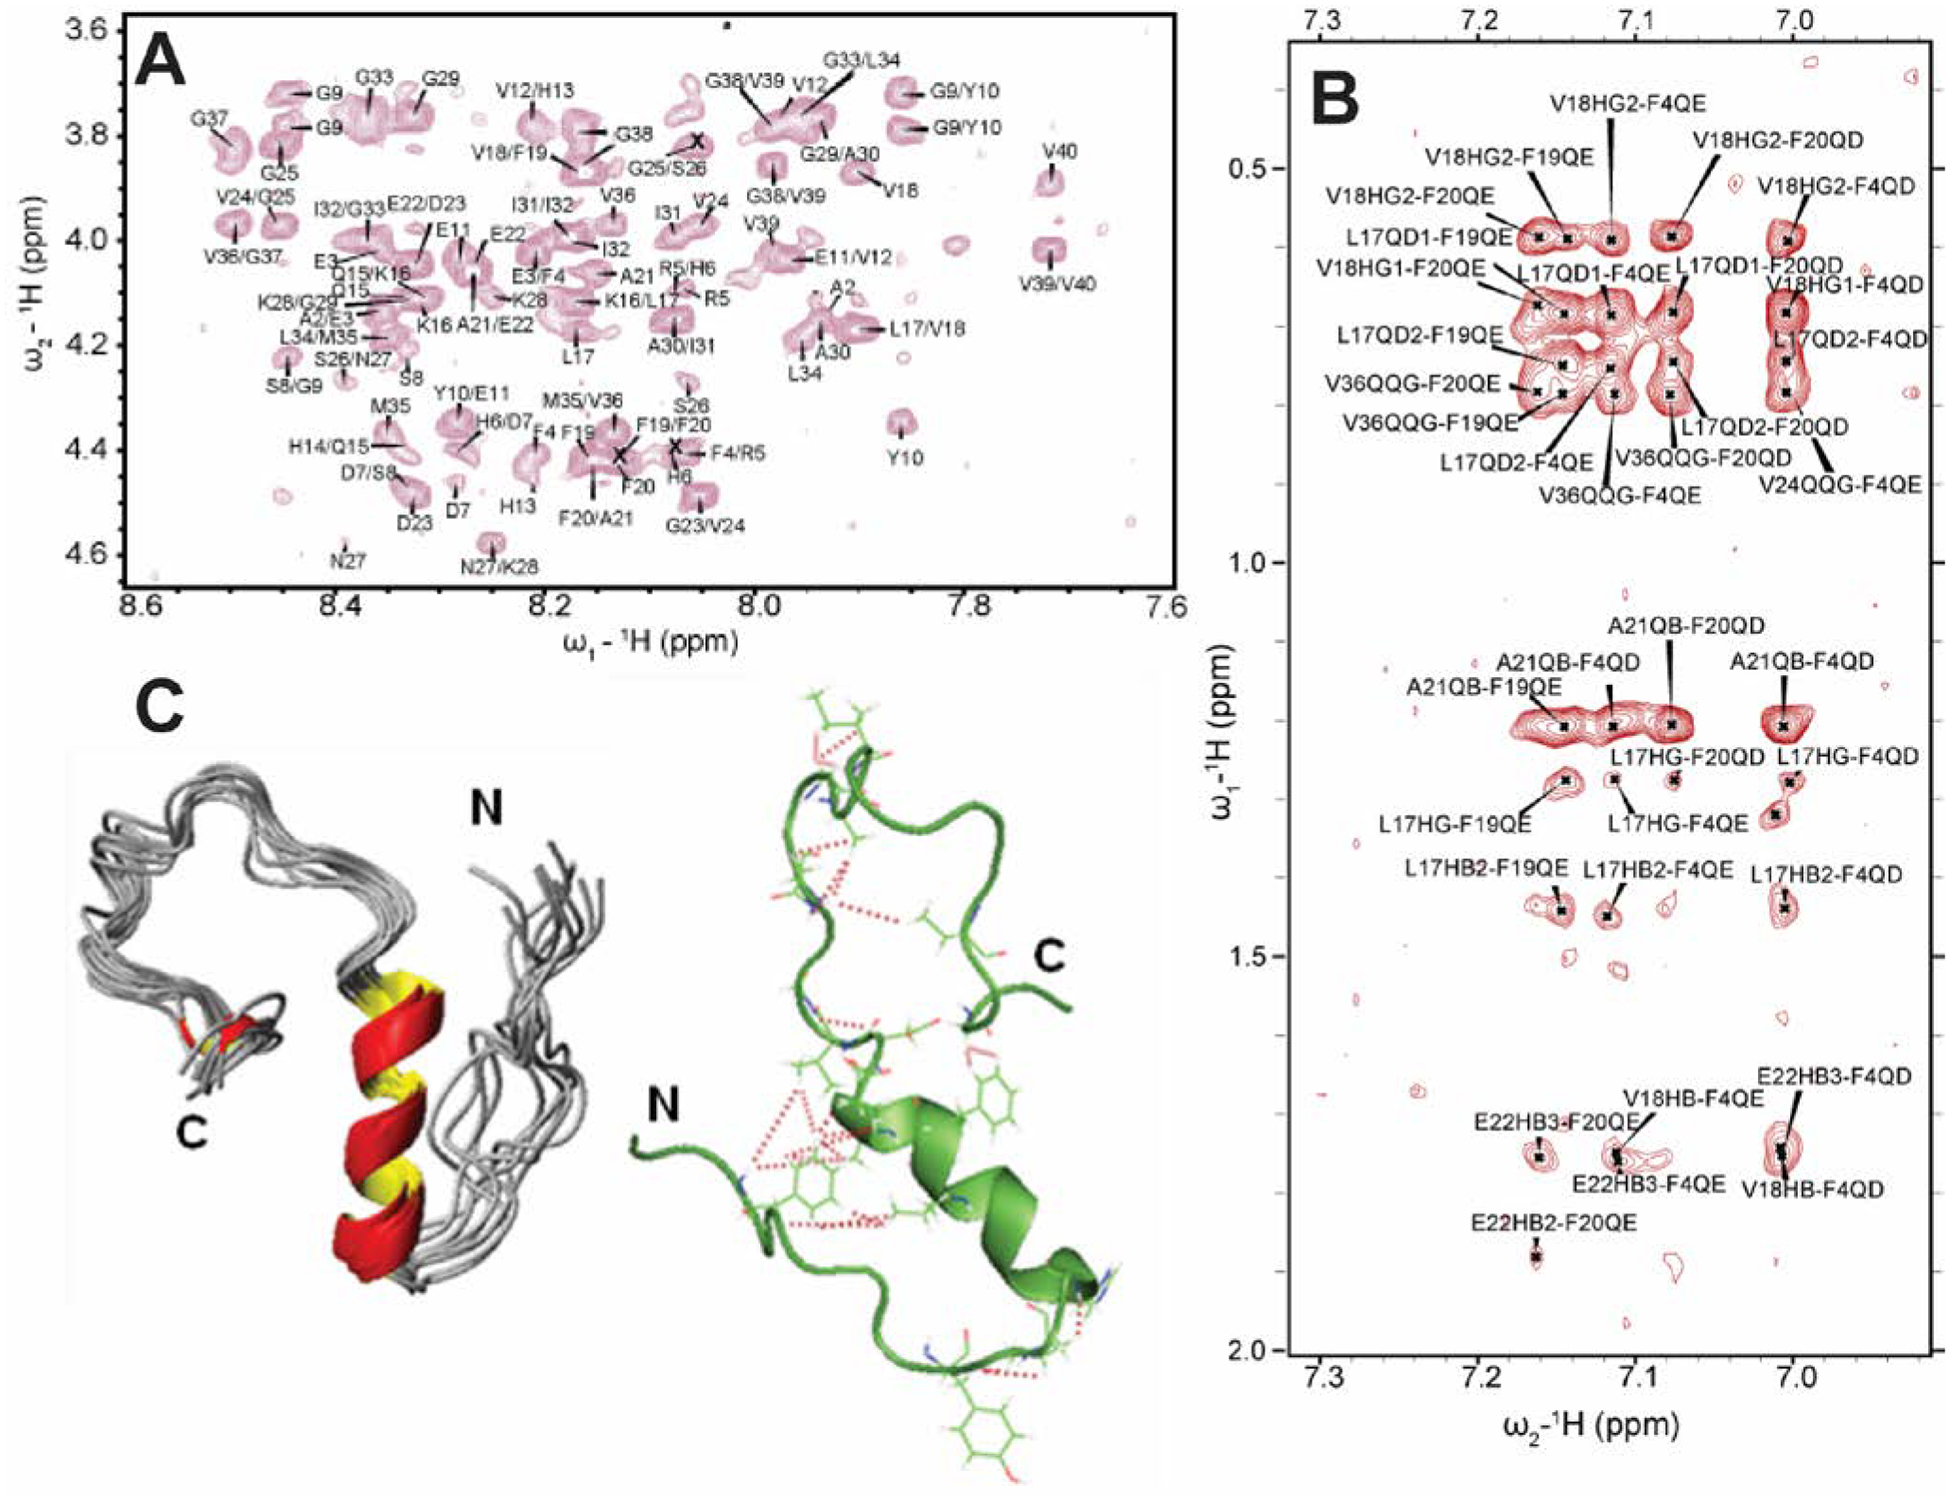
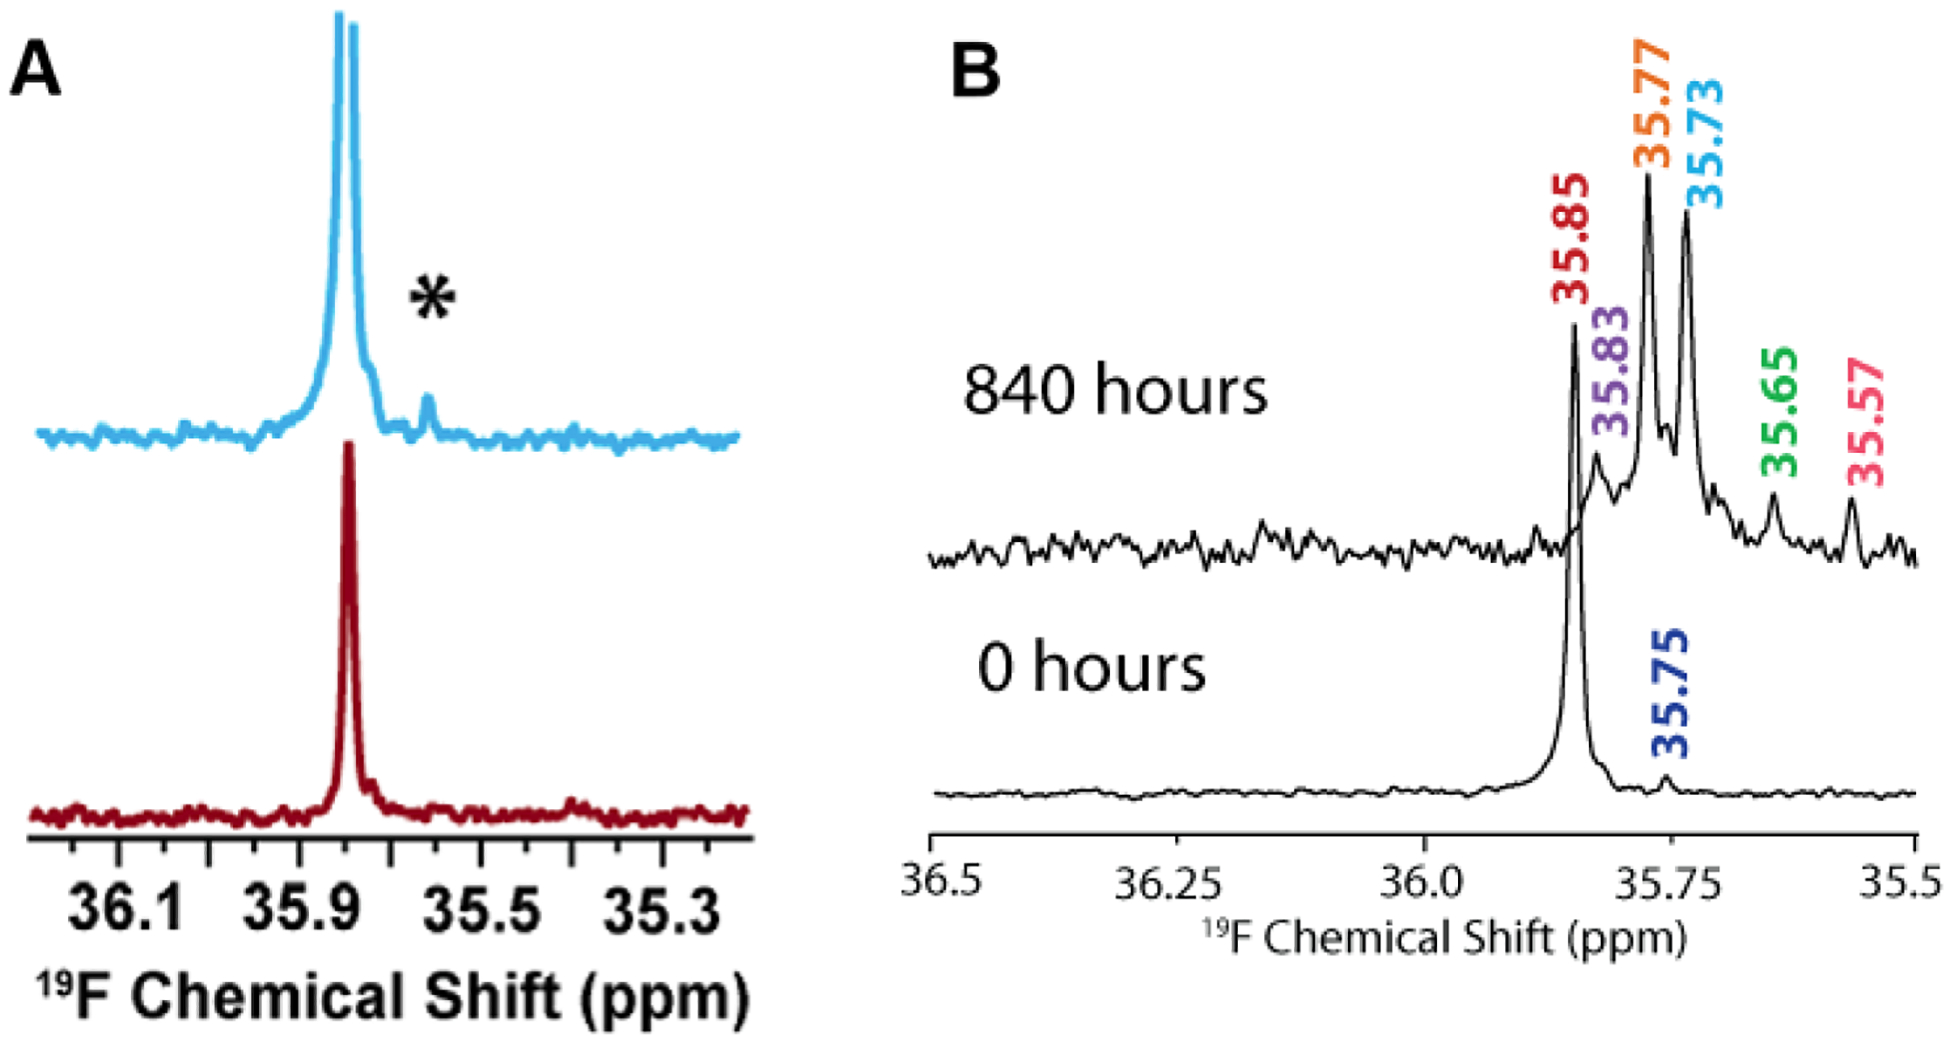
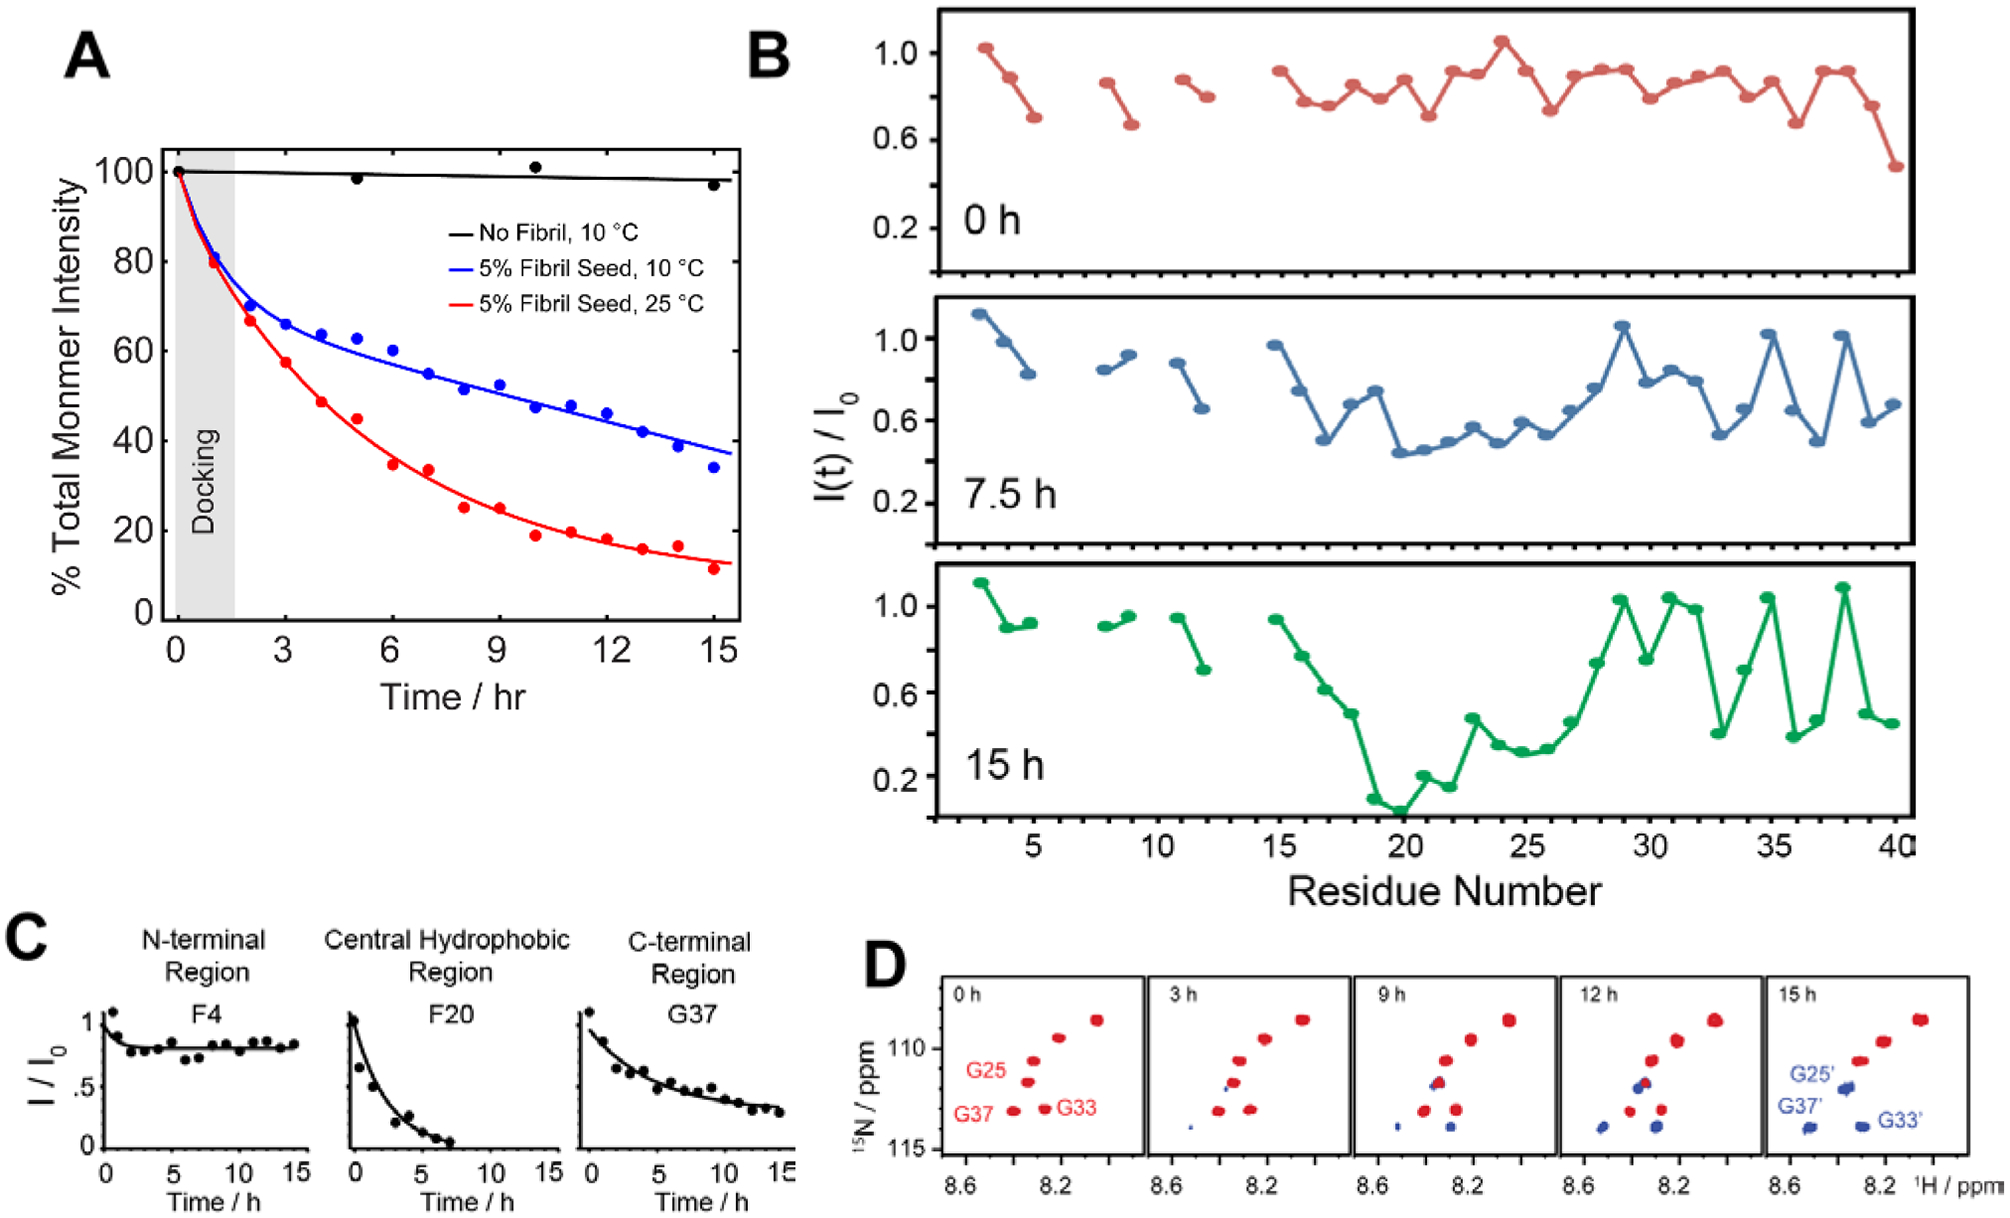
In Alzheimer's disease (AD), soluble oligomers of amyloid-β (Aβ) are emerging as a crucial entity in driving disease progression as compared to insoluble amyloid deposits. The lacuna in establishing the structure to function relationship for Aβ oligomers prevents the development of an effective treatment for AD. While the transient and heterogeneous properties of Aβ oligomers impose many challenges for structural investigation, an effective use of a combination of NMR techniques has successfully identified and characterized them at atomic-resolution. Here, we review the successful utilization of solution and solid-state NMR techniques to probe the aggregation and structures of small and large oligomers of Aβ. Biophysical studies utilizing the commonly used solution and 19F based NMR experiments to identify the formation of small size early intermediates and to obtain their structures, and dock-lock mechanism of fiber growth at atomic-resolution are discussed. In addition, the use of proton-detected magic angle spinning (MAS) solid-state NMR experiments to obtain high-resolution insights into the aggregation pathways and structures of large oligomers and other aggregates is also presented. We expect these NMR based studies to be valuable for real-time monitoring of the depletion of monomers and the formation of toxic oligomers and high-order aggregates under a variety of conditions, and to solve the high-resolution structures of small and large size oligomers for most amyloid proteins, and therefore to develop inhibitors and drugs.


Conflict of interest statement

Conflicts of interest

There are no conflicts to declare.

Figures

Fig. 1.
Fig. 1.. Detection of amyloid species by NMR.
Solution NMR spectroscopy is well suited for high-resolution structural and dynamical studies of fast tumbling monomers and small molecular weight amyloid species like oligomers formed in the early lag phase (blue). On the other hand, magic-angle spinning (MAS) solid-state NMR techniques can be used to investigate the high-resolution structures of anisotropic, larger aggregates such as large oligomers, protofibers and fibers (purple). In addition, as discussed in the main text, semi-solids that are not isotropic such as small to large size oligomers can also be investigated using high-resolution magic angle spinning (HR-MAS) experiments. Use of a combination of solution and solid-state NMR experiments and peptides judiciously labelled with isotopes (13C, 15N, 2H, 19F or a combination of them) can provide piercing atomic-resolution insights into the self-assembly process of amyloid aggregation, the formation of toxic oligomers, polymorphism of fibers and the dynamic exchange among the different species.
Fig. 2.
Fig. 2.
Effect of MAS on the aggregation kinetics of Aβ1–40. (A) Depletion in Aβ1–40 monomer population under MAS (5 kHz MAS at 298K) as indicated by the decay of 1H NMR signal intensity for selected aliphatic and aromatic resonances of freshly prepared 50 μM Aβ1–40 as a function of time (time=0 refers the data acquired in <10 minutes from the sample preparation). (B) Relative 1H NMR signal intensity decay of methyl resonance (0.78 ppm) under 5 kHz MAS as a function of Aβ1–40 monomer concentration in the absence or presence of EGCG. The curves were fitted using the equation y=(1-A)*exp(−b*x)+A, where A is the proportion that remains as monomer after saturation and b is the rate of decay or aggregation. (C) The polyphenolic EGCG compound promotes Aβ1–40 aggregation (50 μM) under MAS (under 5 kHz MAS and 298K) as observed from the decay of 1H NMR signal as a function of time. (D–F) The aromatic 1H signals decay faster as compared to aliphatic protons in Aβ1–40 (50 μM) in the presence of EGCG indicating the role of predominant π-π interactions. The aromatic proton signals of EGCG also show a rapid depletion in intensity (D) indicating a strong interaction with Aβ1–40. (E) The appearance of new peaks O1 and O2 indicates the formation of new oligomer species. An increase in the oligomer populations over time is revealed by an increasing 1H signal intensities O1 and O2 species. This figure is reproduced with permission from the Royal Society of Chemistry (https://doi.org/10.1039/C8CC00167G). Further details can be found in the referenced work.
Fig. 3.
Fig. 3.
Solid state NMR allows characterization of growing low abundance Aβ1–40 oligomers. (A) AFM image showing the presence of Aβ1–40 oligomers (left) after separation from fibers after 4 days (scale bar is 100 nm). (B) CD spectra show that the filtered Aβ1–40 oligomers (blue) are disordered, similar to the freshly dissolved monomers (red), and differ from the β-sheet rich fibers (black). (C–E) 2D 1H/1H NMR spectra obtained via RFDR recoupling of 1H-1H dipolar couplings show high-resolution cross-peaks for oligomers (blue) and freshly dissolved Aβ1–40 monomers (red); spectra recorded at 25 °C under 2.7 kHz MAS on a 600 MHz solid-state NMR spectrometer. The spectrum highlights the observation of cross-peaks due to the recoupled 1H-1H dipolar couplings for (C) side-chain to Hα, (D) side-chain, and (E) Hβ-Hα and Hα-Hα regions. The acquisition time was 4 days. The 2.7 kHz MAS and RFDR mixing enabled the suppression of signals from monomers and fibers and selective observation of low molecular weight oligomers in a non-perturbative manner. The NMR samples were prepared in 10 mM phosphate buffer, pH 7.4, and 10% D2O. Copyright © 2015, Springer Nature. This figure is reproduced from Scientific Reports: https://doi.org/10.1038/srep11811. Further details can be found in the referenced work.
Fig. 4.
Fig. 4.
Monitoring time-lapse growth of Aβ1–40 oligomers by NMR. (A) Dynamic light scattering reveals the growth of Aβ1–40 oligomers from 8.6 nm and 65.3 nm over the course of 19 days. 2D TOCSY (B) and 2D NOESY (C) spectra of the disordered Aβ1–40 oligomers recorded at 4 days (blue) and 19 days (red). Both TOCSY and NOESY spectra show line-broadening on day-19 indicating the growth of oligomer size that are beyond the detection limit of solution NMR. (D) 2D 1H/15N HSQC spectra of the freshly dissolved (red) Aβ1–40 recorded on a 900 MHz NMR spectrometer show well resolved NMR peaks. In contrast, 1H/15N HSQC spectra of the filtered disordered oligomers (blue) obtained after 4 days show substantial line broadening. The NMR samples were prepared in 10 mM phosphate buffer, pH 7.4, and 10% D2O and NMR spectra were recorded at 25 °C. Copyright © 2015, Springer Nature. This figure is reproduced from Scientific Reports: https://doi.org/10.1038/srep11811. Further details can be found in the referenced study.
Fig. 5.
Fig. 5.
3D structure of a small molecular weight Aβ1–40 oligomer determined by solution NMR. (A) 2D NOESY spectrum of 77 μM Aβ1–40 dissolved in 20 mM potassium phosphate, 50 mM NaCl, pH 7.3 containing 93% H2O and 7% D2O recorded at 15 °C on a 900 MHz NMR spectrometer. The selected regions show NOEs that corresponds to the sequential assignment of Hαi-NHi+1. (B) The aromatic region of the NOESY spectrum showing cross-peaks between F19 and F20 residues, the C-terminus and F4 residue, and the central helical region of the peptide. (C) 3D NMR structures of Aβ1–40 calculated from NOEs and backbone dihedral angle restraints. The cartoon structure shown on the right in green shows the long-range NOEs that stabilizes the formation of the hairpin structure and the bends in the N- and C-termini (red dashed lines). Copyright © 2011 Elsevier Inc. This figure is reproduced with permission from Biochemical and Biophysical Research Communications: https://doi.org/10.1016/j.bbrc.2011.06.133. Further details can be found in the published article.
Fig. 6.
Fig. 6.
(A) Characterization of Aβ1–40 oligomers using 19F NMR. Fluorinated Aβ1–40-tfM35 showing the presence of an additional peak (denoted as *) for a freshly prepared 182 μM peptide sample (blue) as compared to 46 μM sample (red). The small additional peak indicates Aβ1–40-tfM35 oligomerization. The intensities of both samples are normalized to an internal TFE standard. (B) Monitoring the aggregation behavior of 182 μM Aβ1–40-tfM35 by 19F NMR at two different time intervals. The appearance of multiple peaks at 840 hours indicates the presence of variable sized Aβ1–40-tfM35 species. Copyright © 2013, American Chemical Society. This figure is reproduced with permission from dx.doi.org/10.1021/bi400027y: Biochemistry 2013, 52, 1903–1912. Further details can be found in the published study.
Fig. 7.
Fig. 7.. Probing dock-lock mechanism in Aβ1–40 by solution NMR.
(A) Monitoring the depletion of total intensity obtained from 2D 1H-15N SOFAST-HMQC spectra during a self-seeding reaction at 10 °C. The observed distinguished kinetic phase (black vs blue curve) indicates the dominant docking phase (grey shade) within a time-scale of first couple of hours. (B–C) Time-interval measurement highlights a substantial drop in NMR signal intensities of the central hydrophobic residues (F20 as a representative residue) as compared to N- or C-terminal residues (F4 and G37 as representative residues) indicating a possible docking site in monomer onto fully matured fibers. (D) NMR self-seeding reaction identified appearance of new peaks in the SOFAST-HMQC spectrum indicating the origin of new oligomer species. Copyright © 2019 Royal Society of Chemistry. Reproduced by permission from the Royal Society of Chemistry https://doi.org/10.1039/C9CC01067J. Further details are available in the referenced work.

References

    1. Harrison RS, Sharpe PC, Singh Y and Fairlie DP, Rev. Physiol. Biochem. Pharmacol, 2007, 159, 1–77. - PubMed
    1. Chiti F and Dobson CM, Annu. Rev. Biochem, 2006, 75, 333–366. - PubMed
    1. Knowles TPJ, Vendruscolo M and Dobson CM, Nat. Rev. Mol. Cell Biol, 2014, 15, 384–396. - PubMed
    1. Hamley IW, Chem. Rev, 2012, 112, 5147–92. - PubMed
    1. O’Brien RJ and Wong PC, Annu. Rev. Neurosci, 2011, 34, 185–204. - PMC - PubMed

MeSH terms

Substances