Multicenter Study
. 2020 Sep;30(9):4893-4902.
doi: 10.1007/s00330-020-06829-2. Epub 2020 Apr 16.

A diagnostic model for coronavirus disease 2019 (COVID-19) based on radiological semantic and clinical features: a multi-center study

Affiliations
Multicenter Study

A diagnostic model for coronavirus disease 2019 (COVID-19) based on radiological semantic and clinical features: a multi-center study

Xiaofeng Chen et al. Eur Radiol. 2020 Sep.

Abstract

Objectives: Rapid and accurate diagnosis of coronavirus disease 2019 (COVID-19) is critical during the epidemic. We aim to identify differences in CT imaging and clinical manifestations between pneumonia patients with and without COVID-19, and to develop and validate a diagnostic model for COVID-19 based on radiological semantic and clinical features alone.

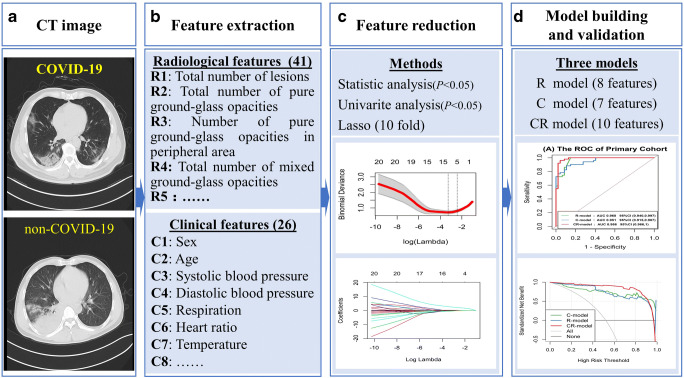
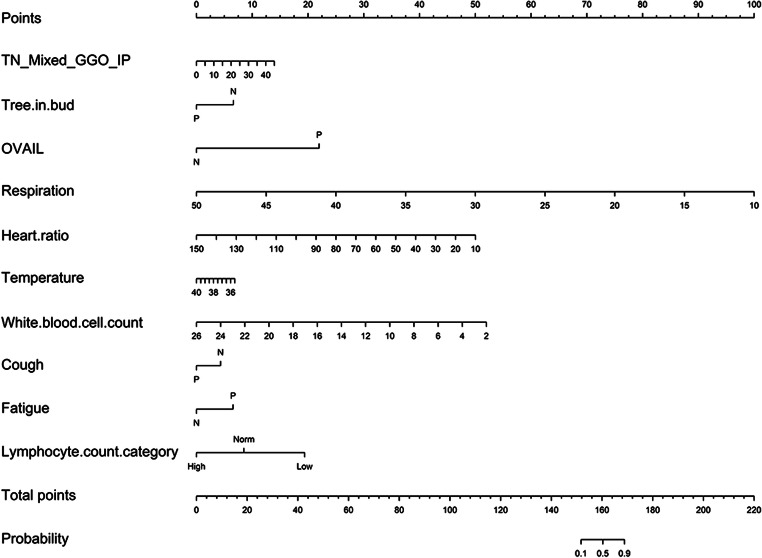
Methods: A consecutive cohort of 70 COVID-19 and 66 non-COVID-19 pneumonia patients were retrospectively recruited from five institutions. Patients were divided into primary (n = 98) and validation (n = 38) cohorts. The chi-square test, Student's t test, and Kruskal-Wallis H test were performed, comparing 1745 lesions and 67 features in the two groups. Three models were constructed using radiological semantic and clinical features through multivariate logistic regression. Diagnostic efficacies of developed models were quantified by receiver operating characteristic curve. Clinical usage was evaluated by decision curve analysis and nomogram.

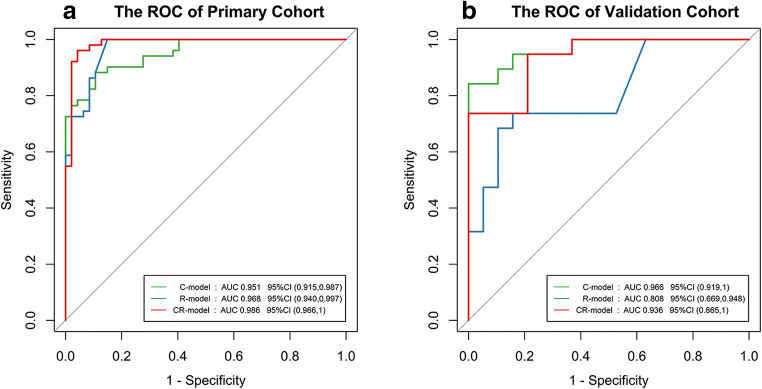
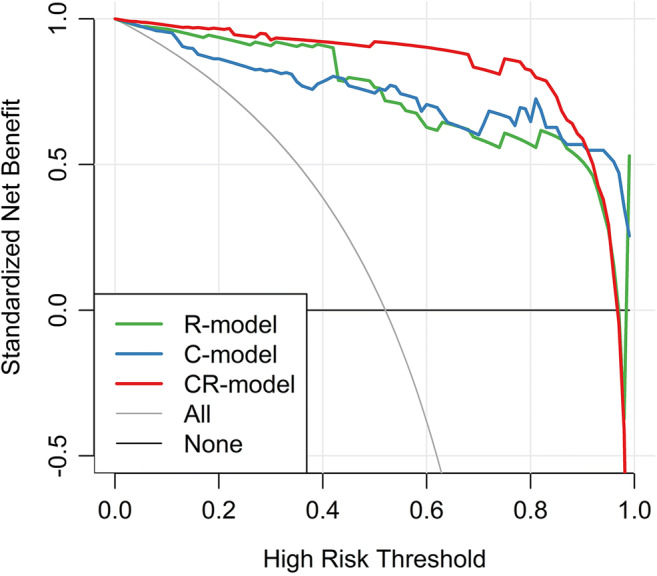
Results: Eighteen radiological semantic features and seventeen clinical features were identified to be significantly different. Besides ground-glass opacities (p = 0.032) and consolidation (p = 0.001) in the lung periphery, the lesion size (1-3 cm) is also significant for the diagnosis of COVID-19 (p = 0.027). Lung score presents no significant difference (p = 0.417). Three diagnostic models achieved an area under the curve value as high as 0.986 (95% CI 0.966~1.000). The clinical and radiological semantic models provided a better diagnostic performance and more considerable net benefits.

Conclusions: Based on CT imaging and clinical manifestations alone, the pneumonia patients with and without COVID-19 can be distinguished. A model composed of radiological semantic and clinical features has an excellent performance for the diagnosis of COVID-19.

Key points: • Based on CT imaging and clinical manifestations alone, the pneumonia patients with and without COVID-19 can be distinguished. • A diagnostic model for COVID-19 was developed and validated using radiological semantic and clinical features, which had an area under the curve value of 0.986 (95% CI 0.966~1.000) and 0.936 (95% CI 0.866~1.000) in the primary and validation cohorts, respectively.

Keywords: COVID-19; Diagnosis; Multi-institutional systems; Pneumonia; Radiology.


Conflict of interest statement

One of the authors of this manuscript (Yuting Liao) is an employee of GE Healthcare. The remaining authors declare no relationships with any companies whose products or services may be related to the subject matter of the article.

Figures

Fig. 1
Fig. 1
A 23-year-old female with a travel history to Wuhan presenting with fever. Axial noncontrast CT image shows a consolidation with ground-glass opacities in the peripheral region by the right upper lobe. Air bronchogram is found in lesion. The maximum diameter of lesion is 2.8 cm. The right upper lobe score is 1 because of the involved lung parenchyma less than 1/4
Fig. 2
Fig. 2
Workflow of data process and analysis in this study. Radiological semantic features, including qualitative and quantitative imaging features, are extracted from axial lung CT section. The clinical manifestation and laboratory parameters are provided by electronic case system. Statistical analysis is performed for comparing the different features between COVID-19 and non-COVID-19 patients. Univariate analysis, least absolute shrinkage, and selection operator (LASSO) are further performed to determine the COVID-19 risk factors with p < 0.05 in statistical analysis. Three models based on the selected features are established by multivariate logistic regression. These models include radiological mode (R model), clinical model (C model), and the combination of clinical and radiological model (CR model). The performance and clinical benefits of the prediction model are assessed by the area under a receiver operating characteristic (ROC) curve and the decision curve, respectively
Fig. 3
Fig. 3
ROC of the three models in primary and validation cohort curves. Comparison of receiver operating characteristic (ROC) curves among the radiological mode (R model), clinical model (C model), and the combination of clinical and radiological model (CR model) for the diagnosis of COVID-19 in the primary (a) and validation (b) cohorts
Fig. 4
Fig. 4
Decision curve analysis for each model in the primary dataset. The y-axis measures the net benefit, which is calculated by summing the benefits (true-positive findings) and subtracting the harms (false-positive findings), weighting the latter by a factor related to the relative harm of undetected metastasis compared with the harm of unnecessary treatment. The decision curve shows that if the threshold probability is over 10%, the application of the combination of clinical and radiological model (CR model) to diagnose COVID-19 adds more benefit than the clinical model (C model) and radiological model (R model)
Fig. 5
Fig. 5
Nomogram of the CR model in the primary cohort. TN_Mixed_GGO_IP represented the total number of mixed GGO in peripheral area. AVAIL represented offending vessel segmentation in lesions. N was a negative result, and P was a positive result. Norm represented normal. Note that in probability scale, 0 = non-COVID-19, 1 = COVID-19

Similar articles

Cited by

References

    1. Organization WH (2020) Novel coronavirus (2019-nCoV) situation reports. Available via https://www.who.int/emergencies/diseases/novel-coronavirus-2019/situatio.... Accessed 16 Mar 2020
    1. Zhu N, Zhang D, Wang W et al (2020) A novel coronavirus from patients with pneumonia in China, 2019. N Engl J Med 382: 727-733 - PMC - PubMed
    1. Huang C, Wang Y, Li X et al (2020) Clinical features of patients infected with 2019 novel coronavirus in Wuhan, China. Lancet 395:497-506 - PMC - PubMed
    1. Pan Y, Guan H (2020) Imaging changes in patients with 2019-nCov. Eur Radiol. 10.1007/s00330-020-06713-z - PMC - PubMed
    1. Pan Y, Guan H, Zhou S et al (2020) Initial CT findings and temporal changes in patients with the novel coronavirus pneumonia (2019-nCoV): a study of 63 patients in Wuhan, China. Eur Radiol. 10.1007/s00330-020-06731-x - PMC - PubMed

Publication types

LinkOut - more resources