

Diagnostic Performance of CT and Reverse Transcriptase Polymerase Chain Reaction for Coronavirus Disease 2019: A Meta-Analysis
- PMID: 32301646
- PMCID: PMC7233409
- DOI: 10.1148/radiol.2020201343
Diagnostic Performance of CT and Reverse Transcriptase Polymerase Chain Reaction for Coronavirus Disease 2019: A Meta-Analysis
Abstract
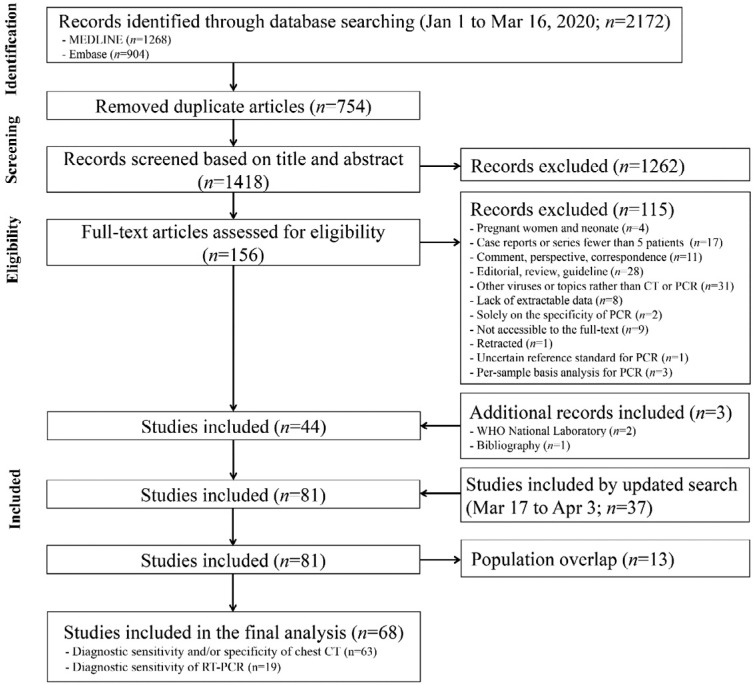
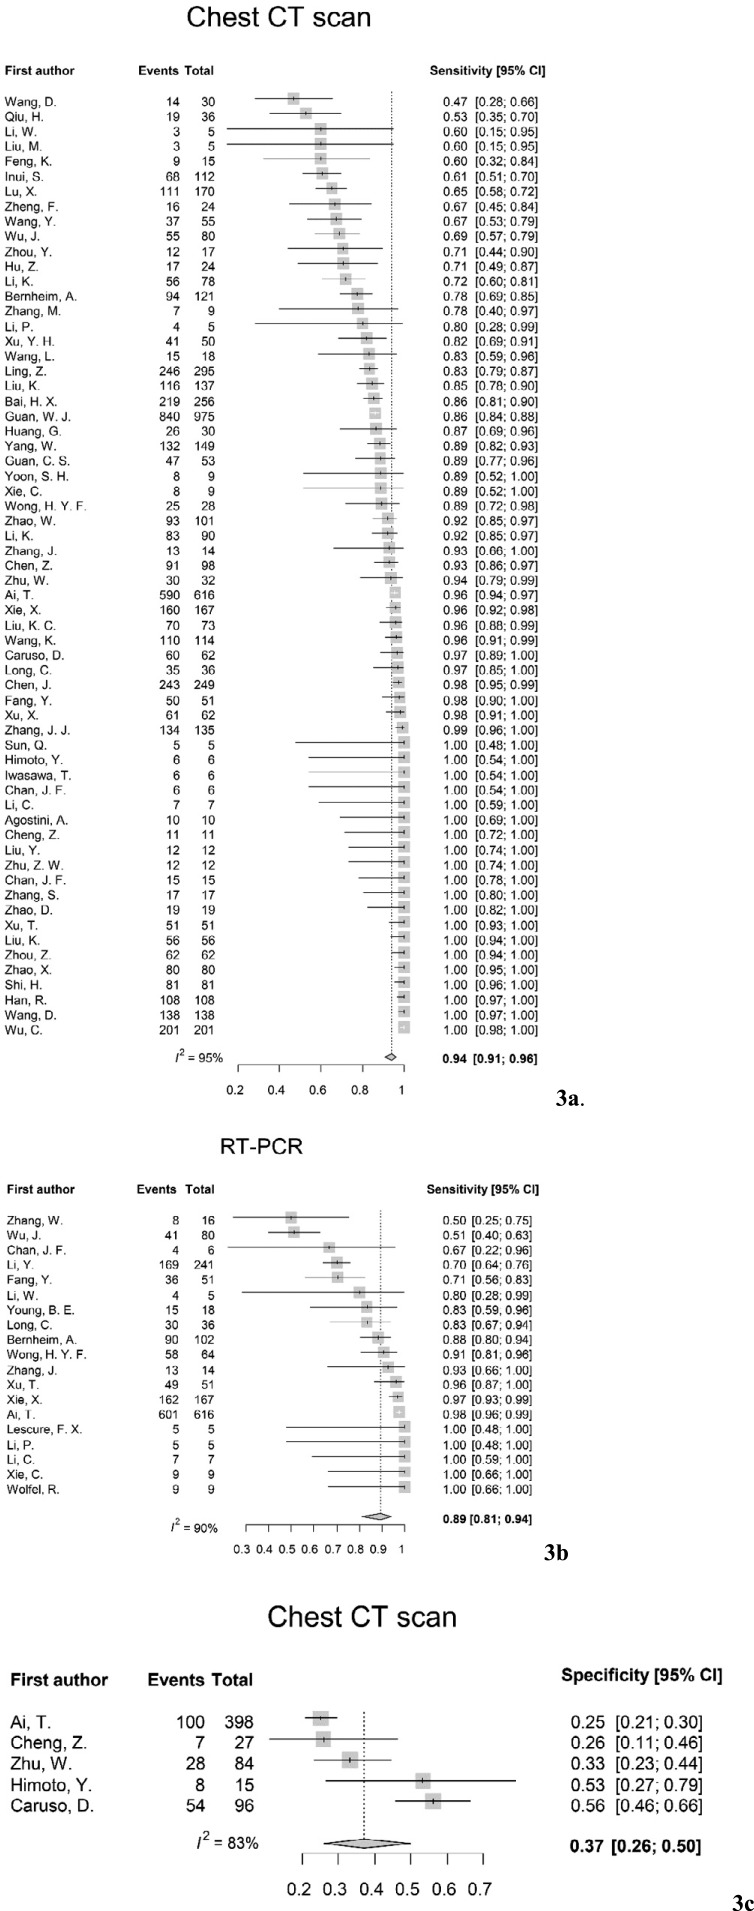
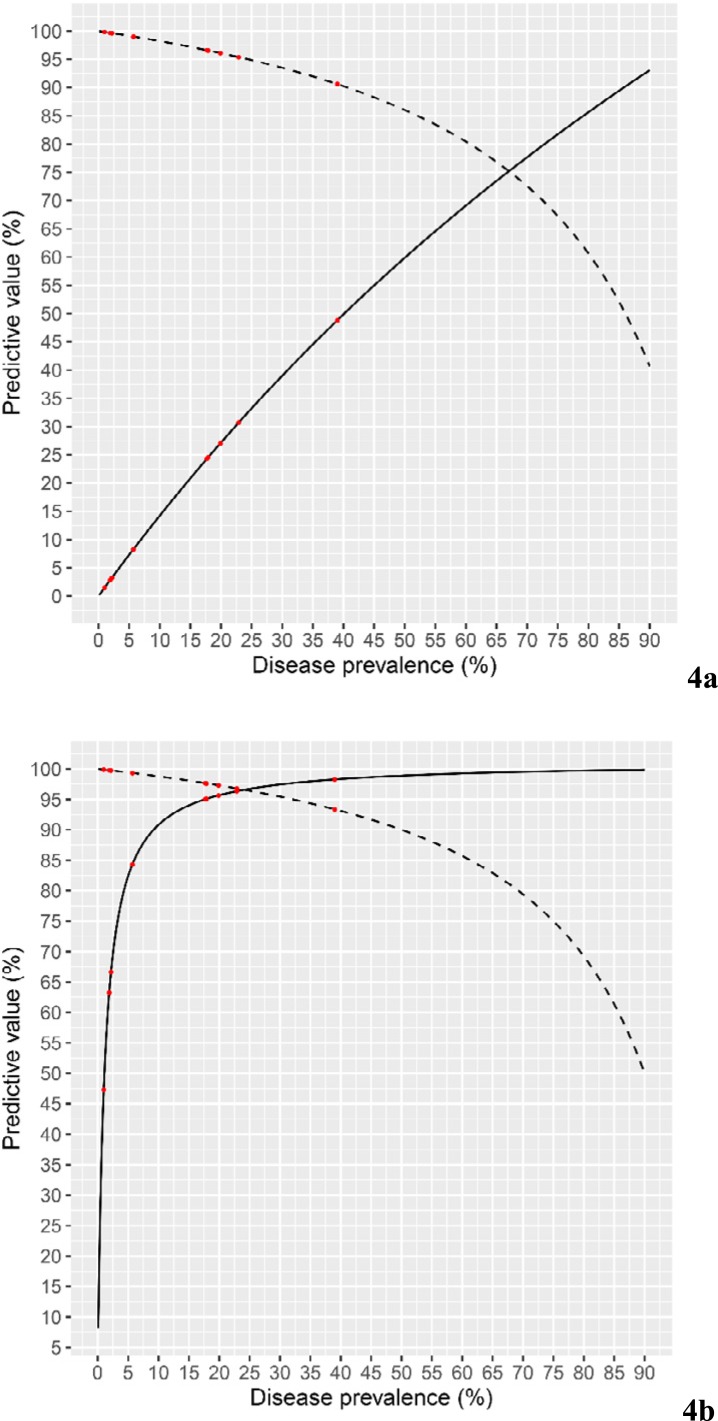
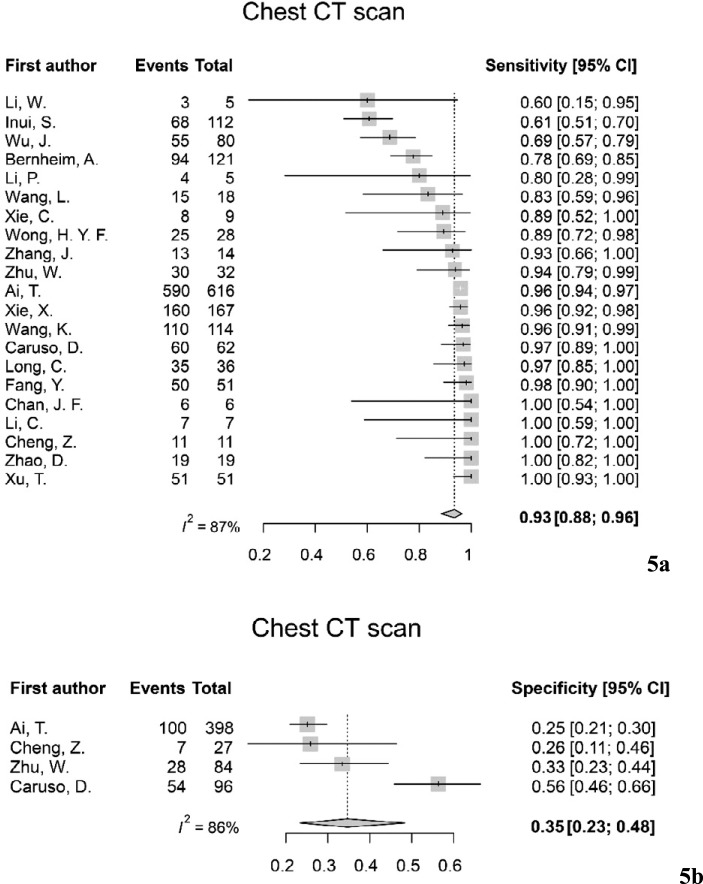
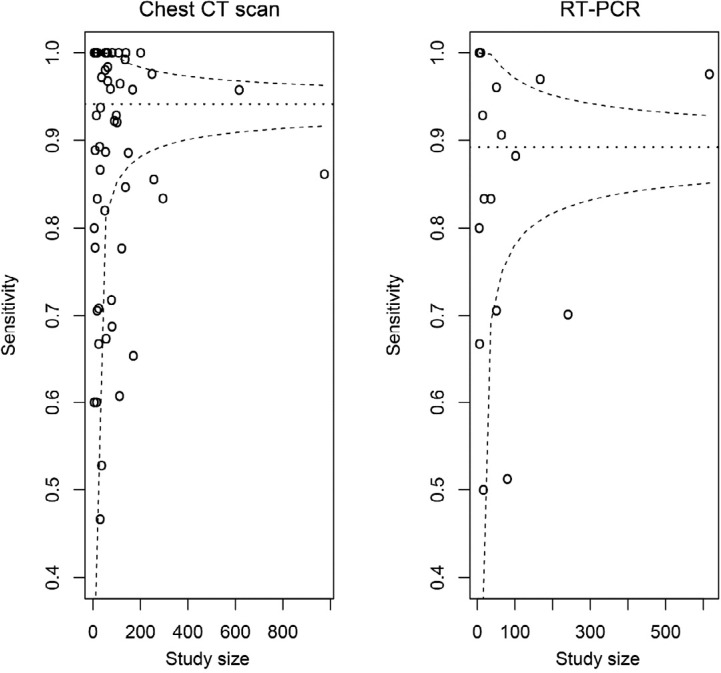
Background Recent studies have suggested that chest CT scans could be used as a primary screening or diagnostic tool for coronavirus disease 2019 (COVID-19) in epidemic areas. Purpose To perform a meta-analysis to evaluate diagnostic performance measures, including predictive values of chest CT and initial reverse transcriptase polymerase chain reaction (RT-PCR). Materials and Methods Medline and Embase were searched from January 1, 2020, to April 3, 2020, for studies on COVID-19 that reported the sensitivity, specificity, or both of CT scans, RT-PCR assays, or both. The pooled sensitivity and specificity were estimated by using random-effects models. The actual prevalence (ie, the proportion of confirmed patients among those tested) in eight countries was obtained from web sources, and the predictive values were calculated. Meta-regression was performed to reveal the effect of potential explanatory factors on the diagnostic performance measures. Results The pooled sensitivity was 94% (95% confidence interval [CI]: 91%, 96%; I2 = 95%) for chest CT and 89% (95% CI: 81%, 94%; I2 = 90%) for RT-PCR. The pooled specificity was 37% (95% CI: 26%, 50%; I2 = 83%) for chest CT. The prevalence of COVID-19 outside China ranged from 1.0% to 22.9%. For chest CT scans, the positive predictive value (PPV) ranged from 1.5% to 30.7%, and the negative predictive value (NPV) ranged from 95.4% to 99.8%. For RT-PCR, the PPV ranged from 47.3% to 96.4%, whereas the NPV ranged from 96.8% to 99.9%. The sensitivity of CT was affected by the distribution of disease severity, the proportion of patients with comorbidities, and the proportion of asymptomatic patients (all P < .05). The sensitivity of RT-PCR was negatively associated with the proportion of elderly patients (P = .01). Conclusion Outside of China where there is a low prevalence of coronavirus disease 2019 (range, 1%-22.9%), chest CT screening of patients with suspected disease had low positive predictive value (range, 1.5%-30.7%). © RSNA, 2020 Online supplemental material is available for this article.
Figures
Comment in
-
Coronavirus Disease 2019 and Chest CT: Do Not Put the Sensitivity Value in the Isolation Room and Look Beyond the Numbers.Radiology. 2020 Oct;297(1):E236-E237. doi: 10.1148/radiol.2020201709. Epub 2020 Apr 27. Radiology. 2020. PMID: 32339083 Free PMC article. No abstract available.
References
-
- World Health Organization . Coronavirus disease (COVID-19) outbreak. https://www.who.int/westernpacific/emergencies/covid-19. Accessed March 27, 2020.
-
- World Health Organization . Coronavirus disease (COVID-19) pandemic. https://www.who.int/emergencies/diseases/novel-coronavirus-2019. Accessed April 8, 2020.
Publication types
MeSH terms
LinkOut - more resources
Full Text Sources
Medical
Miscellaneous
