. 2020 Aug;296(2):E86-E96.
doi: 10.1148/radiol.2020201433. Epub 2020 Apr 17.

Well-aerated Lung on Admitting Chest CT to Predict Adverse Outcome in COVID-19 Pneumonia

Affiliations

Well-aerated Lung on Admitting Chest CT to Predict Adverse Outcome in COVID-19 Pneumonia

Davide Colombi et al. Radiology. 2020 Aug.

Abstract

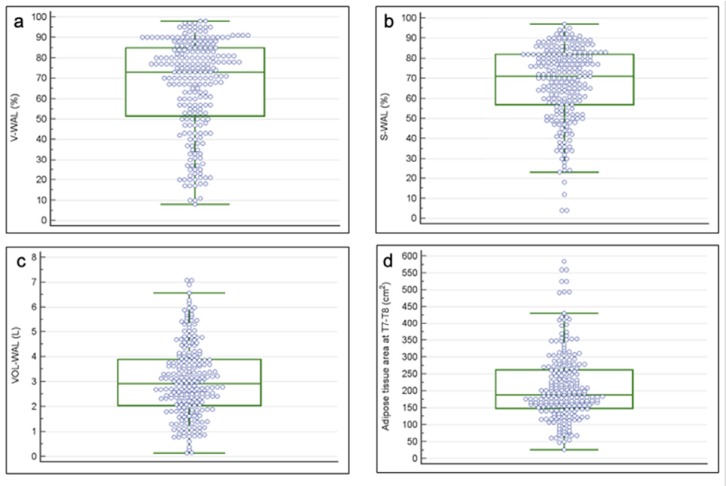
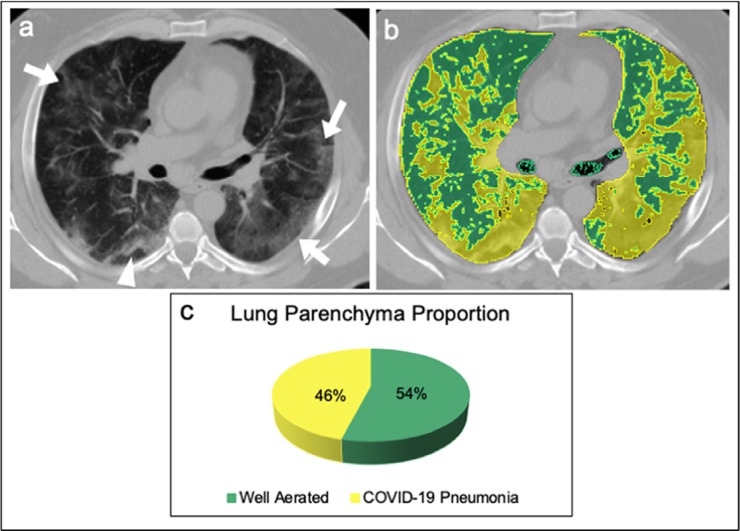
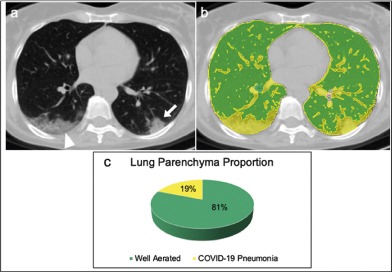
Background CT of patients with severe acute respiratory syndrome coronavirus 2 disease depicts the extent of lung involvement in coronavirus disease 2019 (COVID-19) pneumonia. Purpose To determine the value of quantification of the well-aerated lung (WAL) obtained at admission chest CT to determine prognosis in patients with COVID-19 pneumonia. Materials and Methods Imaging of patients admitted at the emergency department between February 17 and March 10, 2020 who underwent chest CT were retrospectively analyzed. Patients with negative results of reverse-transcription polymerase chain reaction for severe acute respiratory syndrome coronavirus 2 at nasal-pharyngeal swabbing, negative chest CT findings, and incomplete clinical data were excluded. CT images were analyzed for quantification of WAL visually (%V-WAL), with open-source software (%S-WAL), and with absolute volume (VOL-WAL). Clinical parameters included patient characteristics, comorbidities, symptom type and duration, oxygen saturation, and laboratory values. Logistic regression was used to evaluate the relationship between clinical parameters and CT metrics versus patient outcome (intensive care unit [ICU] admission or death vs no ICU admission or death). The area under the receiver operating characteristic curve (AUC) was calculated to determine model performance. Results The study included 236 patients (59 of 123 [25%] were female; median age, 68 years). A %V-WAL less than 73% (odds ratio [OR], 5.4; 95% confidence interval [CI]: 2.7, 10.8; P < .001), %S-WAL less than 71% (OR, 3.8; 95% CI: 1.9, 7.5; P < .001), and VOL-WAL less than 2.9 L (OR, 2.6; 95% CI: 1.2, 5.8; P < .01) were predictors of ICU admission or death. In comparison with clinical models containing only clinical parameters (AUC = 0.83), all three quantitative models showed better diagnostic performance (AUC = 0.86 for all models). The models containing %V-WAL less than 73% and VOL-WAL less than 2.9 L were superior in terms of performance as compared with the models containing only clinical parameters (P = .04 for both models). Conclusion In patients with confirmed coronavirus disease 2019 pneumonia, visual or software quantification of the extent of CT lung abnormality were predictors of intensive care unit admission or death. © RSNA, 2020 Online supplemental material is available for this article.


Figures

Figure 1.
Figure 1.
Diagram showing the patient selection process. Abbreviations: CT, computed tomography; COVID-19, severe acute respiratory syndrome coronavirus 2 (SARS-CoV-2) disease; RT-PCR, reverse-transcription polymerase chain reaction.
Figure 2.
Figure 2.
The Chest Imaging Platform extension (Applied Chest Imaging Laboratory; Boston, Massachusetts, USA) implemented in 3D Slicer software (version 4.10.2, https://www.slicer.org) performed a fully automatic segmentation of lung parenchyma. The algorithm provides a color map of upper, middle, and lower zones lung segmentation displayed with multiplanar reconstructions (axial, sagittal, and coronal) and in 3D volume rendered reconstruction. In this example a 54 years-old female affected by COVID-19 pneumonia. Abbreviations: 3D, three-dimensional; COVID-19, severe acute respiratory syndrome coronavirus 2 (SARS-CoV-2) disease.
Figure 3.
Figure 3.
Box and Whisker plots show the distribution of the CT parameters. (a) The median percentage of the well-aerated lung assessed visually was 73% (interquartile range, 51-85%). (b) The median percentage of the well-aerated lung assessed by software was 71% (interquartile range, 57-82%). (c) The absolute volume of the well aerated lung median value was 2.9 L (interquartile range, 2-3.9 L). (d) The median value of the adipose tissue area at T7-T8 level was 189 cm2 (interquartile range 149-262 cm2). Abbreviations: CT, computed tomography; V-WAL, well-aerated lung assessed visually; S-WAL, well-aerated lung assessed by software; VOL-WAL, absolute volume of well-aerated lung; T7-T8, seventh and eight dorsal vertebrae.
Figure 4.
Figure 4.
A 65 years old male affected by COVID-19 pneumonia admitted in ICU. (a) Non-enhanced axial chest CT image showed bilateral patchy ground glass opacities (arrows) with random distribution and peripheral band-like consolidation in the right lower lobe (arrowhead), with a visual quantification of the well aerated lung of 35%. (b) The same image, displaying highlighted in green the well aerated lung and COVID-19 pneumonia in yellow; the analysis of the relative density histogram, quantified an overall well aerated volume of 54%, corresponding to an absolute volume of 2.3 L. (c) The 3D pie-chart showed the proportion of COVID-19 pneumonia and well aerated lung parenchyma. Abbreviations: COVID-19, severe acute respiratory syndrome coronavirus 2 (SARS-CoV-2) disease; CT, computed tomography; 3D, three-dimensional.
Figure 5.
Figure 5.
A 54 years old female affected by COVID-19 pneumonia discharged at home from the Emergency Department (a) Non-enhanced axial chest CT image showed peripheral consolidation (arrow) in the left lower lobe and peripheral mixed crazy-paving opacities and consolidation in the right lower lobe (arrowhead), with a visual quantification of the well aerated lung of 85%. (b) The same image, displaying highlighted in green the well aerated lung and COVID-19 pneumonia in yellow; the analysis of the relative density histogram, quantified an overall well aerated volume of 81%, corresponding to an absolute volume of 3.3 L. (c) The 3D pie-chart showed the proportion of COVID-19 pneumonia and well aerated lung parenchyma. Abbreviations: COVID-19, severe acute respiratory syndrome coronavirus 2 (SARS-CoV-2) disease; CT, computed tomography; 3D, three-dimensional.
Figure 6.
Figure 6.
Diagnostic performance for prediction of ICU admission or death for patients with COVID-19 based on baseline parameters and chest CT at the emergency department admission. Receive operator characteristic (ROC) curves of the models based on clinical parameters (blue line), clinical parameters and percentage of total lung volume as assessed visually (green line), by software histogram analysis (orange line), and as absolute volume (green dotted line). The area under the ROC curve (AUC) for the clinical model was 0.83 (95% CI, 0.78-0.88). The models including clinical parameters and additional CT evaluation of the well aerated lung parenchyma, both visual and software-based showed higher performance as compared to the clinical model (%V-WAL<73%: AUC 0.86, 95% CI 0.81-0.90; %S-WAL<71%: AUC 0.86, 95% CI 0.80-0.90; VOL-WAL: AUC 0.85, 95% CI 0.81-0.90). Abbreviations: CI, confidence interval; %V-WAL, percentage of well-aerated lung assessed visually; %S-WAL, percentage of well-aerated lung assessed by software; VOL-WAL, absolute volume of well-aerated lung.

Comment in

References

    1. Li Q, Guan X, Wu P, Wang X, Zhou L, Tong Y, Ren R, Leung KSM, Lau EHY, Wong JY, Xing X, Xiang N, Wu Y, Li C, Chen Q, Li D, Liu T, Zhao J, Liu M, Tu W, Chen C, Jin L, Yang R, Wang Q, Zhou S, Wang R, Liu H, Luo Y, Liu Y, Shao G, Li H, Tao Z, Yang Y, Deng Z, Liu B, Ma Z, Zhang Y, Shi G, Lam TTY, Wu JT, Gao GF, Cowling BJ, Yang B, Leung GM, Feng Z. Early Transmission Dynamics in Wuhan, China, of Novel Coronavirus-Infected Pneumonia. N Engl J Med. 2020 Mar 26;382(13):1199-1207. doi: 10.1056/NEJMoa2001316. - PMC - PubMed
    1. American College of Radiology (ACR) . ACR Recommendations for the use of chest radiography and computed tomography (CT) for suspected COVID-19 Infection. https://www.acr.org/Advocacy-and-Economics/ACR-Position-Statements/Recom.... Published March 11, 2020. Accessed April 1, 2020.
    1. Sverzellati N, Milanese G, Milone F, Balbi M, Ledda RE, Silva M. Integrated Radiologic Algorithm for COVID-19 Pandemic. J Thorac Imaging. 2020 Apr 7. doi: 10.1097/RTI.0000000000000516. Epub ahead of print. - PMC - PubMed
    1. Li K, Fang Y, Li W, Pan C, Qin P, Zhong Y, Liu X, Huang M, Liao Y, Li S. CT image visual quantitative evaluation and clinical classification of coronavirus disease (COVID-19). Eur Radiol. 2020 Mar 25. doi: 10.1007/s00330-020-06817-6. Epub ahead of print. - PMC - PubMed
    1. Huang L, Han R, Ai T, Yu P, Kang H, Tao Q, Xia L. Serial Quantitative Chest CT Assessment of COVID-19: Deep-Learning Approach. Radiology 2020. doi: 10.1148/ryct.2020200075. Epub ahead of print. - PMC - PubMed

MeSH terms

LinkOut - more resources