. 2020 Apr 9;61(4):21.
doi: 10.1167/iovs.61.4.21.

Transcription Factor 4 Regulates the Regeneration of Corneal Endothelial Cells

Affiliations

Transcription Factor 4 Regulates the Regeneration of Corneal Endothelial Cells

Jin Sun Hwang et al. Invest Ophthalmol Vis Sci. .

Retraction in

  • Retraction.
    [No authors listed] [No authors listed] Invest Ophthalmol Vis Sci. 2020 Sep 1;61(11):6. doi: 10.1167/iovs.61.11.6. Invest Ophthalmol Vis Sci. 2020. PMID: 32882012 Free PMC article. No abstract available.

Abstract

Purpose: Human corneal endothelial cells (hCECs) have limited regenerative capacity in vivo. Reduced hCEC density results in bullous keratopathy requiring corneal transplantation. This study reveals the role of transcription factor 4 (TCF4) in hCEC diseases and suggests that TCF4 may be a molecular target for hCEC regeneration.

Methods: Cell shape, cell proliferation rates, and proliferation-associated proteins were evaluated in normal or senescent hCECs. TCF4 was blocked by siRNA (si-TCF4) or activated using clustered regularly interspaced short palindromic repeats (CRISPR)/dCas9 activation systems (pl-TCF4). The corneal endothelium of six-week-old Sprague-Dawley (SD) rats was transfected by electroporation followed by cryoinjury.

Results: Cell proliferation rates and TCF4 levels were reduced in senescent cells. TCF4 CRISPR activation enhanced corneal endothelial wound healing. TCF4 regulated mitochondrial functions including mitochondrial membrane potential, mitochondrial superoxide levels, and energy production. The percentage of cells in the S-phase was reduced with si-TCF4 and increased with pl-TCF4. Cell proliferation and cell cycle-associated proteins were regulated by TCF4. Autophagy was induced by si-TCF4. In vivo transfection of CRISPR/dCas9 activation systems (a-TCF4) induced regeneration of corneal endothelium.

Conclusions: Corneal endothelial diseases are associated with TCF4 reduction; TCF4 may be a potential target for hCEC diseases. Gene therapy using TCF4 CRISPR/dCas9 may be an effective treatment for hCEC diseases.


Conflict of interest statement

Disclosure: J.S. Hwang, None; C.K. Yoon, None; J.Y. Hyon, None; T.-Y. Chung, None; Y.J. Shin, None

Figures

Figure 1.
Figure 1.
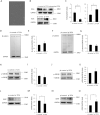
Culture and identification of hCECs and Wnt signaling regulated by TCF4. (A) The hCECs were cultured in mosaic pattern. (B, C) TCF4 expression after treating siRNA for TCF4 (si-TCF4) and CRISPR/dCas9 activation system for TCF4 (pl-TCF4). (DG) β-catenin expression was not different. (HK) Activation of GSK3β was not different. (LO) GFAP expression was regulated by TCF4. All the measurements were conducted in triplicate or quadruplicate. ***P < 0.001, **P < 0.01, and *P < 0.05 statistically significant by independent t-test.
Figure 2.
Figure 2.
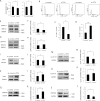
Cell proliferation and the cell cycle depending on TCF4 expression. (A) Cell proliferation rate by TCF4 inhibition (si-TCF4) or TCF4 overexpression (pl-TCF4). N = 7, P = 0.026, and 0.038. (BD) Cell cycle analysis showed the percentage of cells in the S-phase. (EH) The expression of phospho-extracellular signal–regulated kinase 1/2 (pERK1/2) was shown. (IL) Cyclin-dependent kinase 1 (CDK1) expression is shown. N = 4, P = 0.008 and 0.007. (MP) Cyclin D1 expression. (QT) CDKN2A expression. All the measurements were conducted in triplicate or quadruplicate. ***P < 0.001, **P < 0.01, and *P < 0.05 statistically significant by independent t-test.
Figure 3.
Figure 3.
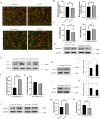
Role of TCF4 in mitochondrial functions. (AC) Mitochondrial viability stain showed that mitochondrial viability was regulated by TCF4. N = 7, P = 0.008, and 0.037. (DF) Mitochondrial mass was evaluated by Mitotracker Green fluorescence. Mitochondrial mass was regulated by TCF4. Bar scale = 50 µm. (GI) Mitochondrial superoxide production was evaluated by MitoSOX Red fluorescence. Mitochondrial superoxide formation was regulated by TCF4. Bar scale = 50 µm. (J) Co-localization of MitoTracker green and MitoSOX. (KM) Intracellular oxidative stress levels were evaluated by DCF fluorescence (green). Bar scale = 50 µm. N = 6, P = 0.026, and 0.001. (N, O) Relative adenosine triphosphate (ATP) production was evaluated. (PS) Activation of AMP-activated protein kinase (AMPK) was evaluated. All the measurements were conducted in triplicate or quadruplicate. ***P < 0.001, **P < 0.01, and *P < 0.05 statistically significant by independent t-test.
Figure 4.
Figure 4.
Regulation of TCF4 expression in mitochondria-induced cell death. (A, B) ΔΨm was measured using JC-1. Bar scale = 100 µm. (C) Cell viability was decreased by si-TCF4 and was increased by pl-TCF4. (D) Expression of caspase-9 was increased by si-TCF4 and decreased by pl-TCF4. (EG) Autophagy was measured by the ratio of LC3-II/LC3-1 expression. The si-TCF4 increased LC3-II expression. (HK) Sirtuin 1 (SIRT1) expression was elevated by si-TCF4 and reduced by pl-TCF4. (LN) NOX4 expression increased with si-TCF4 and decreased with pl-TCF4. All the measurements were conducted in triplicate or quadruplicate. ***P < 0.001, **P < 0.01, and *P < 0.05 statistically significant by independent t-test.
Figure 5.
Figure 5.
Effect of TCF4 CRISPR activation on corneal endothelial wound healing. (A, B) Corneal opacity in control, a-TCF4 group, and si-TCF4 group. (C) TCF4 expression (green) was increased in the cornea endothelium of the a-TCF4 group. Nuclear staining was performed with Hoechst 33342 (blue). (D) qRT-PCR showed the TCF4 expression levels. (E) β-catenin expression in the corneal endothelium. (F, G) Corneal endothelium stained with alizarin S red. Alizarin S red staining showed the increased wound healing in the corneal endothelium in the a-TCF4 group. The number of corneal endothelial cells was higher in the a-TCF4 group. (H) MitoTracker green fluorescence indicates mitochondrial mass and mitoSOX red fluorescence indicates oxidative stress levels. All the measurements were conducted in triplicate or quadruplicate. ***P < 0.001, **P < 0.01, and *P < 0.05 by independent t-test.
Figure 6.
Figure 6.
Schematic diagram of TCF4 signaling pathway.

References

    1. Waring GO 3rd, Bourne WM, Edelhauser HF, Kenyon KR. The corneal endothelium. Normal and pathologic structure and function. Ophthalmology. 1982; 89: 531–590. - PubMed
    1. Whikehart DR. The inhibition of sodium, potassium-stimulated ATPase and corneal swelling: the role played by polyols. J Am Optom Assoc. 1995; 66: 331–333. - PubMed
    1. Van Horn DL, Sendele DD, Seideman S, Buco PJ. Regenerative capacity of the corneal endothelium in rabbit and cat. Invest Ophthalmol Vis Sci. 1977; 16: 597–613. - PubMed
    1. Sugar A. An analysis of corneal endothelial and graft survival in pseudophakic bullous keratopathy. Trans Am Ophthalmol Soc. 1989; 87: 762–801. - PMC - PubMed
    1. Baratz KH, Tosakulwong N, Ryu E, et al. .. E2-2 protein and Fuchs's corneal dystrophy. N Engl J Med. 2010; 363: 1016–1024. - PubMed

Publication types

MeSH terms