

Randomized study of the effect of gadopiclenol, a new gadolinium-based contrast agent, on the QTc interval in healthy subjects
- PMID: 32302009
- PMCID: PMC7576613
- DOI: 10.1111/bcp.14309
Randomized study of the effect of gadopiclenol, a new gadolinium-based contrast agent, on the QTc interval in healthy subjects
Abstract
Aims: We investigated the effect of gadopiclenol, a new gadolinium-based contrast agent, on the QTc interval at clinical and supraclinical dose, considering the relative hyperosmolarity of this product.
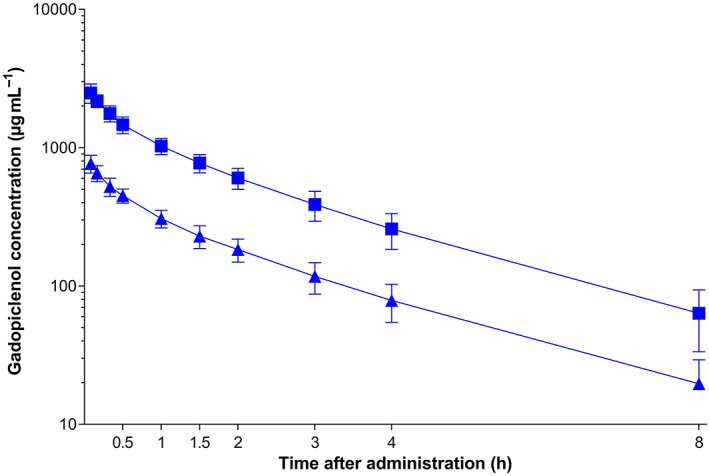
Methods: This was a single centre, randomized, double-blind, placebo- and positive-controlled, 4-way crossover study. Forty-eight healthy male and female subjects were included to receive single intravenous (i.v.) administrations of gadopiclenol at the clinical dose of 0.1 mmol kg-1 , standard for current gadolinium-based contrast agents, the supraclinical dose of 0.3 mmol kg-1 , placebo and a single oral dose of 400 mg moxifloxacin.
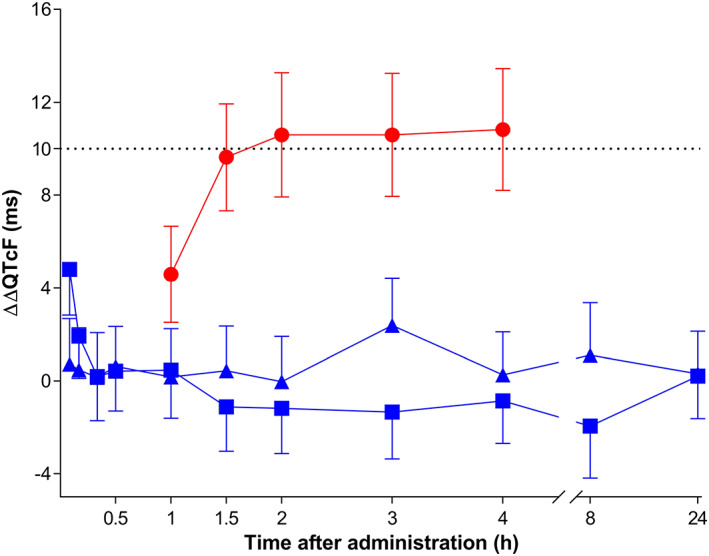
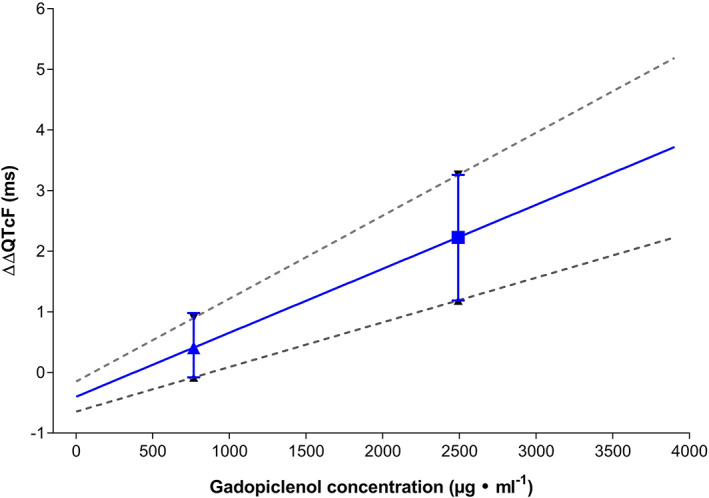
Results: The largest time-matched placebo-corrected, mean change from-baseline in QTcF (ΔΔQTcF) was observed 3 hours after administration of 0.1 mmol kg-1 gadopiclenol (2.39 ms, 90% confidence interval [CI]: 0.35, 4.43 ms) and 5 minutes after administration of 0.3 mmol kg-1 (4.81 ms, 90%CI: 2.84, 6.78 ms). The upper limit of the 90% CI was under the threshold of 10 ms, demonstrating no significant effect of gadopiclenol on QTc interval. From 1.5 to 4 hours postdose moxifloxacin, the lower limit of the 90% CI of ΔΔQTcF exceeded 5 ms demonstrating assay sensitivity. Although there was a positive slope, the concentration-response analysis estimated that the values of ΔΔQTcF at the maximal concentration of gadopiclenol at 0.1 and 0.3 mmol kg-1 were 0.41 and 2.23 ms, respectively, with the upper limit of the 90% CI not exceeding 10 ms. No serious or severe adverse events or treatment discontinuations due to adverse events were reported.
Conclusion: This thorough QT/QTc study demonstrated that gadopiclenol did not prolong the QT interval at clinical and supraclinical doses and was well tolerated in healthy volunteers. The positive slope of the QTc prolongation vs concentration relationship suggests that hyperosmolarity could be associated with QTc prolongation. However, the amplitude of this effects is unlikely to be associated with proarrhythmia.
Keywords: QTc interval; gadopiclenol; healthy subjects; osmolarity; thorough QT study.
© 2020 The British Pharmacological Society.
Conflict of interest statement
C.F.‐B., P.V., F.V. and M.F. had support from Guerbet for the submitted work. N.L.F., C.D. and P.D. are current employees of Guerbet. There are no other relationships or activities that could appear to have influenced the submitted work.
Figures
Similar articles
-
Review of the Efficacy and Safety of Gadopiclenol: A Newly Emerging Gadolinium-Based Contrast Agent.Cureus. 2023 Aug 6;15(8):e43055. doi: 10.7759/cureus.43055. eCollection 2023 Aug. Cureus. 2023. PMID: 37680433 Free PMC article. Review.
-
A Phase I, Randomized, Double-Blinded, Placebo- and Moxifloxacin-Controlled, Four-Period Crossover Study To Evaluate the Effect of Gepotidacin on Cardiac Conduction as Assessed by 12-Lead Electrocardiogram in Healthy Volunteers.Antimicrob Agents Chemother. 2017 Apr 24;61(5):e02385-16. doi: 10.1128/AAC.02385-16. Print 2017 May. Antimicrob Agents Chemother. 2017. PMID: 28223381 Free PMC article. Clinical Trial.
-
Lack of effect of perampanel on QT interval duration: Results from a thorough QT analysis and pooled partial seizure Phase III clinical trials.Epilepsy Res. 2015 Aug;114:122-30. doi: 10.1016/j.eplepsyres.2015.04.010. Epub 2015 May 1. Epilepsy Res. 2015. PMID: 26088895 Clinical Trial.
-
Thorough QT study of the effect of intravenous amisulpride on QTc interval in Caucasian and Japanese healthy subjects.Br J Clin Pharmacol. 2017 Feb;83(2):339-348. doi: 10.1111/bcp.13128. Epub 2016 Oct 21. Br J Clin Pharmacol. 2017. PMID: 27618796 Free PMC article. Clinical Trial.
-
The thorough QT/QTc study 4 years after the implementation of the ICH E14 guidance.Br J Pharmacol. 2010 Jan;159(1):49-57. doi: 10.1111/j.1476-5381.2009.00487.x. Epub 2009 Nov 18. Br J Pharmacol. 2010. PMID: 19922536 Free PMC article. Review.
Cited by
-
How the Chemical Properties of GBCAs Influence Their Safety Profiles In Vivo.Molecules. 2021 Dec 23;27(1):58. doi: 10.3390/molecules27010058. Molecules. 2021. PMID: 35011290 Free PMC article. Review.
-
Review of the Efficacy and Safety of Gadopiclenol: A Newly Emerging Gadolinium-Based Contrast Agent.Cureus. 2023 Aug 6;15(8):e43055. doi: 10.7759/cureus.43055. eCollection 2023 Aug. Cureus. 2023. PMID: 37680433 Free PMC article. Review.
-
A decade of pyridine-containing heterocycles in US FDA approved drugs: a medicinal chemistry-based analysis.RSC Med Chem. 2024 Oct 10;16(1):12-36. doi: 10.1039/d4md00632a. Online ahead of print. RSC Med Chem. 2024. PMID: 39493227 Free PMC article. Review.
-
A Comprehensive Overview of the Efficacy and Safety of Gadopiclenol: A New Contrast Agent for MRI of the CNS and Body.Invest Radiol. 2024 Feb 1;59(2):124-130. doi: 10.1097/RLI.0000000000001025. Epub 2023 Oct 9. Invest Radiol. 2024. PMID: 37812485 Free PMC article. Review.
-
Preclinical Safety Assessment of Gadopiclenol: A High-Relaxivity Macrocyclic Gadolinium-Based MRI Contrast Agent.Invest Radiol. 2024 Feb 1;59(2):108-123. doi: 10.1097/RLI.0000000000001038. Epub 2023 Nov 3. Invest Radiol. 2024. PMID: 37921752 Free PMC article.
References
-
- Bellin MF, Van Der Molen AJ. Extracellular gadolinium‐based contrast media: an overview. Eur J Radiol. 2008;66(2):160‐167. - PubMed
-
- Grobner T. Gadolinium‐‐a specific trigger for the development of nephrogenic fibrosing dermopathy and nephrogenic systemic fibrosis? Nephrol Dial Transplant. 2006;21:1104‐1108. - PubMed
