. 2020 Sep 1;37(9):2711-2726.
doi: 10.1093/molbev/msaa100.

Structural Phylogenetics with Confidence

Affiliations

Structural Phylogenetics with Confidence

Ashar J Malik et al. Mol Biol Evol. .

Abstract

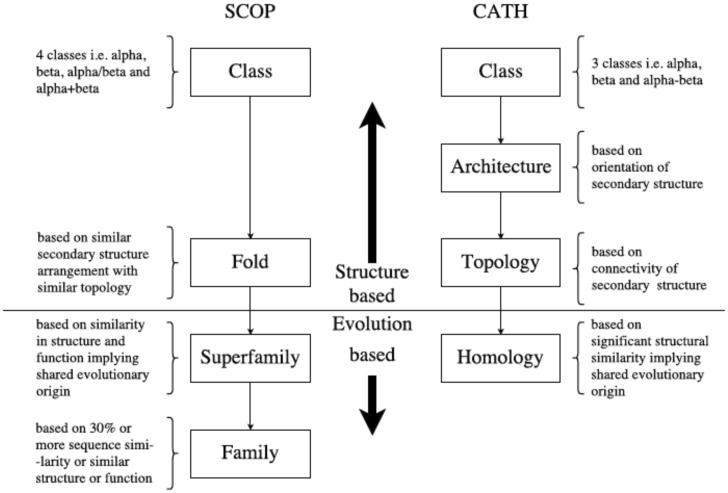
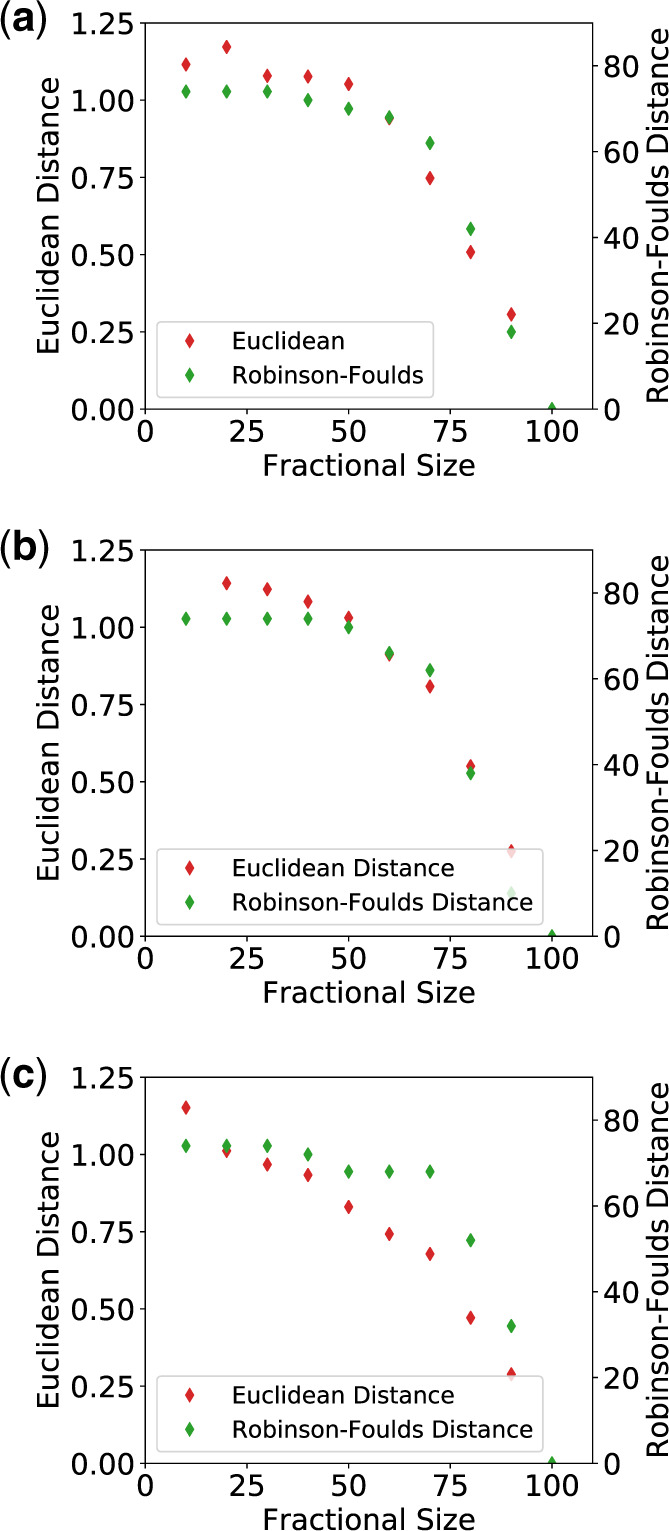
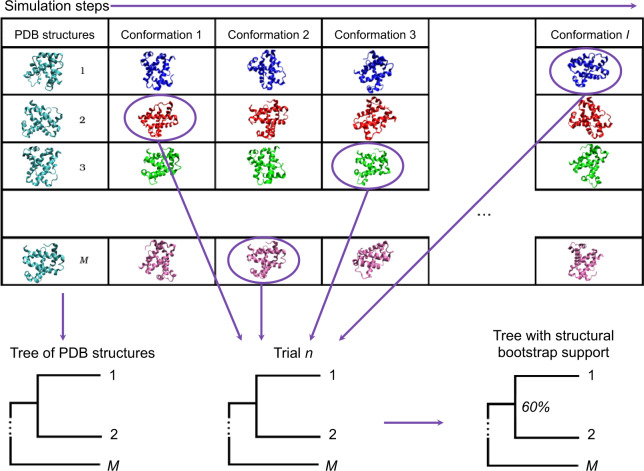
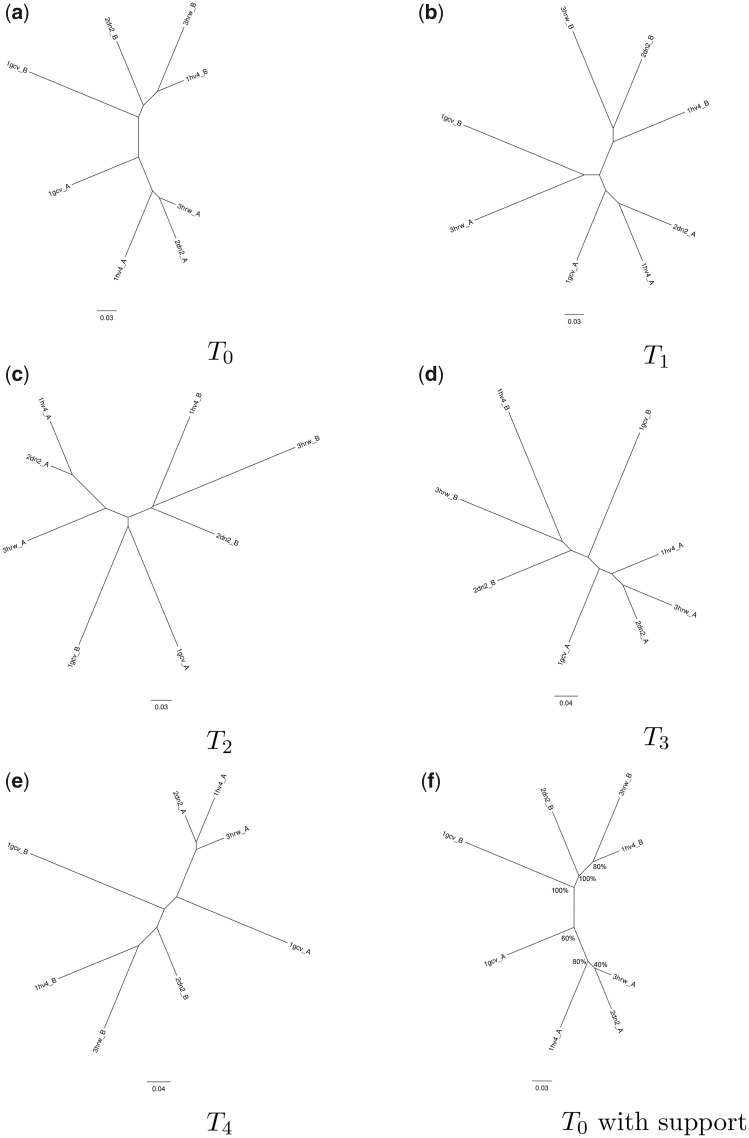
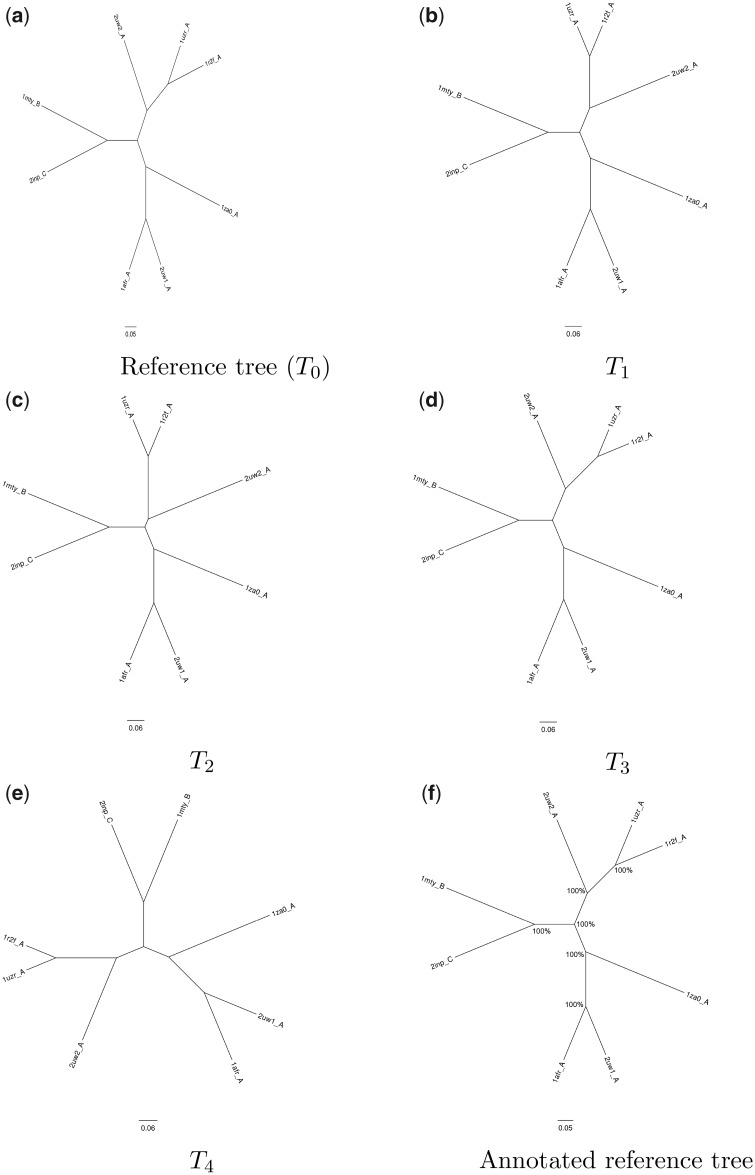
For evaluating the deepest evolutionary relationships among proteins, sequence similarity is too low for application of sequence-based homology search or phylogenetic methods. In such cases, comparison of protein structures, which are often better conserved than sequences, may provide an alternative means of uncovering deep evolutionary signal. Although major protein structure databases such as SCOP and CATH hierarchically group protein structures, they do not describe the specific evolutionary relationships within a hierarchical level. Structural phylogenies have the potential to fill this gap. However, it is difficult to assess evolutionary relationships derived from structural phylogenies without some means of assessing confidence in such trees. We therefore address two shortcomings in the application of structural data to deep phylogeny. First, we examine whether phylogenies derived from pairwise structural comparisons are sensitive to differences in protein length and shape. We find that structural phylogenetics is best employed where structures have very similar lengths, and that shape fluctuations generated during molecular dynamics simulations impact pairwise comparisons, but not so drastically as to eliminate evolutionary signal. Second, we address the absence of statistical support for structural phylogeny. We present a method for assessing confidence in a structural phylogeny using shape fluctuations generated via molecular dynamics or Monte Carlo simulations of proteins. Our approach will aid the evolutionary reconstruction of relationships across structurally defined protein superfamilies. With the Protein Data Bank now containing in excess of 158,000 entries (December 2019), we predict that structural phylogenetics will become a useful tool for ordering the protein universe.

Keywords: deep evolution; phylogenetics; protein structure.


Figures

<sc>Fig</sc>. 1.
Fig. 1.
Organization of SCOP and CATH databases: SCOP (Andreeva et al. 2019) arranges protein structures into classes, Folds, Superfamilies, and Families. CATH (Sillitoe et al. 2019) uses Classes, Architectures, Topologies, and Homologies to organize protein structures. The horizontal split marks a boundary which separates structure- and evolution-based groupings. Structures grouped together in Homology (CATH) and Family and Superfamily (SCOP) likely share a common evolutionary origin.
<sc>Fig</sc>. 2.
Fig. 2.
Phylogenetic trees for proteins from the globin family built using structural data sets that comprise the indicated fraction of each structure (red) together with the complete structures (black). Only trees built from five of the fractional structural data sets are shown here; enlarged versions of all ten are provided in supplementary figures S3–S12, Supplementary Material online. (a and b) For fractional structures comprising up to 70% of the complete structure, fraction size dominates the tree structure. Clade groupings are sometimes reproduced for fractional structures comprising 70% to (c) 80% of each protein, but residual differences to (e) the true tree remain even for (d) 90% fractional structures.
<sc>Fig</sc>. 3.
Fig. 3.
Phylogenetic trees for proteins from the trypsin-like serine protease family built using structural data sets that comprise the indicated fraction of each structure (red) together with the complete structures (black). Only trees built from five of the fractional structural data sets are shown here; enlarged versions of all ten are provided in supplementary figures S13–S22, Supplementary Material online. (a) For fractional structures comprising up to 50% of the complete structure, fraction size dominates the tree structure. Clade groupings are sometimes reproduced for fractional structures comprising (b) 50% to (c) 80% of each protein, but residual differences to (e) the true tree remain even for (d) 90% fractional structures.
<sc>Fig</sc>. 4.
Fig. 4.
Phylogenetic trees for proteins from the aldo-keto reductase (NADP) family built using structural data sets that comprise the indicated fraction of each structure (red) together with the complete structures (black). Only trees built from five of the fractional structural data sets are shown here; enlarged versions of all ten are provided in supplementary figures S23–S32, Supplementary Material online. (a) For fractional structures comprising up to 50% of the complete structure, fraction size dominates the tree structure. Clade groupings are sometimes reproduced for fractional structures comprising (b) 50% to (c) 80% of each protein, but residual differences to (e) the true tree remain even for (d) 90% fractional structures.
<sc>Fig</sc>. 5.
Fig. 5.
The Euclidean and Robinson–Foulds (Robinson and Foulds 1981) distances between fractional trees, T10% through T90%, and the true tree, T100% for the (a) globin, (b) trypsin-like serine protease, and (c) aldo-keto reductase (NADP) superfamilies. As the length difference between the complete and fractional structures decreases, the topologies of the fractional trees approach those of the true tree, T100%.
<sc>Fig</sc>. 6.
Fig. 6.
Overview of a bootstrap method for structure comparisons. An ensemble of possible conformations is generated for each of mM proteins using MD simulation. For each of nN trials, a conformation cm is randomly selected from each of the M ensembles to populate a new trial data set Cn. Pairwise comparison of the conformations in each trial data set Cn generates new distances from which a NJ tree Tn is created. Each trial tree, Tn, is compared with the reference tree T0. If a relationship between structures in the reference tree T0 is recreated in the trial tree Tn, it is counted. The nodes of T0 are labeled with the fraction of trial trees in which the relationship was recovered, providing a measure of the statistical support for that node.
<sc>Fig</sc>. 7.
Fig. 7.
Illustration of MD-based bootstrap trials on structures from the globin family. The recent divergence of the α and β globin chains is reproduced with 100% confidence, but the relationships between the α chains have low support. The annotated tree (f) uses T0, the reference tree, and shows the relationships recovered as a percentage of the trials conducted (in this case, five, (a) T0 – (e) T4).
<sc>Fig</sc>. 8.
Fig. 8.
Illustration of MD-based bootstrap trials on structures from the ribonucleotide reductase-like family. All relationships have 100% support from this limited set of bootstrap trials. The annotated tree (f) uses T0, the reference tree, and shows the relationships recovered as a percentage of the trials conducted (in this case, five, (a) T0 (e) T4).
<sc>Fig</sc>. 9.
Fig. 9.
The conserved structural core of proteins in the ferritin-like superfamily comprises a four-helix bundle that coordinates a pair of metal ions. The helices are arranged in a characteristic up-down–down-up topology. Shown here are representative structures from the ferritin (2za7A), bacterioferritin (1nfvA), and Dps (1o9rA) groups colored from (red) N-terminus to (blue) C-terminus (a) ferritin, (b) bacterioferritin, (c) Dps, (d) overlaid (ferritin, red; bacterioferritin, green; Dps, blue).
<sc>Fig</sc>. 10.
Fig. 10.
Structure-based phylogenetics of the ferritin-like superfamily. The color-coded ellipses are consistent with the previous study (Lundin et al. 2012) and labeled with annotations provided by the PDB (wwPDB Consortium 2008). The scale bars represent distance as quantified by the inverse Qscore. (a) NeighborNet network of the ferritin-like superfamily built from the structures as obtained from the PDB (wwPDB Consortium 2008). The red dot-dashed arcs separate the structures with three different dimerization types whose separate classification was used to assess the quality of the phylogenetic tree by Lundin et al. (2012). The vertical pink line marks the broad split between the two SCOP families, ferritins (a.25.1.1, left) and ribonucleotide reductase-like (a.25.1.2, right). (b) Structural phylogeny of the ferritin-like superfamily with statistical support from the structural bootstrap method. The bifurcating tree was built using the structures from which the simulations were initiated, with statistical support generated using MD simulations. Support values obtained from 100 samples of alternative conformations for each protein structure from the repertoire of 10,000 conformations generated during the production phase of the MD simulation are shown for key splits. SCOP and CATH classifications are shown by the color of the node labels and of the associated triangle, respectively, as per the embedded key. Pfam classifications are indicated by arcs.

References

    1. Abraham MJ, Murtola T, Schulz R, Páll S, Smith JC, Hess B, Lindahl E.. 2015. GROMACS: high performance molecular simulations through multi-level parallelism from laptops to supercomputers. SoftwareX 1–2:19–25.
    1. Allison JR, Lechner M, Hoeppner MP, Poole AM.. 2016. Positive selection or free to vary? Assessing the functional significance of sequence change using molecular dynamics. PLoS One 11(2):e0147619–e0147713. - PMC - PubMed
    1. Andreeva A, Kulesha E, Gough J, Murzin AG.. 2019. The SCOP database in 2020: expanded classification of representative family and superfamily domains of known protein structures. Nucleic Acids Res. 48(D1):D376–D1048. - PMC - PubMed
    1. Best RB, Zhu X, Shim J, Lopes PEM, Mittal J, Feig M, MacKerell JA.. 2012. Optimization of the additive CHARMM all-atom protein force field targeting improved sampling of the backbone ϕ, ψ and side-chain χ1 and χ2 dihedral angles. J Chem Theory Comput. 8(9):3257–3273. - PMC - PubMed
    1. Boomsma W, Frellsen J, Harder T, Bottaro S, Johansson KE, Tian P, Stovgaard K, Andreetta C, Olsson S, Valentin JB, Antonov LD, et al. 2013. PHAISTOS: a framework for Markov chain Monte Carlo simulation and inference of protein structure. J Comput Chem. 34(19):1697–1705. - PubMed

Publication types