. 2020 May 5;31(5):1017-1031.e4.
doi: 10.1016/j.cmet.2020.04.005. Epub 2020 Apr 16.

Patch-Seq Links Single-Cell Transcriptomes to Human Islet Dysfunction in Diabetes

Affiliations

Patch-Seq Links Single-Cell Transcriptomes to Human Islet Dysfunction in Diabetes

Joan Camunas-Soler et al. Cell Metab. .

Abstract

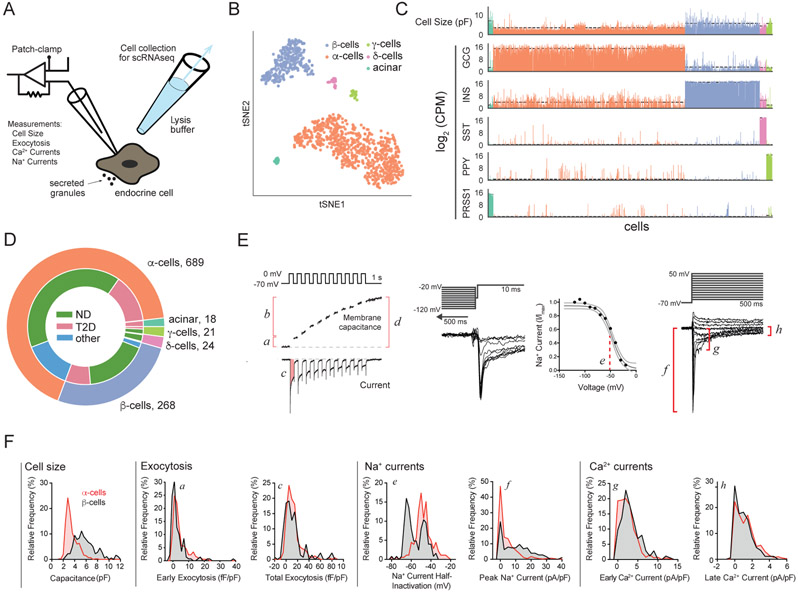
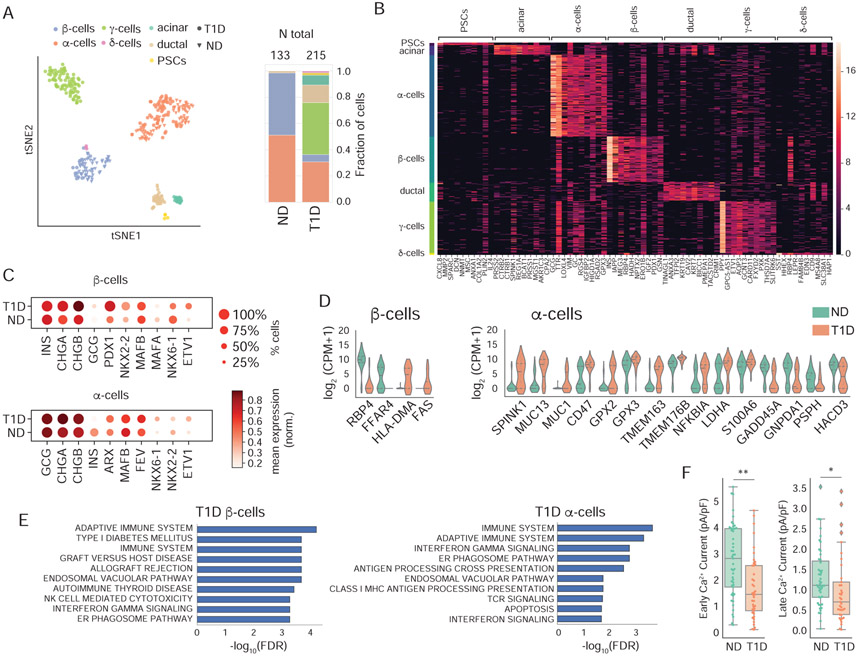
Impaired function of pancreatic islet cells is a major cause of metabolic dysregulation and disease in humans. Despite this, it remains challenging to directly link physiological dysfunction in islet cells to precise changes in gene expression. Here we show that single-cell RNA sequencing combined with electrophysiological measurements of exocytosis and channel activity (patch-seq) can be used to link endocrine physiology and transcriptomes at the single-cell level. We collected 1,369 patch-seq cells from the pancreata of 34 human donors with and without diabetes. An analysis of function and gene expression networks identified a gene set associated with functional heterogeneity in β cells that can be used to predict electrophysiology. We also report transcriptional programs underlying dysfunction in type 2 diabetes and extend this approach to cryopreserved cells from donors with type 1 diabetes, generating a valuable resource for understanding islet cell heterogeneity in health and disease.

Keywords: T1D; T2D; alpha cell; beta cell; cryopreservation; diabetes; islet; pancreas; patch-seq; single-cell RNA-seq.


Conflict of interest statement

Declaration of Interests The authors disclose no conflicts of interest.

Figures

Figure 1.
Figure 1.. Patch-seq measurements in endocrine cells.
(A) Schematic of patch-seq. (B) tSNE projection of patch-seq cells clustered by gene expression of over-dispersed genes. (C) Cell size (measured as membrane capacitance) for each cell and expression of key marker genes. Color code as in panel B. Dashed line indicates average value per cell type. (D) Patch-seq cells collected in this study. (E) In each cell we measured: a- early exocytosis; b- late exocytosis; c- Ca2+ integral, d- total exocytosis, e- Na+ current half-inactivation; f peak Na+ current; g- early Ca2+ current; h- late Ca2+ current (not shown: cell size, reversal potential, and Na+ and Ca2+ conductance). (F) Distribution of selected parameters demonstrating functional heterogeneity of α– (red) and β– (black) cells. Inset letters (a-h) correspond to parameters in panel E. Distribution of exocytotic responses in a and c at 1 mM glucose (α–cells) or 5-10 mM glucose (β–cells). See also Supp. Fig. S1, S2 and Supp. Table S1.
Figure 2.
Figure 2.. Correlation of β–cell exocytosis to single-cell gene expression and pathway analysis.
(A) Spearman correlation of electrophysiological parameters shows clustering of each functional group and low cross-correlation across clusters. All parameters are normalized to cell size. (B) Heatmap of top genes correlated and anticorrelated to total exocytosis in β–cells from ND at 5-10 mM glucose. Cells are sorted by exocytotic response from highest (left, dark green) to lowest (right, yellow). Gene expression is shown as a z-score after smoothing (n = 20 cells). Metadata for each cell is shown at bottom (BMI, Donor, Sex). (C) Top enriched pathways in genes correlated (red) and anticorrelated (blue) to total exocytosis (KEGG and Reactome databases, False Discovery Rate (FDR) < 0.1). (D) Summarized map of cellular location and pathways with genes correlated (green) and anticorrelated (red) to exocytosis. (E) Exocytosis in β–cells measured at 10 mM glucose following target gene knockdown compared to control cells from same donors (348 cells, n ≧3 donors per knockdown experiment). ** P < 0.01, **** P < 0.0001 (Mann-Whitney-U test and BH correction). See also Supp. Fig. S3 and Supp. Tables S2, S3, S4.
Figure 3.
Figure 3.. Gene networks associated with β–cell functional heterogeneity.
(A) Genes with significant correlation to electrophysiology (z-score > 2 for n > 5 parameters, see Methods). Significant positive/negative correlations are indicated in red/blue. (B) tSNE projection of β–cells from ND using genes in panel A. Spearman rank correlation between each parameter and gene is shown as mean and error in last digit (see Methods). (C) Network of genes connecting different functional groups (‘PS genes’). Genes (small dots) connecting different functional groups (large dots) are selected if they show significant correlations (z-score > 2) to at least one functional parameter in each group. Edge color indicates positive/negative correlations (red/blue), and gene color identifies clusters connected to the same functional groups. (E) Predictions of the k-NN model using ‘PS genes’ for training (black) and validation (red) sets. Spearman correlation and P for each parameter are indicated as inset. (F) Performance of the model using the ‘PS genes’ (dark gray), measured as Spearman correlation between experimental and predicted values. Comparison to model using 484 random genes of equivalent expression in β–cells (10,000 permutations, 95% CI interval in light gray). Asterisk indicates parameters with P < 0.05 in validation set. Smaller spider plots show performance of the ‘PS gene set’ (gray) versus top correlated genes to exocytosis (pink), Ca2+ (green), Na+ (orange), cell size (blue). See also Supp. Fig. S4 and Supp. Table S5.
Figure 4.
Figure 4.. Functional and transcriptomic differences in β–cell subpopulations.
(A) Electrophysiological function in RBP4 subpopulations of β–cells. A significant decrease of Na+ currents and exocytosis is observed for RBP4+ cells. (B) Gene expression values (top) and % β–cells with detectable expression (bottom) of Na+, ATP-sensitive K+ channels and Ca2+ channels. *** P < 0.001, ** P < 0.01 * P < 0.05 (Mann-Whitney-U test with BH correction).
Figure 5.
Figure 5.. Functional and transcriptomic changes in β–cells early in T2D.
(A) Insulin content and secretion (as % content) for donors included in this study. * P < 0.05, *** P < 0.001 (Student’s t-test; Two-way ANOVA and Tukey post-test) (B) Measured exocytosis for β–cells in ND and T2D. ** P < 0.01 (Mann-Whitney-U test and BH correction). (C) Enrichment analyis in T2D of genes found to be correlated (red) or anticorrelated (blue) to exocytosis in cells from ND. Data shows median log fold-change in gene expression between T2D and ND for each subset of genes. Error is SEM. Central bar shows range of log2 fold change obtained by sampling random genes of equivalent expression (10,000 iterations, 400 genes, 5-95% range). (D) Gene correlation map of exocytosis. Scatter plot shows correlation to exocytosis in ND (x-axis) and T2D (y-axis) for each gene. Genes with significant correlations (z-score>2) are colored according to their fold-enrichment in T2D cells (red upregulated in T2D, blue downregulated in T2D), and size is proportional to relative change in % expression. Regions of interest are highlighted with dotted boxes. Genes with non-significant correlations shown in gray. (E) Enriched pathways for genes correlated to exocytosis in ND (i), T2D (ii) and genes anticorrelated to exocytosis in ND (iii), T2D (iv). Enrichment is shown as log10(FDR). Left bar indicates top category of each pathway. (F) Distribution of ETV1 expression (left) and enrichment of a subset of genes that change between ND and T2D. (G) Model showing the hypothesized role of ETV1, STAT3 and immune pathways in β–cell dysfunction in early T2D. Based on (Suriben et al., 2015). (H) Exocytosis in β–cells measured at 5 mM glucose following ETV-1 knockdown compared to control cells from same donors (n = 3 donors both for ND and T2D, *** P <0.001 Kruskal-Wallis test and Dunn’s post-test). See also Supp. Fig. S5.
Figure 6.
Figure 6.. Transcriptomic and electrophysiological heterogeneity in α–cells.
(A) ROC curve of cell type prediction using random forests for the validation dataset in ND (red, blue) and in T2D (green, purple). (B) Confusion matrix showing accuracy of predictions in ND validation dataset. (C) Contribution of each feature to the random forest model. (D) Comparison of α–cell identification from predictions at the time of patch-clamping (simple cell size cut-off) versus the model. (E) t-SNE plots showing heterogeneity in gene expression of α–cells using over-dispersed genes and normalized electrophysiological measurements. See also Supp. Fig. S6.
Figure 7.
Figure 7.. Patch-seq in cells from cryopreserved T1D islets.
(A) Left: tSNE projection of patch-seq cells clustered by gene expression of over-dispersed genes. Right: Cell types and total number of cells obtained for ND and T1D. (B) Marker genes for each cell type. (C) Expression of key identity genes on α– and β–cells from donors with T1D and ND matched controls. (D) Representative genes obtained in a differential expression analysis between T1D and ND for β– and α–cells. (E) Pathways enriched in upregulated genes in T1D α– and β–cells. (F) Distribution of calcium parameters showing statistically significant differences between α–cells of donors with T1D and ND. ** P < 0.01, * P < 0.05 (Mann-Whitney-U test with BH correction). See also Supp. Fig. S7 and Supp. Tables S6, S7.

Comment in

References

    1. Aichler M, Borgmann D, Krumsiek J, Buck A, MacDonald PE, Fox JEM, Lyon J, Light PE, Keipert S, Jastroch M, et al. (2017). N-acyl Taurines and Acylcarnitines Cause an Imbalance in Insulin Synthesis and Secretion Provoking β Cell Dysfunction in Type 2 Diabetes. Cell Metabolism 25, 1334–1347.e4. - PubMed
    1. Ait-Lounis A, Bonal C, Seguin-Estevez Q, Schmid CD, Bucher P, Herrera PL, Durand B, Meda P, and Reith W (2010). The Transcription Factor Rfx3 Regulates -Cell Differentiation, Function, and Glucokinase Expression. Diabetes 59, 1674–1685. - PMC - PubMed
    1. Akiyama M, Liew CW, Lu S, Hu J, Martinez R, Hambro B, Kennedy RT, and Kulkarni RN (2013). X-Box Binding Protein 1 Is Essential for Insulin Regulation of Pancreatic -Cell Function. Diabetes 62,2439–2449. - PMC - PubMed
    1. Alejandro EU, Gregg B, Blandino-Rosano M, Cras-Meéneur C, and Bernal-Mizrachi E (2015). Natural history of β-cell adaptation and failure in type 2 diabetes. Molecular Aspects of Medicine 42, 19–41. - PMC - PubMed
    1. Alves TC, Pongratz RL, Zhao X, Yarborough O, Sereda S, Shirihai O, Cline GW, Mason G, and Kibbey RG (2015). Integrated, Step-Wise, Mass-Isotopomeric Flux Analysis of the TCA Cycle. Cell Metabolism 22, 936–947. - PMC - PubMed

Publication types

MeSH terms