. 2020 Jun 17;106(6):1009-1025.e10.
doi: 10.1016/j.neuron.2020.03.022. Epub 2020 Apr 16.

PNOCARC Neurons Promote Hyperphagia and Obesity upon High-Fat-Diet Feeding

Affiliations

PNOCARC Neurons Promote Hyperphagia and Obesity upon High-Fat-Diet Feeding

Alexander Jais et al. Neuron. .

Abstract

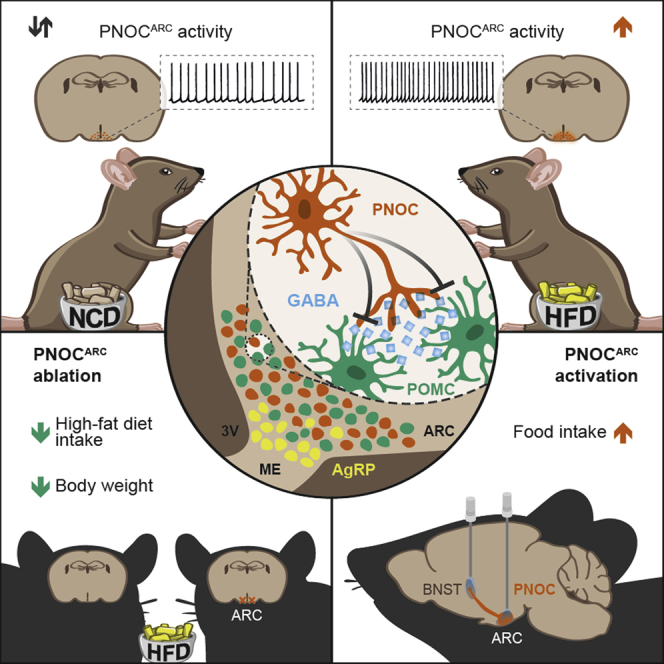
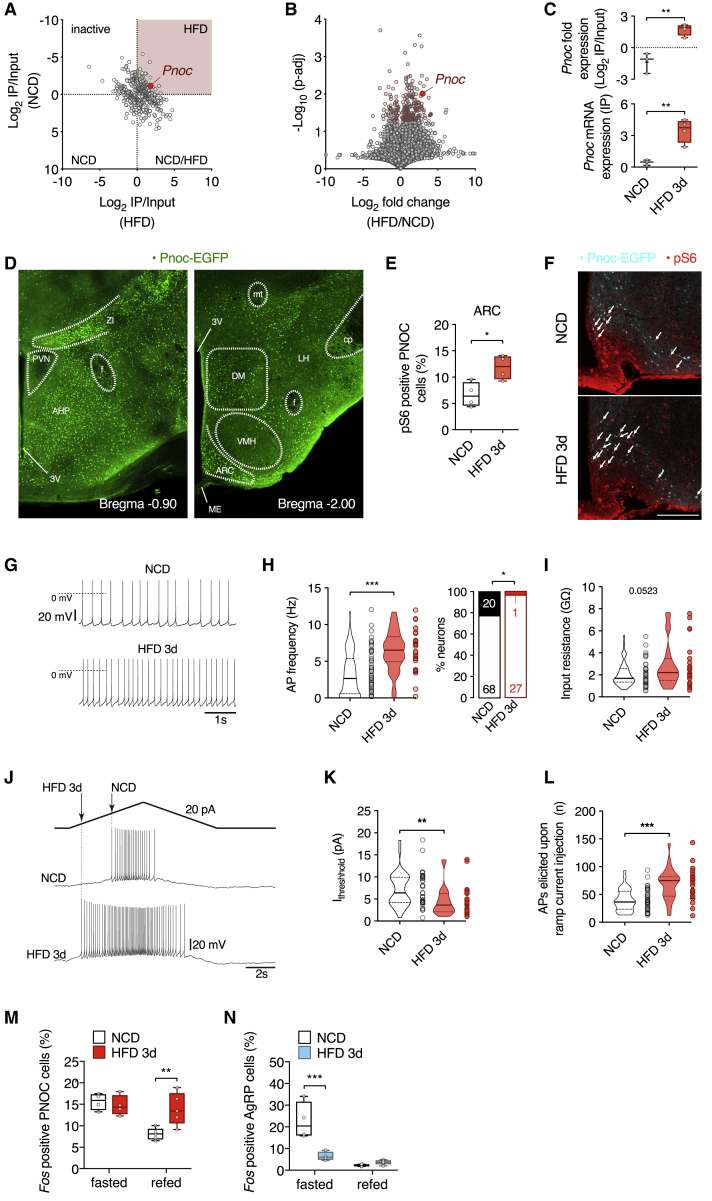
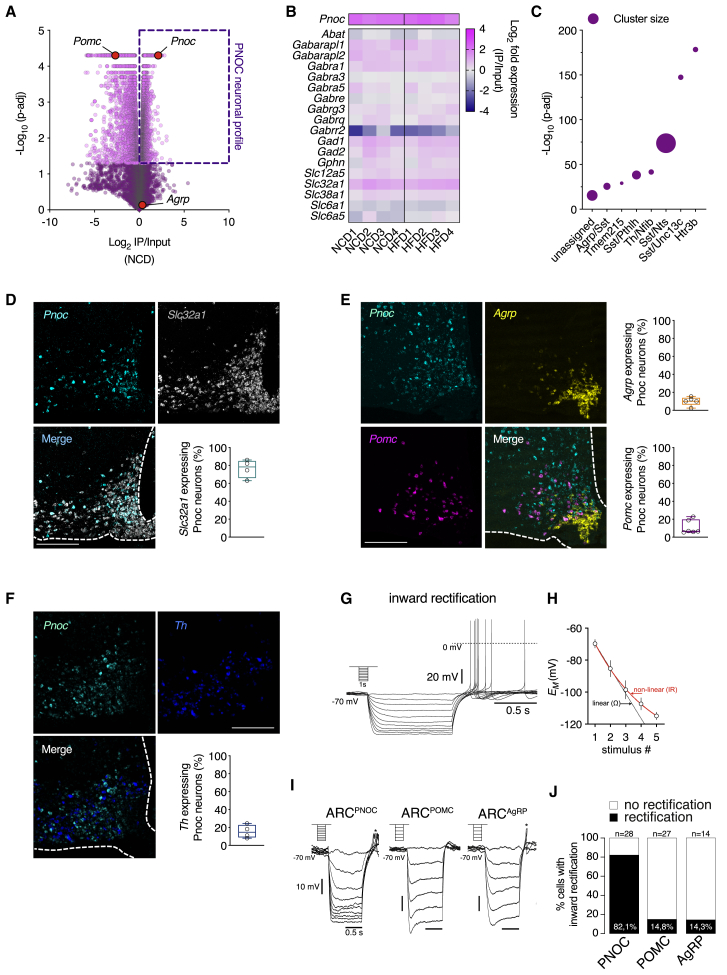
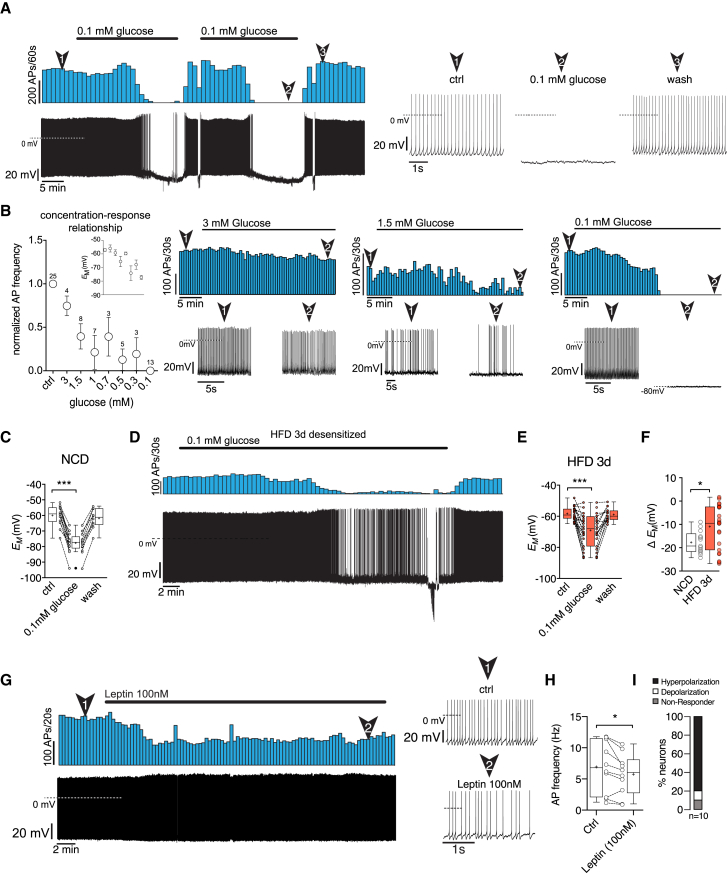
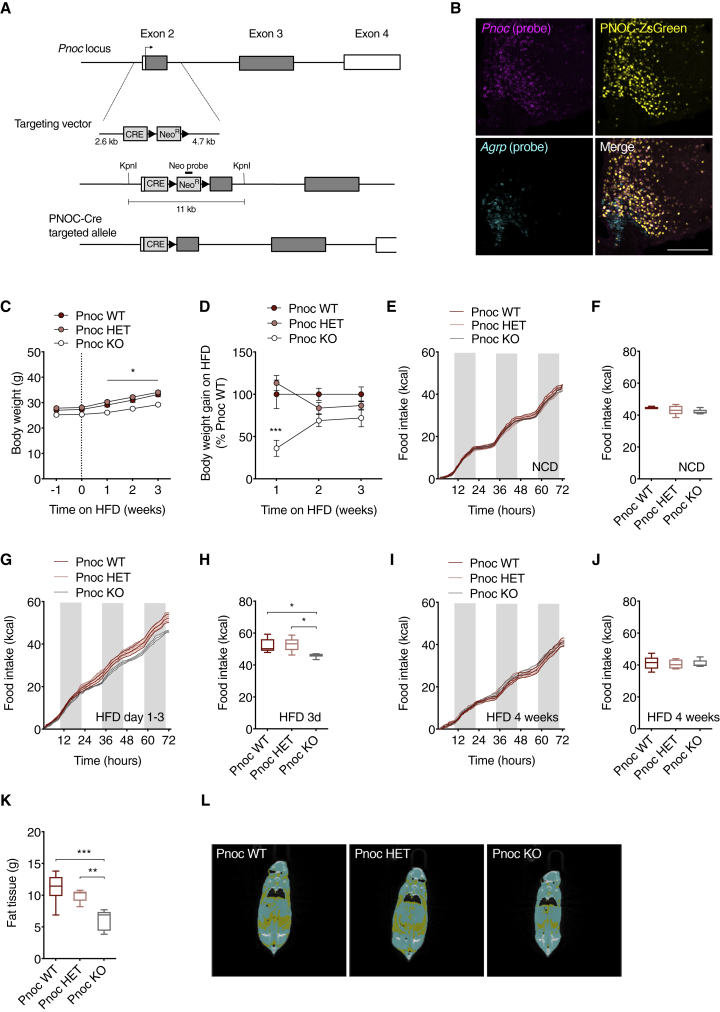
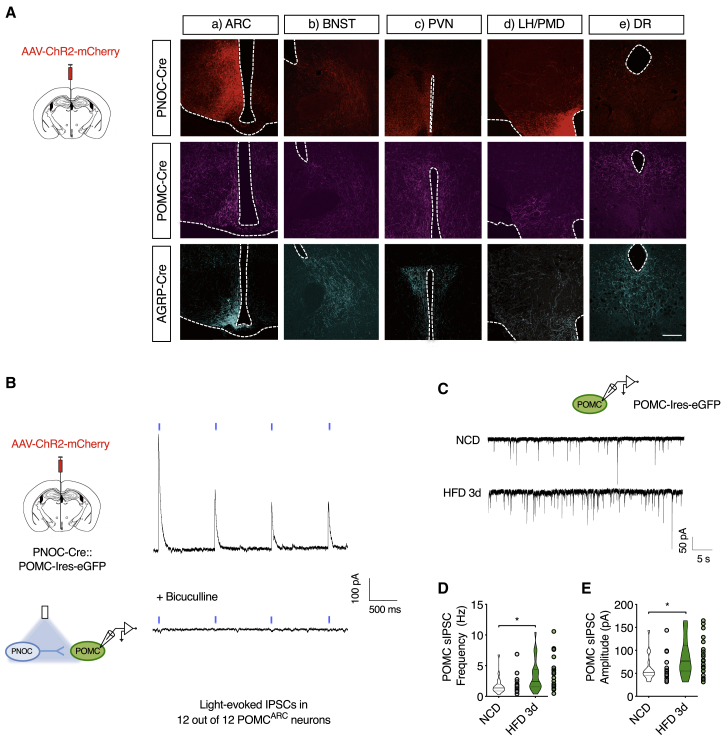
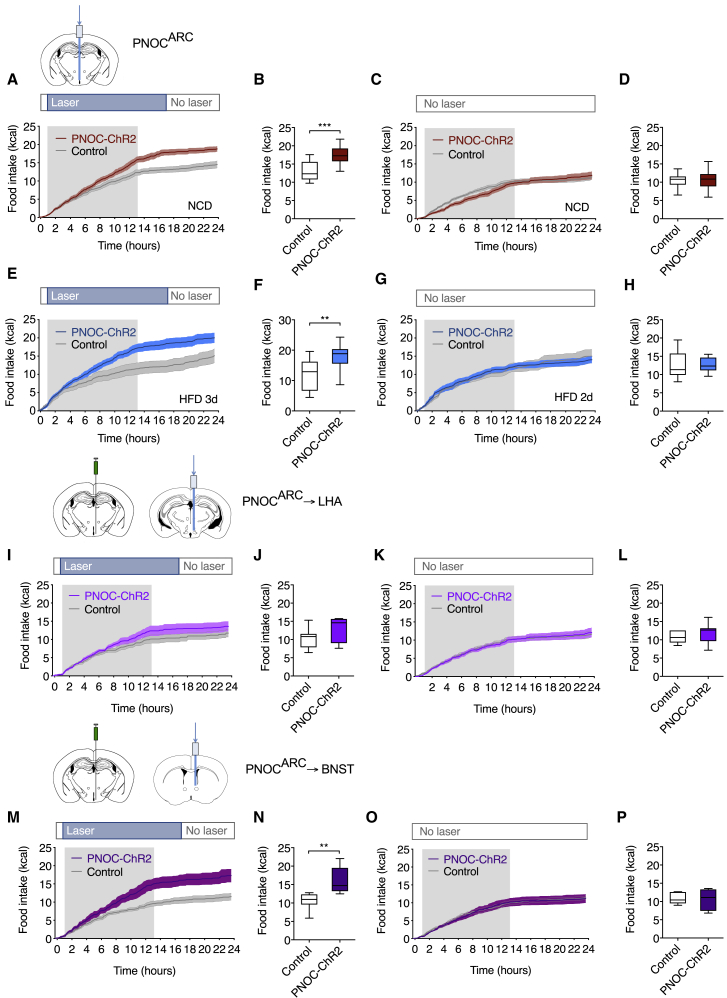
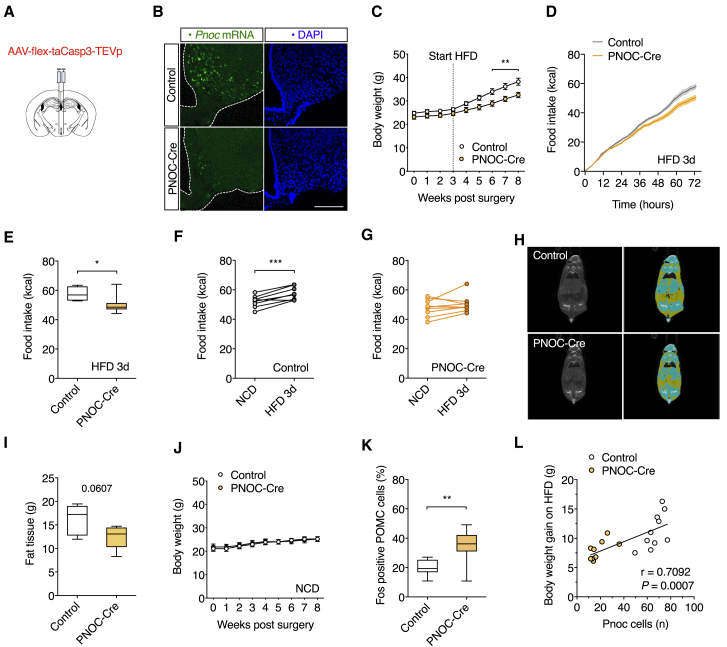
Calorie-rich diets induce hyperphagia and promote obesity, although the underlying mechanisms remain poorly defined. We find that short-term high-fat-diet (HFD) feeding of mice activates prepronociceptin (PNOC)-expressing neurons in the arcuate nucleus of the hypothalamus (ARC). PNOCARC neurons represent a previously unrecognized GABAergic population of ARC neurons distinct from well-defined feeding regulatory AgRP or POMC neurons. PNOCARC neurons arborize densely in the ARC and provide inhibitory synaptic input to nearby anorexigenic POMC neurons. Optogenetic activation of PNOCARC neurons in the ARC and their projections to the bed nucleus of the stria terminalis promotes feeding. Selective ablation of these cells promotes the activation of POMC neurons upon HFD exposure, reduces feeding, and protects from obesity, but it does not affect food intake or body weight under normal chow consumption. We characterize PNOCARC neurons as a novel ARC neuron population activated upon palatable food consumption to promote hyperphagia.

Keywords: PNOC neurons; acute high-fat-diet feeding; arcuate nucleus; food intake; hypothalamus; neuropeptide; nociceptin; obesity; orphanin FQ; prepronociceptin.


Conflict of interest statement

Declaration of Interests The authors declare no competing interests.

Figures

None
Graphical abstract
Figure 1
Figure 1
PNOCARC Neurons Are Activated upon Short-Term HFD Feeding (A) RNA sequencing (RNA-seq) profiling of gene expression after 3 days of NCD or HFD feeding using phosphoribotrap. Fold enrichment (IP/input) for each condition is shown. (B) Fold enrichment in IP/input HFD versus IP/input NCD and statistical significance are shown. (C) Pnoc mRNA fold expression (IP/input) and Pnoc mRNA expression (IP) for NCD-fed (n = 3) and HFD-fed (n = 4) mice. (D) Hypothalamic Pnoc expression in PNOC-EGFP mice. (E) Quantification of pS6 expression in PNOCARC neurons in PNOC-EGFP mice after 3 days of NCD or HFD (n = 4/4) feeding. (F) Representative pS6 stainings of the ARC of PNOC-eGFP mice after 3 days of NCD or HFD feeding. Scale bar, 200 μm. (G) Representative traces of spontaneous firing from original recordings of PNOCARC neurons from NCD- and HFD-fed mice. (H) Action potential firing frequencies and percentage of spontaneously active and silent (<0.5 Hz) PNOCARC neurons from NCD-fed (n = 88) and HFD-fed (n = 28) mice. Empty and filled bars represent active and silent cells, respectively. Absolute numbers of neurons are indicated. (I) Input resistance of PNOCARC neurons from NCD-fed (n = 50) and HFD-fed (n = 24) mice. (J) Representative traces illustrating the application of a ramp stimulus protocol to assess excitability in PNOCARC neurons from NCD-fed and HFD-fed mice. (K) Threshold current determined by the ramp protocols in (J) of PNOCARC neurons from NCD-fed (n = 36) and HFD-fed (n = 23) mice. (L) Total number of action potentials elicited upon ramp current injection in PNOCARC neurons from NCD-fed (n = 36) and HFD-fed (n = 23) mice. (M) Quantification of Fos-positive PNOCARC neurons (fasted: n = 4/4, refed: n = 5/5). (N) Quantification of Fos-positive AgRP neurons (fasted: n = 4/4, refed: n = 5/5). p < 0.05, ∗∗p < 0.01, and ∗∗∗p < 0.001 as determined by Mann-Whitney test (H, left; I; and K), Fisher test (H, right), 2-tailed, unpaired Student’s t test (C, E, and L), and mixed-effects analysis followed by Sidak’s multiple comparisons test (M and N). See also Figure S1 and Table S1.
Figure 2
Figure 2
PNOCARC Neurons Are GABAergic and Distinct from POMC or AgRP Neurons (A) RNA-seq profiling of hypothalamic tissue of PNOC-L10a-EGFP mice using BAC-TRAP. Fold enrichment in IP/input (x axis) and statistical significance (y axis) are shown (NCD-fed mice). (B) Expression profiling of GABAergic marker genes in PNOC neurons using BAC-TRAP. (C) Overlap of Pnoc mRNA with neuronal clusters obtained from single-cell RNA-seq of ARC neurons (Campbell et al., 2017). (D) Representative confocal images and quantification of in situ hybridization of mRNA of Pnoc (cyan) and Slc32a1 (gray) in the ARC of C57BL/6N mice (n = 4). Scale bar, 200 μm. (E) Representative confocal images and quantification of in situ hybridization of mRNA of Pnoc (cyan), Agrp (yellow), and Pomc (magenta) in the ARC of C57BL/6N mice (n = 5 for Agrp quantification, n = 6 for Pomc quantification). Scale bar, 200 μm. (F) Representative confocal images and quantification of in situ hybridization of mRNA of Pnoc (cyan) and Th (blue) in the ARC of C57BL/6N mice (n = 4). Scale bar, 200 μm. (G) Original traces illustrating inward rectification of a PNOCARC neuron upon hyperpolarizing current injections. (H) Quantification of inward rectification to 5 consecutive stimuli as illustrated by the non-linear relationship (solid red line) compared to a theoretical linear ohmic relationship (dashed black line). (I) Original examples of hyperpolarizations illustrating the inward rectification in PNOCARC and the lack of inward rectification in POMC and AgRP neurons. (J) Percentage of neurons with inward rectification upon hyperpolarization in PNOCARC (n = 28), POMC (n = 27), and AgRP neurons (n = 14) of NCD-fed mice. See also Figure S2.
Figure 3
Figure 3
PNOCARC Neurons Are Regulated by Extracellular Glucose (A) Original recording and corresponding rate histogram of a PNOCARC neuron from a NCD-fed mouse treated with a decreased concentration of extracellular glucose (5–0.1 mM). Numbered arrows mark the sections of the recording that are displayed in a higher time resolution. (B) Normalized frequency and absolute membrane potential (inset) of PNOCARC neurons, illustrating a concentration-response relationship and responses to extracellular glucose concentrations ranging from 5 to 0.1 mM. The representative recordings and corresponding rate histograms illustrate the responses to 3, 1.5, and 0.1 mM, respectively. The numbers above the circles represent the number of experiments. (C) Membrane potential under control (5 mM) and low glucose (0.1 mM) conditions of PNOCARC neurons of NCD-fed mice (dashed black lines mark single experiments; n = 13). (D) Attenuated responsiveness to decreases in extracellular glucose to 0.1 mM. Original recording and corresponding rate histogram of a PNOCARC neuron from HFD-fed mice treated with decreased extracellular glucose (0.1 mM). Numbered arrows mark the sections of the recording that are displayed in higher time resolution. (E) Membrane potential under control (5 mM) and low glucose (0.1 mM) conditions of PNOCARC neurons of HFD-fed mice (dashed black lines mark single experiments; n = 23). (F) Mean change of the membrane potential upon treatment with low glucose in PNOCARC neurons of NCD-fed (n = 13) and HFD-fed mice (n = 23). (G) Original recording and corresponding rate histogram of a PNOCARC neuron treated with 100 nM leptin. Numbered arrows mark the sections of the recording that are displayed in a higher time resolution. (H) Effect of leptin treatment (100 nM) on action potential frequency of PNOCARC neurons. (I) Percentage of hyperpolarized, depolarized, and non-responsive neurons. p < 0.05, ∗∗p < 0.01, and ∗∗∗p < 0.001 as determined by Mann-Whitney test (C and E), and 2-tailed, unpaired Student’s t test (F) or by 2-tailed, paired Student’s t test (H). See also Figure S3.
Figure 4
Figure 4
PNOC Signaling Mediates Acute Hyperphagia and Initial Body Weight Gain upon HFD Feeding (A) Schematic diagram of the PNOC-Cre allele. (B) Representative confocal images of in situ hybridization of mRNA of Pnoc (cyan), endogenous Cre-driven ZsGreen fluorescence (yellow), and Agrp mRNA (cyan) in the ARC of PNOC-Cre::ZsGreen floxed mice. Scale bar, 200 μm. (C) Body weights of PNOC-Cre mice (PNOC-Crewt/wt, PNOC-Cretg/wt, and PNOC-Cretg/tg) during HFD feeding (n = 15/12/9, 2-way repeated measures [RM] ANOVA with Sidak’s multiple comparisons test). (D) Percentage of weekly body weight gain on HFD compared to Pnoc wild-type (WT) mice (n = 15/12/9, 2-way RM ANOVA followed by Sidak’s multiple comparisons test). (E) Cumulative food intake on NCD. (F) Total food intake on NCD. (n = 5/5/5, 1-way ANOVA followed by Tukey’s post hoc test). (G) Cumulative food intake during 3 days of HFD feeding. (H) Total food intake during 3 days of HFD feeding (n = 5/5/5, 1-way ANOVA followed by Tukey’s post hoc test). (I) Cumulative food intake after 4 weeks on HFD. (J) Total food intake after 4 weeks of HFD feeding (n = 5/5/5, 1-way ANOVA followed by Tukey’s post hoc test). (K) Fat mass of Pnoc WT, Pnoc HET and Pnoc KO mice after 4 weeks of HFD (n = 6/5/6, 1-way ANOVA followed by Tukey’s post hoc test). (L) Representative images of computed tomography (CT) scans of Pnoc WT, Pnoc HET, and Pnoc KO mice after 4 weeks of HFD. Yellow, fat tissue; blue, non-adipose soft tissue. p < 0.05, ∗∗p < 0.01, and ∗∗∗p < 0.001. See also Figure S4.
Figure 5
Figure 5
PNOCARC Neurons Densely Innervate the ARC and Monosynaptically Inhibit POMC Neurons (A) Injection of AAV-ChR2-mCherry into the ARC. Cre-dependent ChR2 expression in neuronal projections (ChR2-mCherry) of PNOC-Cre, Agrp-Cre, and Pomc-Cre mice (n = 4). (a) ARC, (b) anterior bed nucleus of the stria terminals (BNST), (c) paraventricular nucleus of the hypothalamus (PVN), (d) lateral hypothalamic area (LHA)/dorsal premammillary nucleus (PMD), and (e) dorsal raphe nucleus (DR). Scale bar, 200 μm. (B) Schematic (left) and representative traces of light-evoked IPSCs recorded from POMC neurons in PNOC-Cre::POMC-IRES-EGFP mice expressing ChR2 in PNOCARC neurons (n = 12). (C) Schematic (top) and representative traces of sIPSCs recorded from POMC neurons in POMC-IRES-EGFP mice. (D and E) Frequency (D) and amplitude (E) of sIPSCs in POMC neurons from NCD-fed (n = 18) or HFD-fed (n = 21) mice. p < 0.05, ∗∗p < 0.01, and ∗∗∗p < 0.001 as determined by 2-tailed, unpaired Student’s t test. See also Figure S5.
Figure 6
Figure 6
Optogenetic PNOCARC Neuron Activation Promotes Feeding Data are plotted as cumulative food intake over time and total food intake after the stimulation period (16 h). (A) Cumulative food intake with photostimulation on NCD (n = 12/11). (B) Total food intake on NCD. (C) Cumulative food intake without photostimulation on NCD (n = 12/11). (D) Total food intake without photostimulation on NCD. (E) Cumulative food intake with photostimulation after 3 days of HFD feeding (n = 11/11). (F) Total food intake (3 days of HFD feeding). (G) Cumulative food intake without stimulation after 2 days of HFD feeding (n = 11/11). (H) Total food intake without stimulation (2 days of HFD feeding). (I) Cumulative food intake with photostimulation of PNOCARC-LHA projections (NCD, n = 6/7). (J) Total food intake (PNOCARC-LHA projections). (K) Cumulative food intake without photostimulation of PNOCARC-LHA projections (n = 6/7). (L) Total food intake without photostimulation (PNOCARC-LHA projections). (M) Cumulative food intake with photostimulation of PNOCARC-BNST projections (NCD, n = 6/7). (N) Total food intake (PNOCARC-BNST projections). (O) Cumulative food intake without photostimulation of PNOCARC-BNST projections (n = 6/7). (P) Total food intake without photostimulation (PNOCARC-BNST projections). p < 0.05, ∗∗p < 0.01, and ∗∗∗p < 0.001 as determined by 2-tailed, unpaired Student’s t test. See also Figure S6.
Figure 7
Figure 7
Ablation of PNOCARC Neurons Protects from HFD-Induced Obesity (A) Injection of AAV-flex-taCasp3-TEVp into the ARC of PNOC-Cre and littermate WT control animals. (B) Representative confocal images of in situ hybridization of Pnoc mRNA (green) and DAPI staining (blue). Scale bar, 200 μm. (C) Body weight of PNOCARC ablated mice. Mice were fed an HFD after 3 weeks postsurgery (n = 10/9). (D) Cumulative food intake during 3 days of HFD feeding (n = 8/9). (E) Total food intake after 3 days of HFD feeding (n = 8/9). (F) Food intake of AAVCasp-injected control animals on NCD and after 3 days of HFD feeding (n = 8/9). (G) Food intake of AAVCasp-injected PNOC-Cre mice on NCD and after 3 days of HFD feeding (n = 8/9). (H) Representative images of CT scans of AAVCasp-injected PNOC-Cre mice and control animals after 5 weeks of HFD. Yellow, fat tissue; blue, non-adipose soft tissue. (I) Fat mass of AAVCasp-injected PNOC-Cre mice and control animals after 5 weeks of HFD (n = 6/5). (J) Body weight of PNOCARC ablated mice. Mice were fed a NCD postsurgery (n = 9/8). (K) Quantification of Fos-positive POMC neurons after 5 weeks of HFD feeding (n = 10/9). (L) Correlation of body weight gain during 5 weeks of HFD feeding and the average number of Pnoc neurons per section and hemisphere (Pearson correlation is reported, n = 10/9). p < 0.05, ∗∗p < 0.01, and ∗∗∗p < 0.001 as determined by 2-way RM ANOVA with Sidak’s multiple comparisons test (C and J), by 2-tailed, unpaired Student’s t test (E–G, I, and K). To assess the correlation between 2 variables, Pearson’s correlation coefficient for normally distributed data was used (L). See also Figure S7.

References

    1. Atasoy D., Aponte Y., Su H.H., Sternson S.M. A FLEX switch targets Channelrhodopsin-2 to multiple cell types for imaging and long-range circuit mapping. J. Neurosci. 2008;28:7025–7030. - PMC - PubMed
    1. Backes H., Walberer M., Endepols H., Neumaier B., Graf R., Wienhard K., Mies G. Whiskers area as extracerebral reference tissue for quantification of rat brain metabolism using (18)F-FDG PET: application to focal cerebral ischemia. J. Nucl. Med. 2011;52:1252–1260. - PubMed
    1. Balthasar N., Coppari R., McMinn J., Liu S.M., Lee C.E., Tang V., Kenny C.D., McGovern R.A., Chua S.C., Jr., Elmquist J.K., Lowell B.B. Leptin receptor signaling in POMC neurons is required for normal body weight homeostasis. Neuron. 2004;42:983–991. - PubMed
    1. Baver S.B., Hope K., Guyot S., Bjørbaek C., Kaczorowski C., O’Connell K.M. Leptin modulates the intrinsic excitability of AgRP/NPY neurons in the arcuate nucleus of the hypothalamus. J. Neurosci. 2014;34:5486–5496. - PMC - PubMed
    1. Belgardt B.F., Okamura T., Brüning J.C. Hormone and glucose signalling in POMC and AgRP neurons. J. Physiol. 2009;587:5305–5314. - PMC - PubMed

Publication types

MeSH terms