. 2020 Apr 16;181(2):306-324.e28.
doi: 10.1016/j.cell.2020.03.050.

Competing Protein-RNA Interaction Networks Control Multiphase Intracellular Organization

Affiliations

Competing Protein-RNA Interaction Networks Control Multiphase Intracellular Organization

David W Sanders et al. Cell. .

Abstract

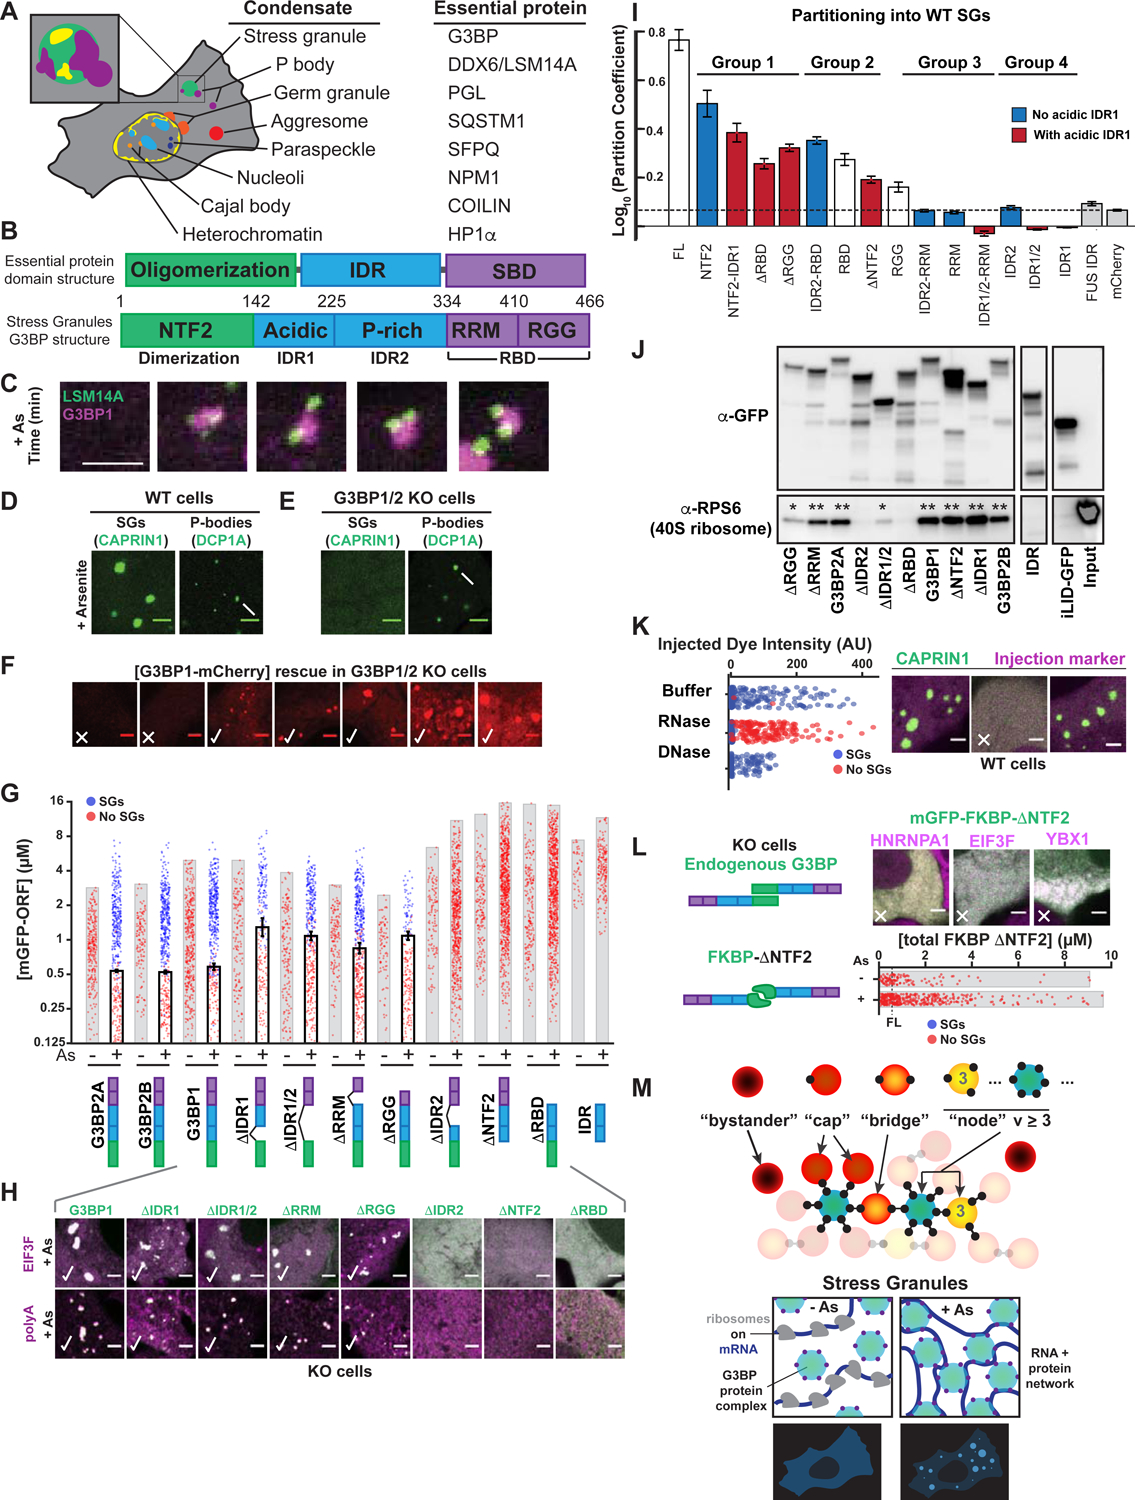
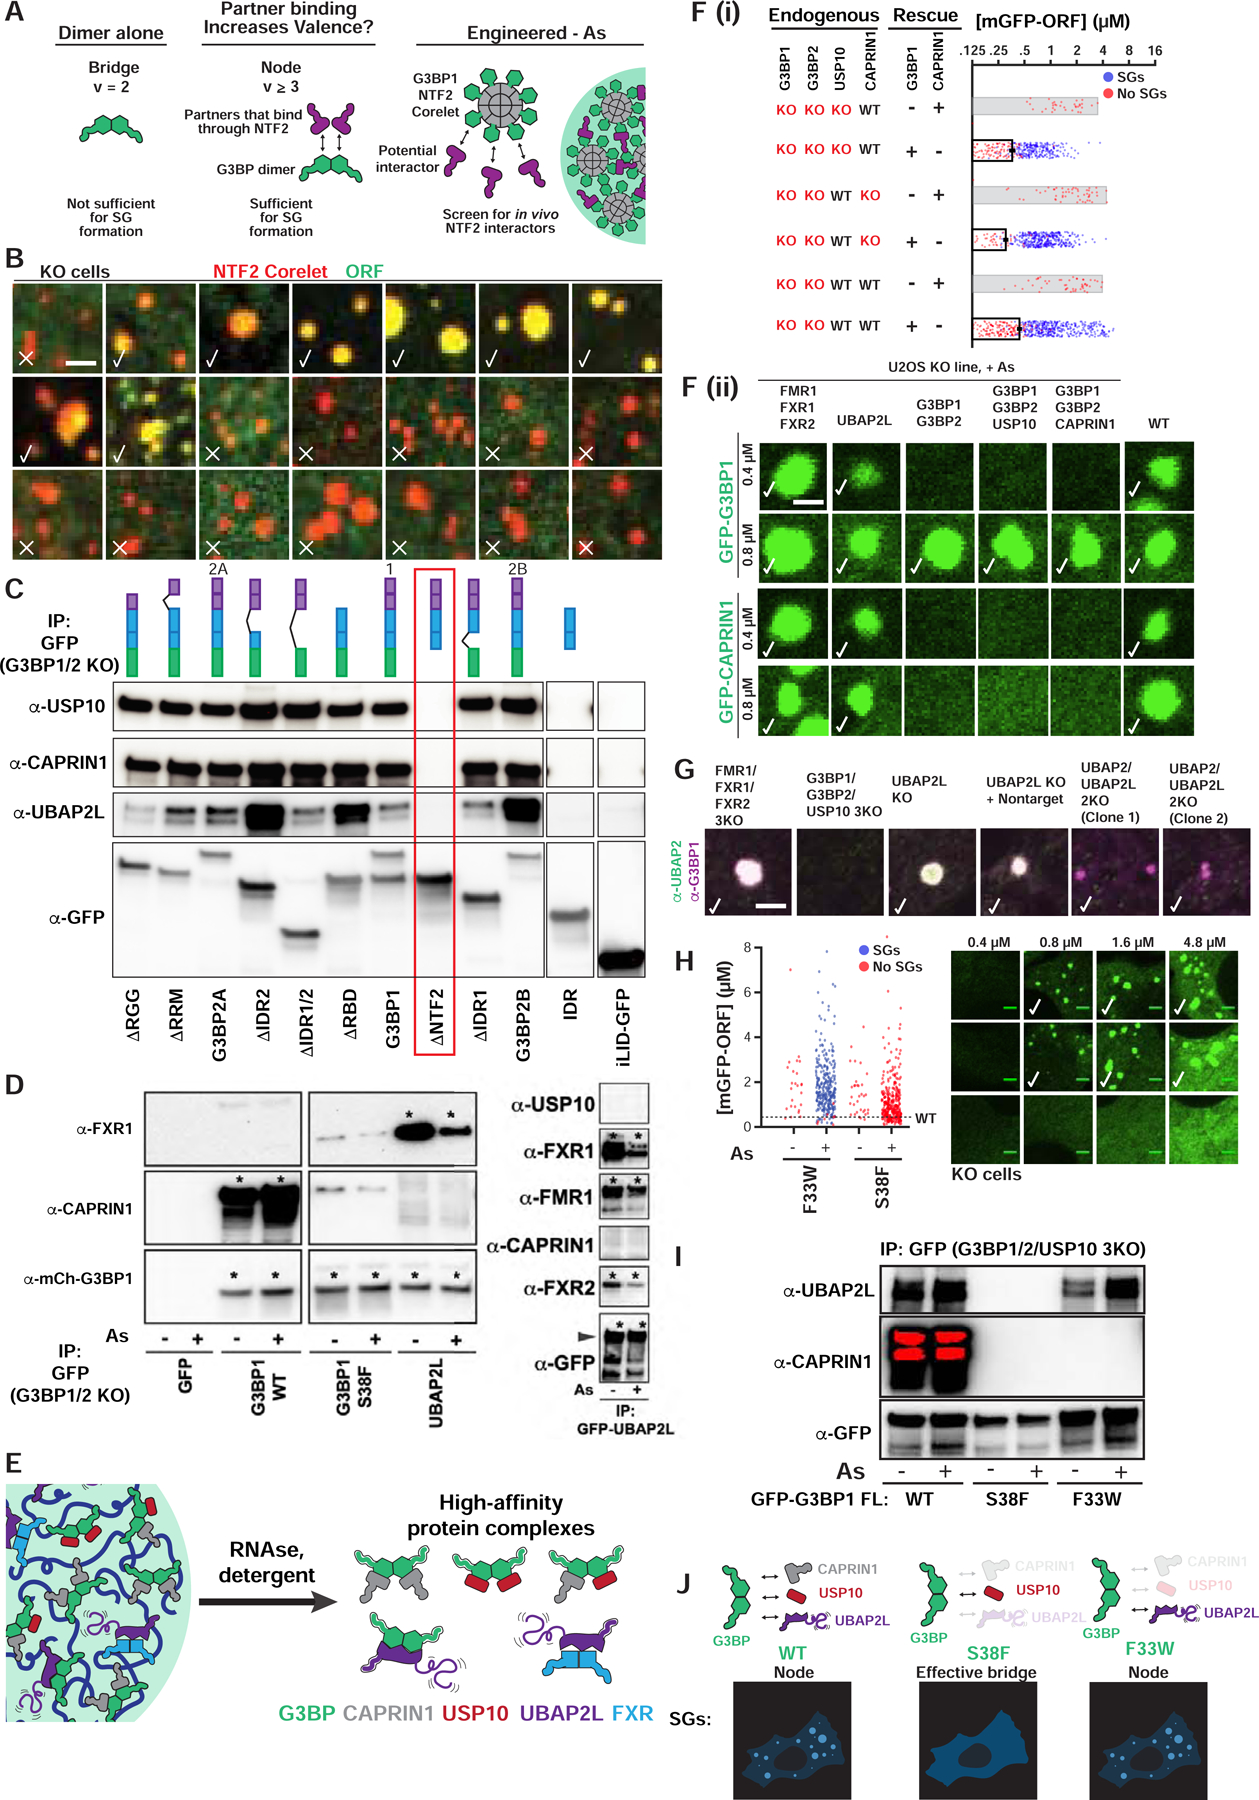
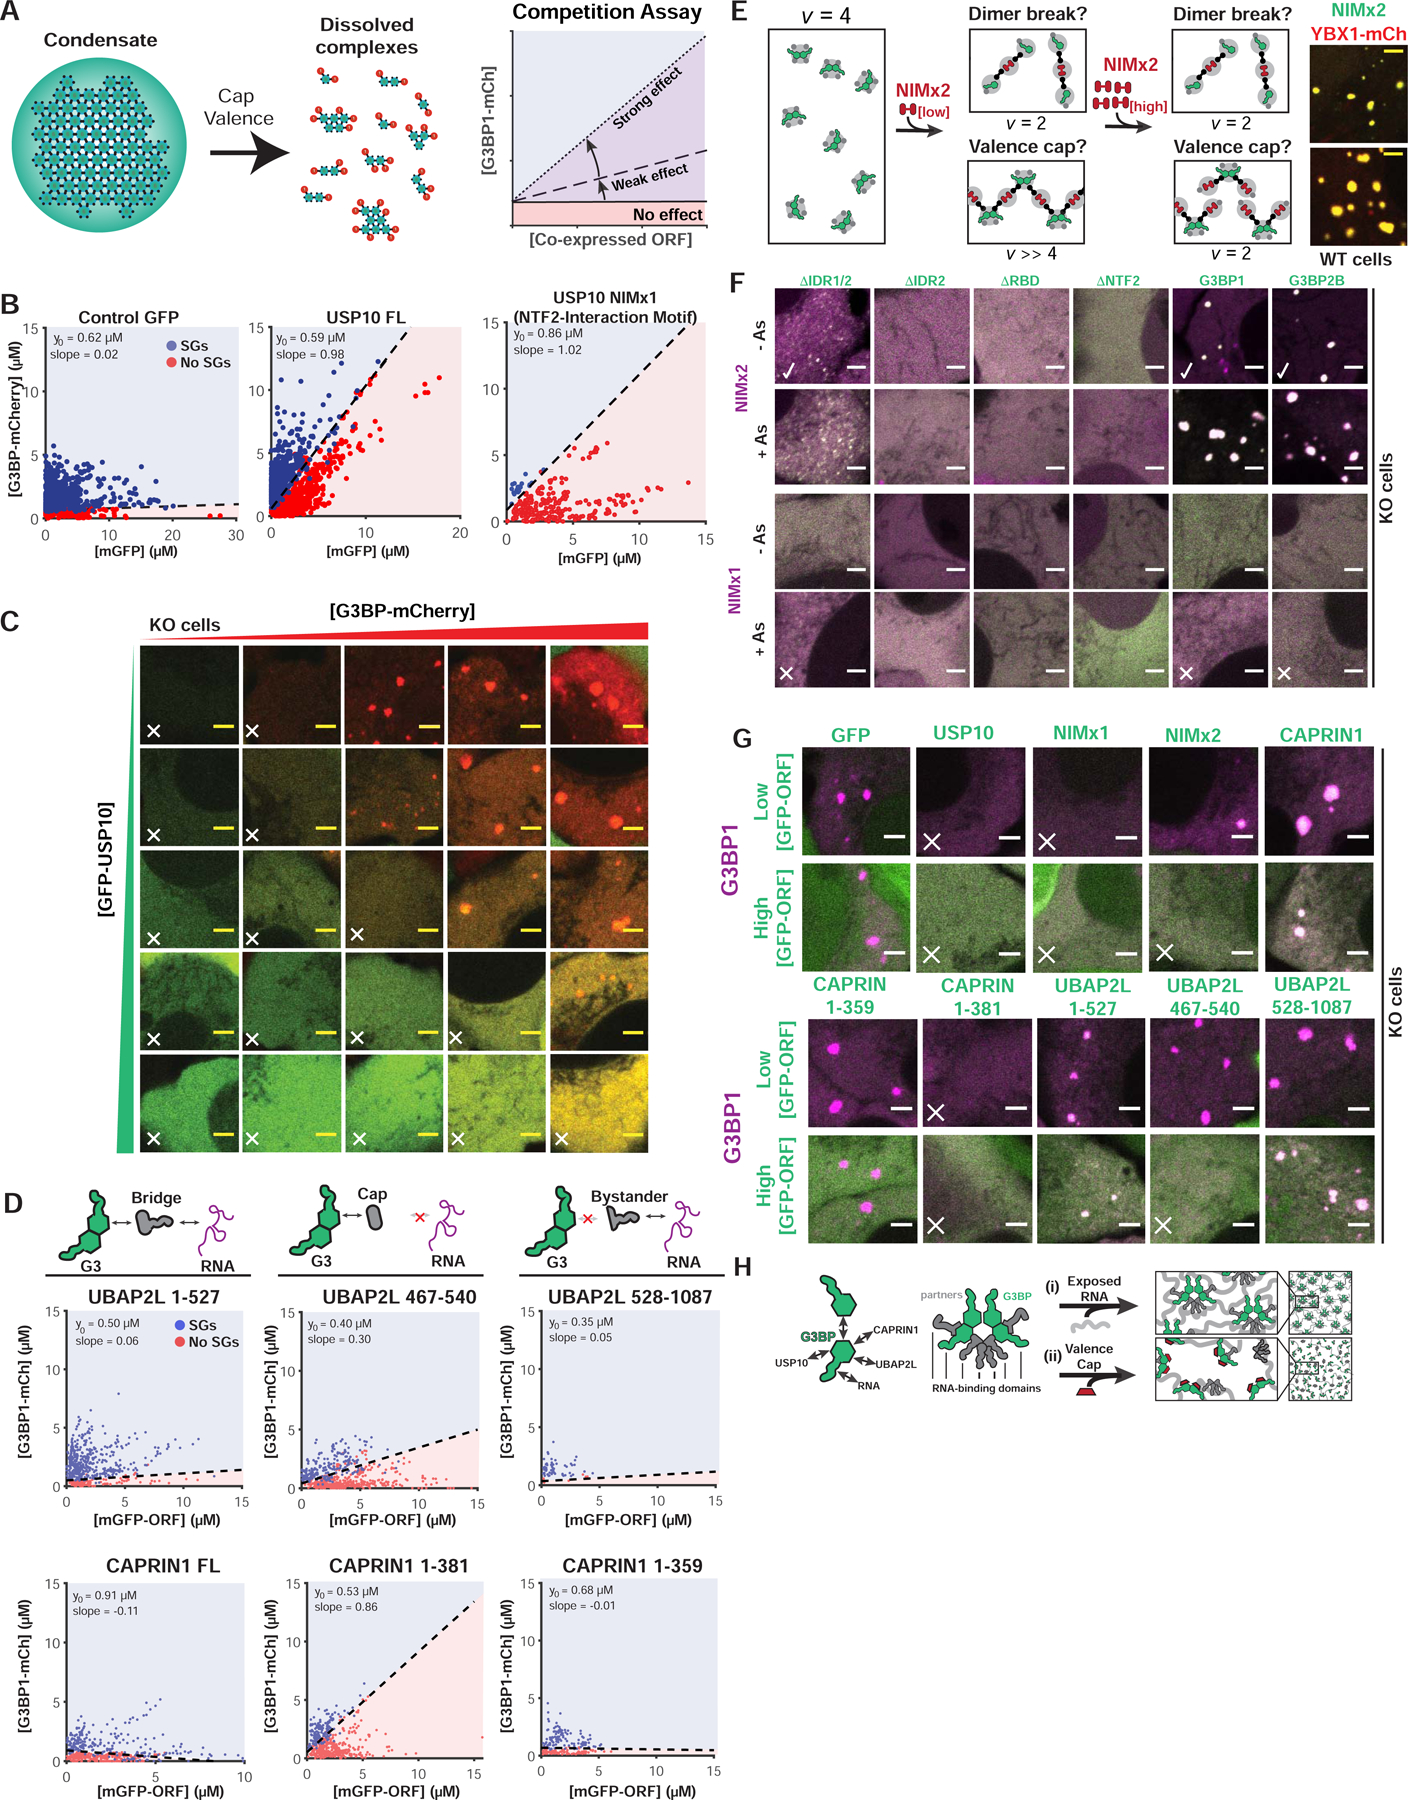
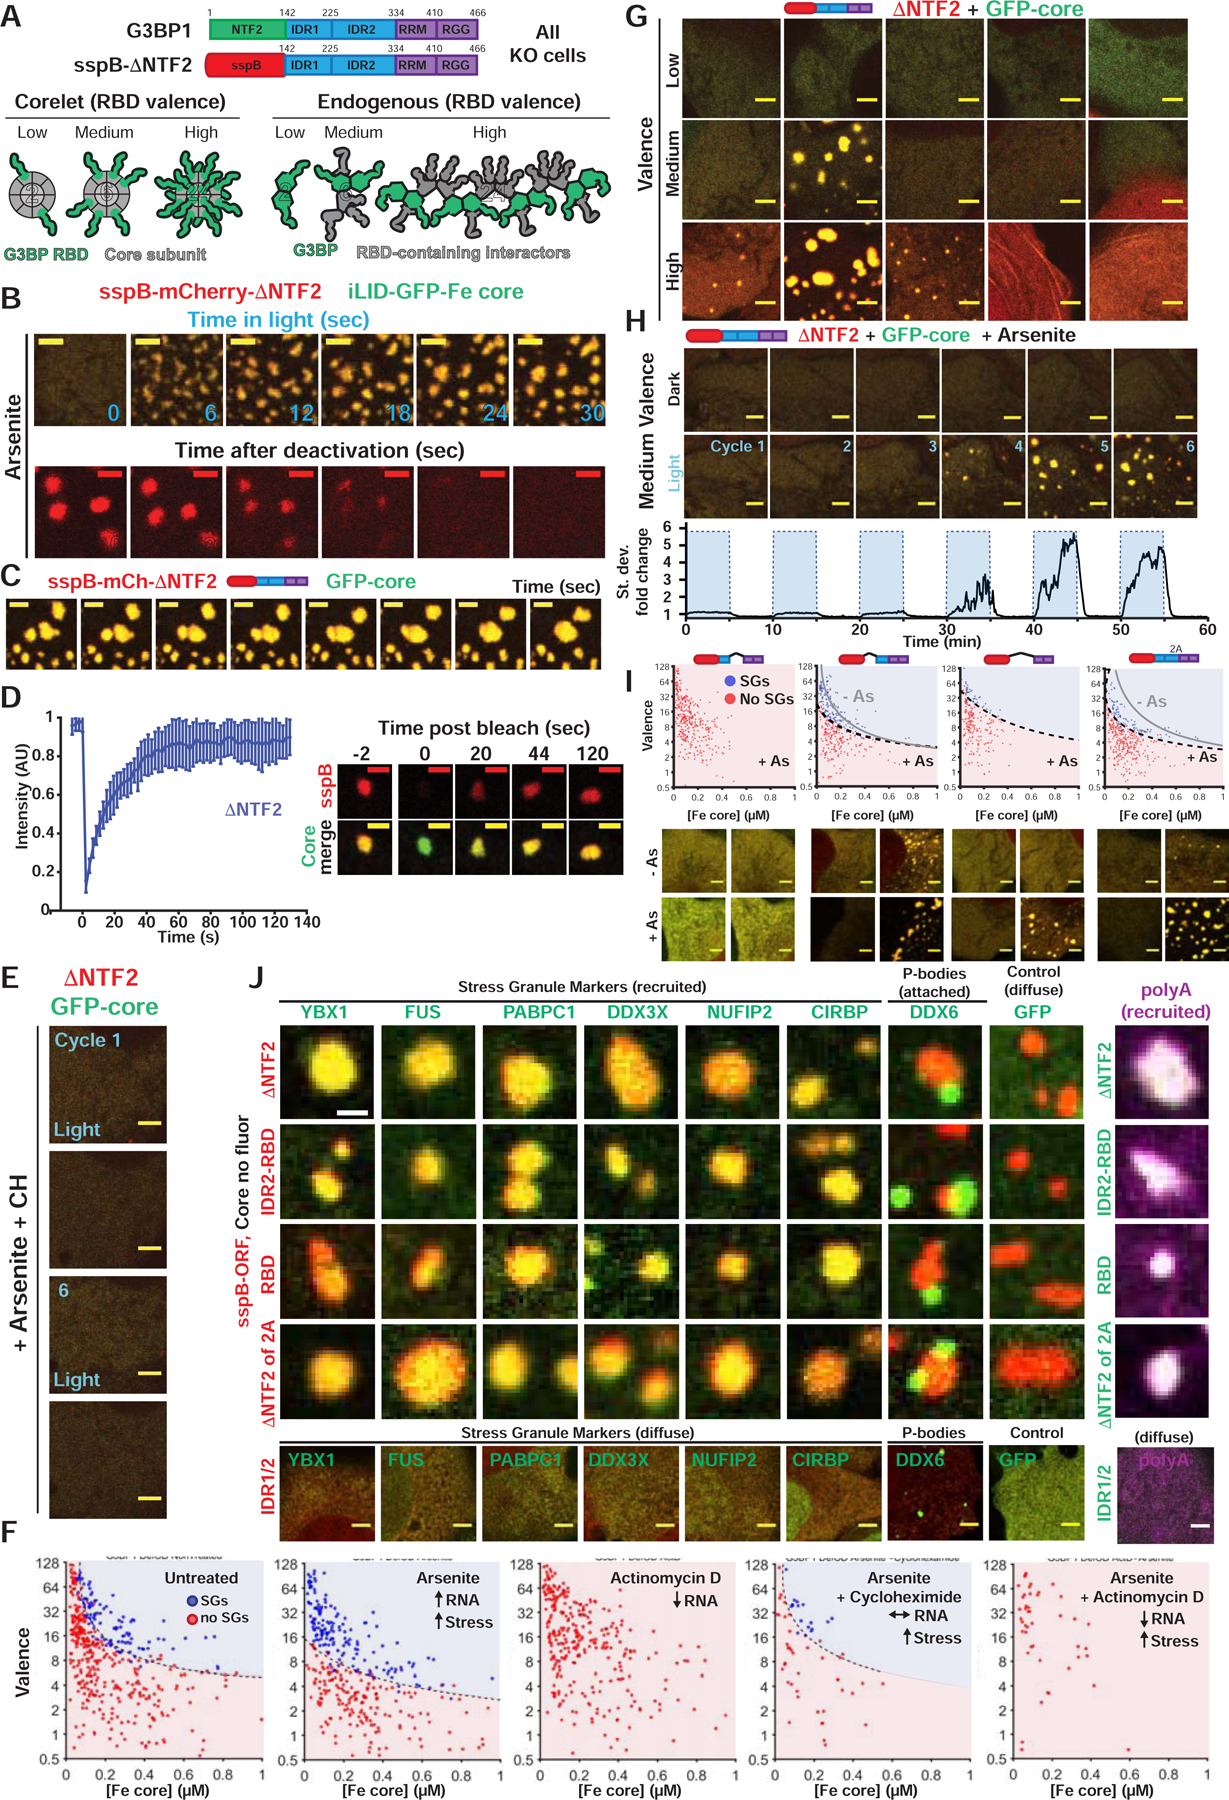
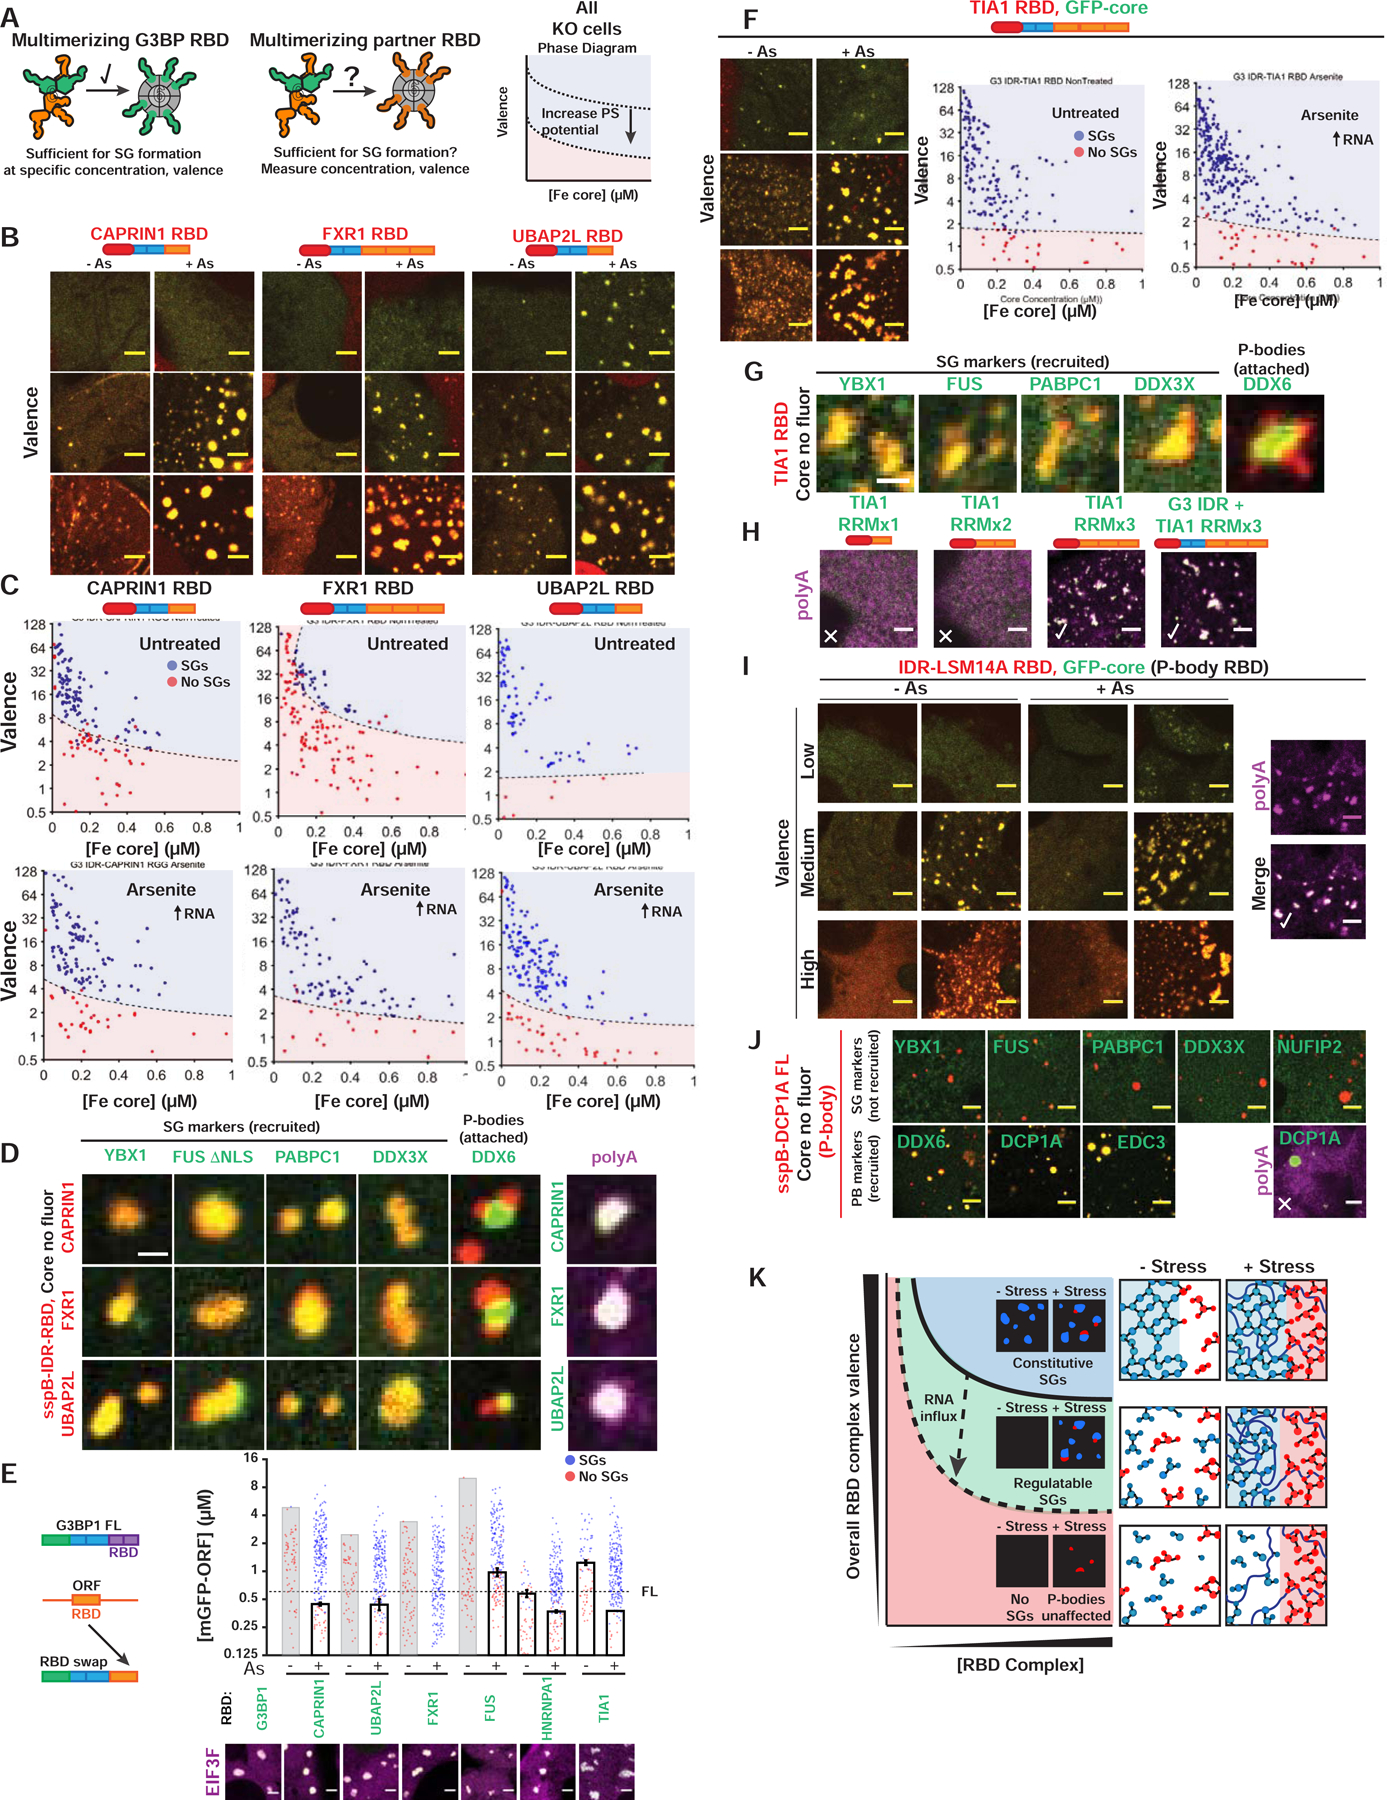
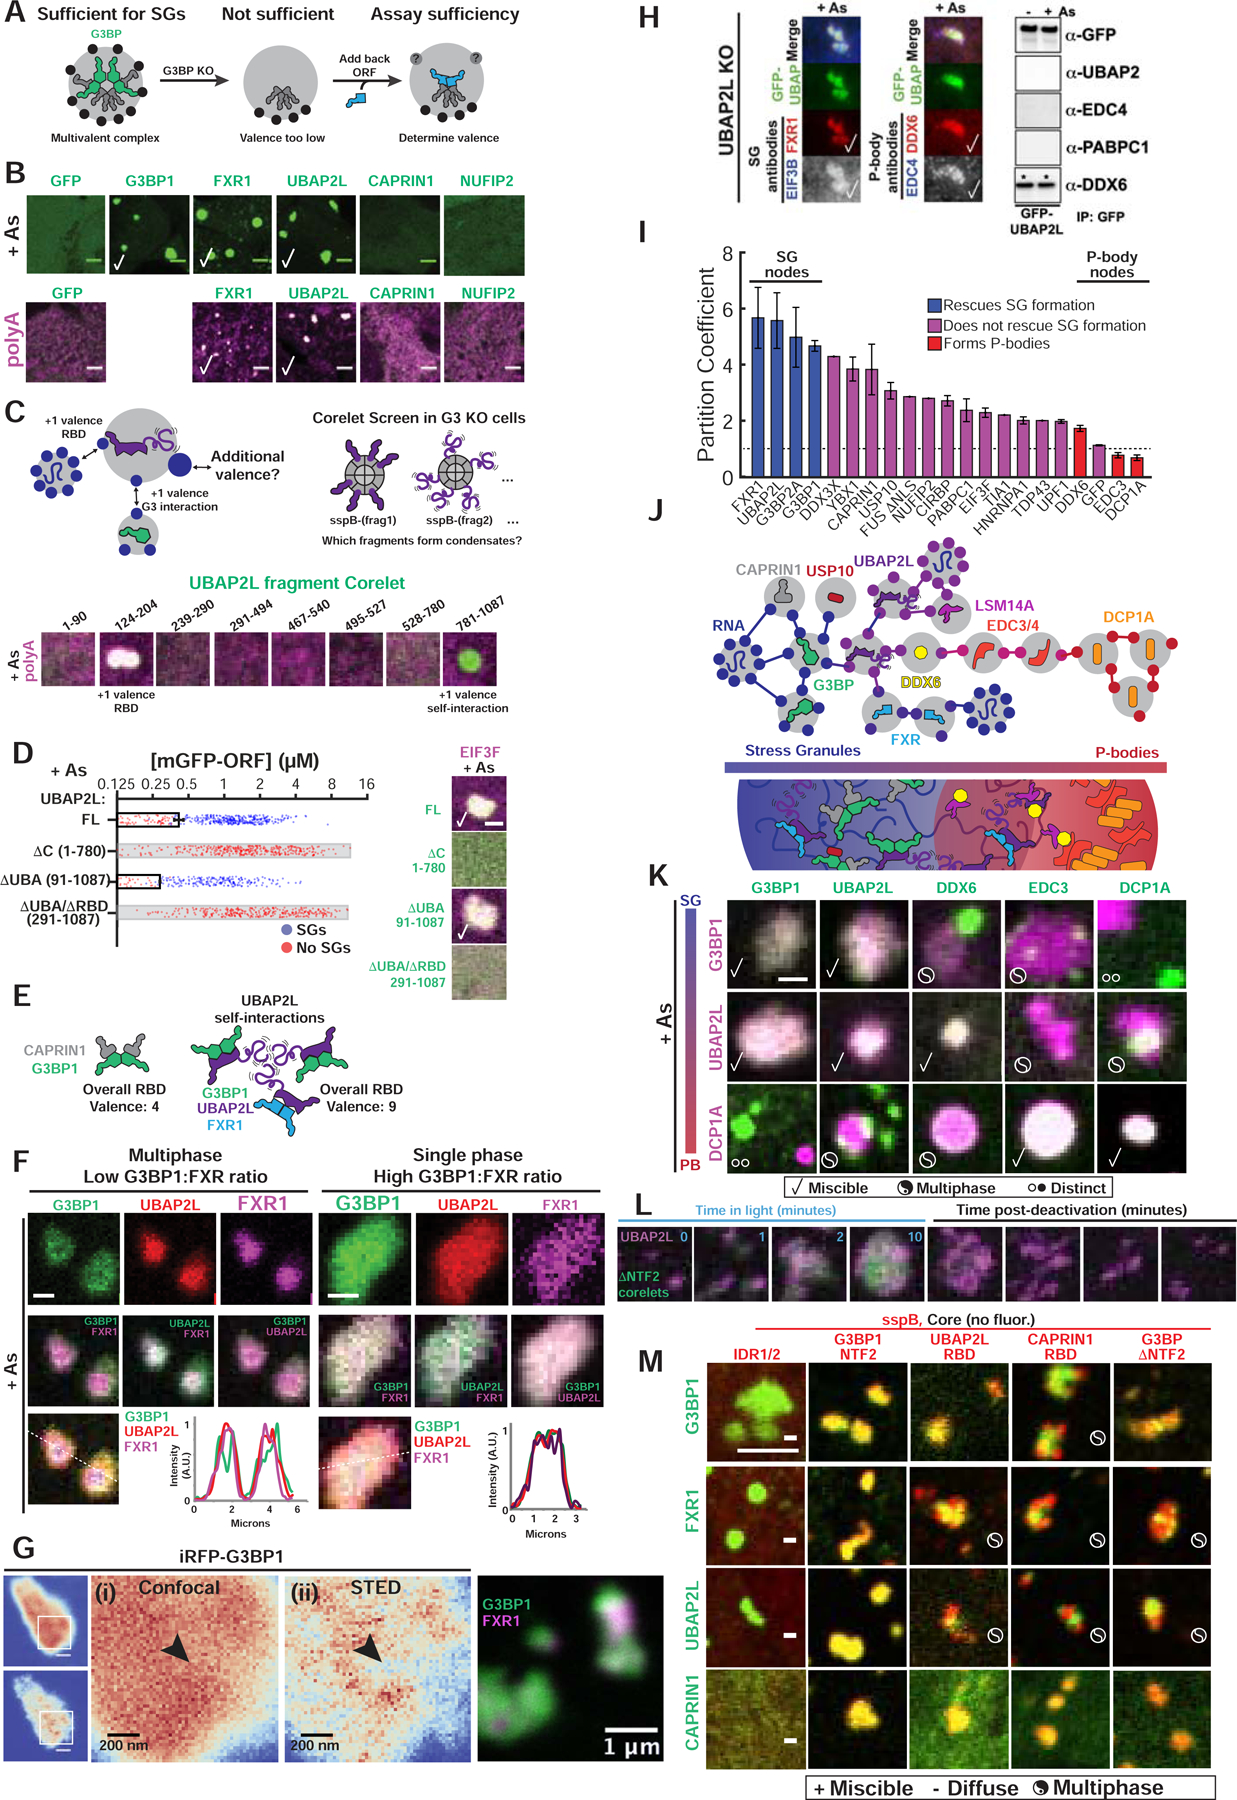
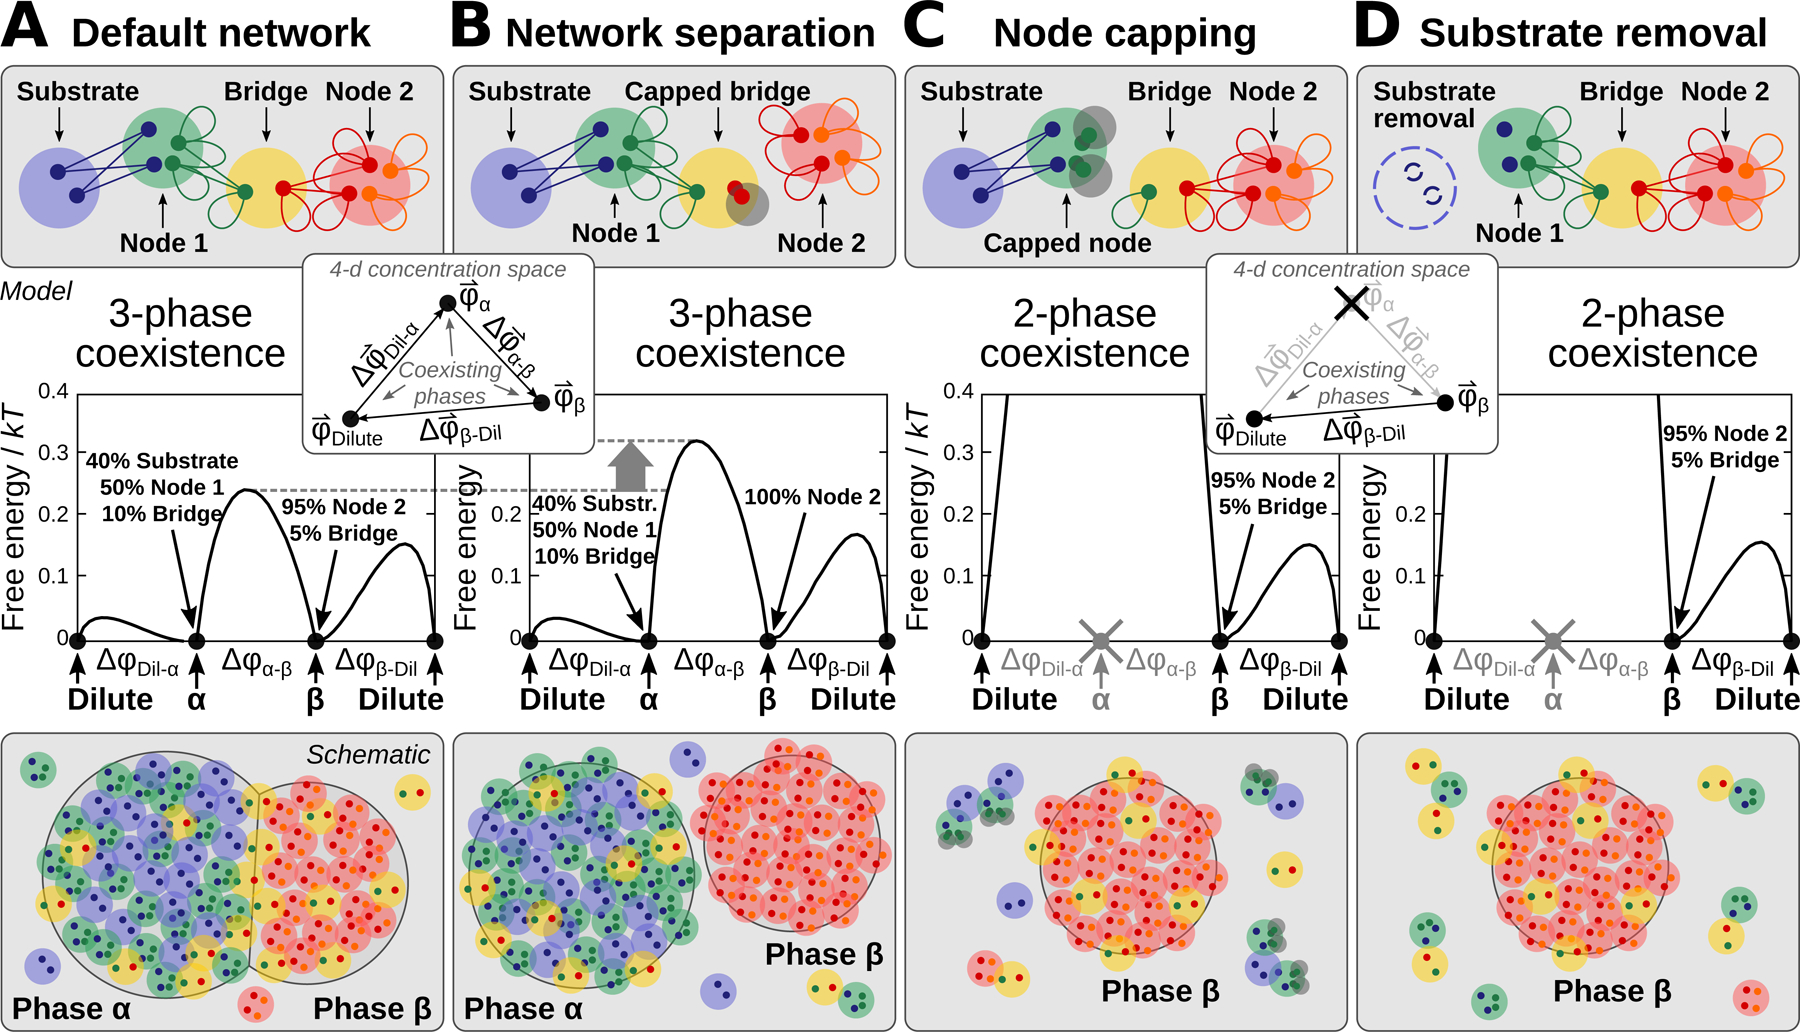
Liquid-liquid phase separation (LLPS) mediates formation of membraneless condensates such as those associated with RNA processing, but the rules that dictate their assembly, substructure, and coexistence with other liquid-like compartments remain elusive. Here, we address the biophysical mechanism of this multiphase organization using quantitative reconstitution of cytoplasmic stress granules (SGs) with attached P-bodies in human cells. Protein-interaction networks can be viewed as interconnected complexes (nodes) of RNA-binding domains (RBDs), whose integrated RNA-binding capacity determines whether LLPS occurs upon RNA influx. Surprisingly, both RBD-RNA specificity and disordered segments of key proteins are non-essential, but modulate multiphase condensation. Instead, stoichiometry-dependent competition between protein networks for connecting nodes determines SG and P-body composition and miscibility, while competitive binding of unconnected proteins disengages networks and prevents LLPS. Inspired by patchy colloid theory, we propose a general framework by which competing networks give rise to compositionally specific and tunable condensates, while relative linkage between nodes underlies multiphase organization.

Keywords: G3BP; P-bodies; RNA binding; UBAP2L; USP10; condensates; membraneless organelles; multiphase; phase separation; stress granules.


Conflict of interest statement

Declaration of Interests Patent applications have been filed based on this work.

Figures

Figure 1.
Figure 1.. G3BP dimerization and RNA-binding are necessary but not sufficient for stress granule formation
(A) Essential proteins for condensates. Inset: P-bodies (PBs, purple) attach to stress granules (SGs, green) with sub-structure (yellow). (B) Top: Essential protein domain organization (IDR = intrinsically disordered region, SBD = substrate-binding domain). Bottom: G3BP SBD = RNA-binding domain (RBD), with Arg-Gly-Gly (RGG) region and RNA recognition motif (RRM). (C) U2OS cells treated with 400 μM arsenite (As) form SGs with attached PBs. Lentivirus-based stable protein expression used in all experiments. Unless noted: scale bar, 3 μm. (D) Wild-type (WT) cells (+As) with GFP-CAPRIN1 (SGs, arrowhead) or GFP-DCP1A (PBs, arrow). (E) Same as (D) but G3BP1/2 double KO (“G3BP KO”) cells. (F) Dose-response of SG rescue (yes = check, no = X) by G3BP1-mCherry (mCh) in G3BP KO cells (+As). (G) Quantification of GFP-G3BP concentration threshold for SGs in KO cells (EIF3F-mCh co-positivity, +/− As). Mean and SEM: n=4 experiments, 4 images per. All experiments: each dot = one cell analyzed. (H) Top: representative images for (G). Bottom: KO cells (+As) with GFP-G3BP1 deletions (Δs) were fixed followed by oligo-dT RNA-FISH to detect polyA+ mRNA (magenta) and SGs (check). (I) WT U2OS cells with CAPRIN1-GFP and mCh-tagged protein. SG partition coefficient (PC) mean and SEM: n=3 experiments (n>4 images per). Dashed line = PC of mCh control. (J) GFP-G3BP1 Δs were immunoprecipitated (IPed) from KO U2OS cells (-As) with anti (α)-GFP (then RNase and RIPA-wash) to isolate tightly-bound 40S ribosomes (* = low, ** = high RPS6). Representative blot (n=3 experiments). (K) WT U2OS cells with GFP-CAPRIN1 were injected with buffer, RNase, or DNase, and As-treated then SGs were assessed (n=3 experiments, >100 cells per). (L) G3BP KO cells (+As) with mCh SG proteins and GFP-FKBP-G3BP1ΔNTF2. Dashed line = rescue threshold for WT G3BP1. Images: ~8 μM GFP. X=no SGs. (M) Top: graph theory framework for network-based condensation. “Valence” (v) = “particle” (protein or protein complex) interaction sites: v=0 (bystander), v=1 (cap); v=2 (bridge), v>2 (node). Bottom: exposed RNA for G3BP complex-binding is low; following As, RNA is exposed (ribosomes disassemble), and condensation occurs if RNA-binding v of G3BP node is sufficiently high. See also Figure S1.
Figure 2.
Figure 2.. SG condensation requires G3BP-UBAP2L complexes
(A) Dimeric G3BP RBD bridges (v=2) are not sufficient for SGs; G3BP must act as node (v>2) via additional high-affinity protein-protein interactions (PPIs) with its NTF2 dimerization domain; right: live cell Corelet assay to screen for PPIs. (B) G3BP KO cells (No As) with G3BP NTF2 Corelets (red, sspB-mCh-G3BP1ΔRBD; no tag, iLID-Fe core) and GFP-tagged proteins (10-min activation). Checks = putative NTF2 partners/PPIs. (C) GFP-G3BP1Δs IPed from G3BP KO cells (No As) with α-GFP (then RNase and RIPA-wash) to isolate tightly-bound proteins. ΔNTF2 (red box) abolishes binding. Representative blot (n=3 experiments). (D) GFP-tagged proteins IPed similar to (C), but +/− As. Representative blot (n=3 experiments), * = high-affinity interaction. (E) High-affinity, RNA-independent complexes predicted by IPs. (F) Top (i): Quantification of GFP-G3BP concentration threshold for SGs in KO cells (+As). Mean and SEM: n=3 experiments (n>4 images per). Bottom (ii): KO cells with GFP-tagged protein at indicated concentration, check = SGs, check* = smaller SGs. (G) Panel of U2OS KO cells (+As) examined for SGs by immunofluorescence. Indicated: no SG defect (check), smaller SGs (check*), very small SGs in rare cells (check**). (H) Quantification of G3BP variant concentration threshold for SGs in G3BP KO cells (+/− As). Mean and SEM: n=3 experiments (>4 images per). Representative images at indicated concentrations (+As, check=SGs). (I) GFP-G3BP variants IPed similar to (D), but in G3BP1/2/USP10 3KO cells. Representative blot (n=3 experiments). (J) G3BP variants form complexes of different valence, which corresponds to ability to rescue SG defects. See also Figure S2.
Figure 3.
Figure 3.. Valence capping of the G3BP node by RBD-lacking binding partners prevents stress granule formation
(A) Interacting “caps” (v=1) are proposed to disrupt networks of high v particles. Right: SG rescue competition assay (G3BP KO cells) tests model by co-expressing GFP-tagged NTF2 partners (cap, positive slope) with G3BP1-mCh. (B) Competition assay for predicted caps in G3BP KO cells (+As). Indicated: y-intercept (G3BP rescue concentration, no competitor), best-fit slope demarcating +/− SG cells. (C) Representative images for (B, middle) at indicated protein concentrations (X, no SGs). (D) Competition assay similar to (B) with CAPRIN1/UBAP2LΔs. (E) NTF2-interacting motifs (NIMs) inhibit SGs by “dimer breaking” or “valence capping”, differentiable using a v=2 NIM bridge (“NIMx2”). If capping: low NIMx2 promotes condensation, polymerizing G3BP dimers (high vRBD); high, inhibits by saturation (vRBD=2). If breaking, low and high NIMx2 link G3BP monomers (vRBD=2). Right: GFP-NIMx2 induces SGs in WT U2OS (-As). (F) Representative images (X, inhibits SGs; check, promotes): G3BP KO cells (+/− As) expressing GFP-G3BPΔs and mCh-NIMx1 (or x2) (G) Images (X, inhibits SGs) for G3BP KO cells (+As) with mCh-G3BP1 and GFP-tagged protein (low or high levels). (H) Molecular model for SG regulation by NTF2 PPIs. See also Figure S3.
Figure 4.
Figure 4.. High valence G3BP RBD complexes are sufficient for stress granule formation with attached P-bodies
(A) Corelets allow optogenetic tuning of vRBD (0 to 24) on a 24-subunit Ferritin (Fe) core to mimic endogenous vRBD of G3BP complex. All Corelet experiments (unless noted): vRBD is denoted low (~2–4), medium (~6–8), or high (~18–24); core ~0.25 μM; cells = G3BP KO U2OS. (B) Reversible G3BP1ΔNTF2 Corelets after 1-hour As. Indicated: seconds after oligomerization (+blue light) or monomerization (-blue light), scale bar = 3 μm in all images unless noted. (C) ΔNTF2 Corelets fuse and relax to a sphere following As, activation (3-min). Scale bar, 2 μm. (D) FRAP of ΔNTF2 Corelets (+As). Intensity relative to fluorescence before granule bleach. Mean and SEM: n=8 experiments. Representative images shown, scale bar = 2 μm. (E) ΔNTF2 Corelet cells (medium v) treated with cycloheximide (CH) then As (six 10-min cycles: 5-min activate, 5-min deactivate). Images: after cycle. (F) Intracellular ΔNTF2 Corelet phase diagrams for drugs that alter available RNA. Each dot = single cell (5-min activation), best-fit phase threshold shown. (G) Representative images for (F). (H) Similar to (E) but no CH. Standard deviation of pixel intensity relative to first image shown. (I) Similar to (F) but for additional Δs (+/− As; dots shown for +As). Representative images for high v cells. (J) GFP-tagged proteins co-expressed with indicated G3BP Corelets (iLID-Fe lacks GFP tag). Following As and 10-min activation, cells were fixed; arrowheads, PBs attached to SGs. Right: oligo-dT RNA FISH (Corelet, green; polyA+ RNA, magenta). See also Figure S4.
Figure 5.
Figure 5.. Stress granules with attached P-bodies are the default multiphase condensate encoded by high valence RBD nodes
(A) Corelet assay to test whether NTF2 partners contribute vRBD to G3BP complex. (B) Valence-dependent condensation (+/−As) examined for indicated RBDs fused to G3BP IDR in Corelet system (images correspond to (C)). All Corelet experiment images (unless noted): vRBD is noted low (~2–4), medium (~6–8), or high (~18–24); core ~0.25 μM; cells = G3BP KO U2OS; scale bar = 3 μm. (C) Intracellular phase diagrams for RBDs in (B) +/− As. Each dot = single cell (5-min activation), best-fit phase threshold shown. (D) GFP-tagged proteins expressed with indicated RBD Corelets (iLID-Fe lacks GFP tag). Following As and 10-min activation, cells were fixed; arrowheads, PBs attached to SGs. Right: oligo-dT RNA FISH. (E) SG rescue threshold for GFP-tagged chimeric G3BP1 with swapped RBDs (G3BP KO cells with EIF3F-mCh, representative images below). Mean and SEM: n=4 experiments (>4 images per). (F) Similar to (B,C) but with TIA1 RBD Corelets. (G) Similar to (D) but with TIA1 RBD Corelets. (H) Similar to (D) but with TIA1 RBD (number of RRMs altered; +/− G3BP1 IDR). (I) Similar to (B,D) but with RBD from LSM14A (essential PB protein). (J) Similar to (D) but with DCP1A (PB protein that lacks RBD). (K) Phase diagram cartoon depicting SG formation as function of nucleating complex concentration and its vRBD. WT cells would exist in green region; G3BP KO/capped, red. See also Figure S5.
Figure 6.
Figure 6.. Competition between protein-protein interaction nodes encodes multiphase condensation
(A) SG proteins compensate for G3BP if acting as v>2 nodes. (B) Expression (~0.4 μM) of GFP-tagged proteins in G3BP KO cells (+As, oligo-dT RNA FISH). Checks = polyA+ SGs. Scale bar, 3 μm, unless noted. (C) Corelet screen in G3BP KO cells (+As) to uncover additional valence. Oligo-dT RNA FISH, 10-min activation, fixed. Arrowhead: condensates lack polyA+ mRNA. (D) G3BP KO cells (+As) expressing GFP-UBAP2LΔs and EIF3F-mCh scored for SGs. Mean and SEM: n=4 experiments (>4 images per). Images: check = SGs, scale bar = 1 μm. (E) SG formation requires sufficiently high vRBD complexes, which can be achieved partly via self-associating UBAP2L IDRs (purple tails) in different complexes. (F) Triple co-expression (GFP-G3BP1, mCh-UBAP2L, iRFP-FXR1) in G3BP KO cells (+As). Line traces for single granules shown. Scale bar, 1 μm. (G) Super-resolution STED of live G3BP KO cells (+As) with <2 μM of either iRFP-G3BP (left) or GFP-G3BP1 and iRFP-FXR1 (right). Arrowhead: G3BP-depleted regions in SGs. (H) Left: Immunofluorescence of UBAP2L KO cells (+As) with GFP-UBAP2L. Check =co-localization. Right: IP of GFP-UBAP2L (G3BP KO cells +/− As) to detect high-affinity interactions (*). (I) SG partition coefficients of GFP-tagged proteins in WT cells (+As) with mCh-CAPRIN1. Mean and SEM: n=3 experiments (n>4 images per). (J) Schematic of how protein interaction network may inform molecular mechanism of multi-phase SG/PBs. (K) G3BP KO cells (+As) expressing mCh- and GFP-tagged proteins (left to right by network distance from G3BP) pairwise (<2 μM). Legend below. Scale bar, 1 μm. (L) G3BP KO cells with G3BPΔNTF2 Corelets (green) and UBAP2L-iRFP (<1 μM) were As-treated (1-hour) then activated and deactivated. (M) G3BP KO cells (+As) expressing panel of Corelets (red; untagged core) and GFP-tagged proteins (green, ~2–3 μM); fixed post-activation (10-min). Scale bar, 3 μm. See also Figure S6,7.
Figure 7.
Figure 7.. A minimal model of PPI network phase behavior demonstrates tunable multiphase coexistence.
(A) A minimal network model, consisting of a substrate-binding complex, a bridge complex, and a high-valence self-interacting complex. Top: Large circles represent a single protein, protein complex, or substrate unit; small circles indicate monovalent interaction sites; and lines indicate equal-affinity protein-protein or protein-substrate interactions. Middle: Free-energy landscape calculated at phase coexistence. The coordinate Δϕ indicates the distance between a pair of phases, whose compositions are path Δϕ. The vertical axis reports the free-energy density in thermal units. Inset: Depiction of the three coexisting phases with concentration vectors ϕ in a 4-dimensional concentration space. Bottom: A cartoon of wetted droplets with a shared component. (B) Disruption of the Bridge-Node 2 interactions, e.g. via saturation with “cap” proteins, separates the network. The compositions of the α and β phases shift and the α-β interfacial free-energy barrier height increases, which tends to disfavor wetting of the two phases. (C) Inhibition of the Node 1 self-interactions, e.g. via capping, destabilizes the α phase. (D) Removal of the substrate also destabilizes the α phase.

Comment in

References

    1. Adinolfi S, Ramos A, Martin SR, Dal Piaz F, Pucci P, Bardoni B, Mandel JL, and Pastore A (2003). The N-terminus of the fragile X mental retardation protein contains a novel domain involved in dimerization and RNA binding. Biochemistry 42, 10437–10444. - PubMed
    1. Alberti S (2019). Conformational rearrangements within G3BP1 promote the emergence of RNA cross-linking microclusters that drive stress granule formation by condensation. Cell 1–82.
    1. Ayache J, Bénard M, Ernoult-Lange M, Minshall N, Standart N, Kress M, and Weil D (2015). P-body assembly requires DDX6 repression complexes rather than decay or Ataxin2/2L complexes. Mol. Biol. Cell 26, 2579–2595. - PMC - PubMed
    1. Banani SF, Lee HO, Hyman AA, and Rosen MK (2017). Biomolecular condensates: organizers of cellular biochemistry. Nat. Rev. Mol. Cell Biol 18, 285–298. - PMC - PubMed
    1. Baumgartner R, Stocker H, and Hafen E (2013). The RNA-binding proteins FMR1, rasputin and caprin act together with the UBA protein lingerer to restrict tissue growth in Drosophila melanogaster. PLoS Genet 9, e1003598. - PMC - PubMed

Publication types

MeSH terms