. 2020 Apr 16;181(2):325-345.e28.
doi: 10.1016/j.cell.2020.03.046.

G3BP1 Is a Tunable Switch that Triggers Phase Separation to Assemble Stress Granules

Affiliations

G3BP1 Is a Tunable Switch that Triggers Phase Separation to Assemble Stress Granules

Peiguo Yang et al. Cell. .

Abstract

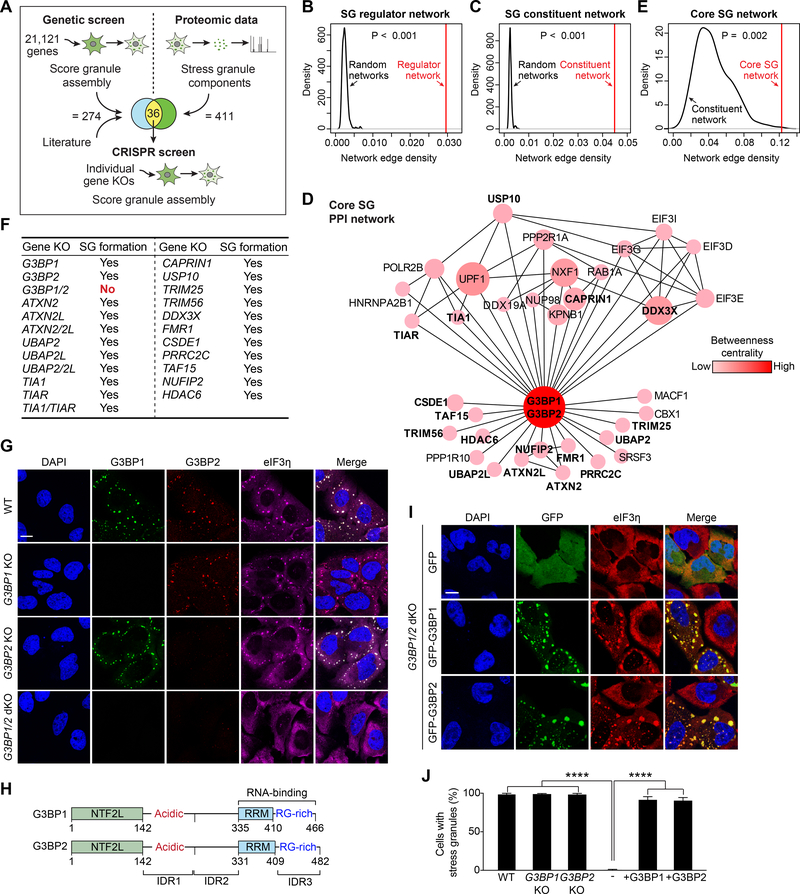
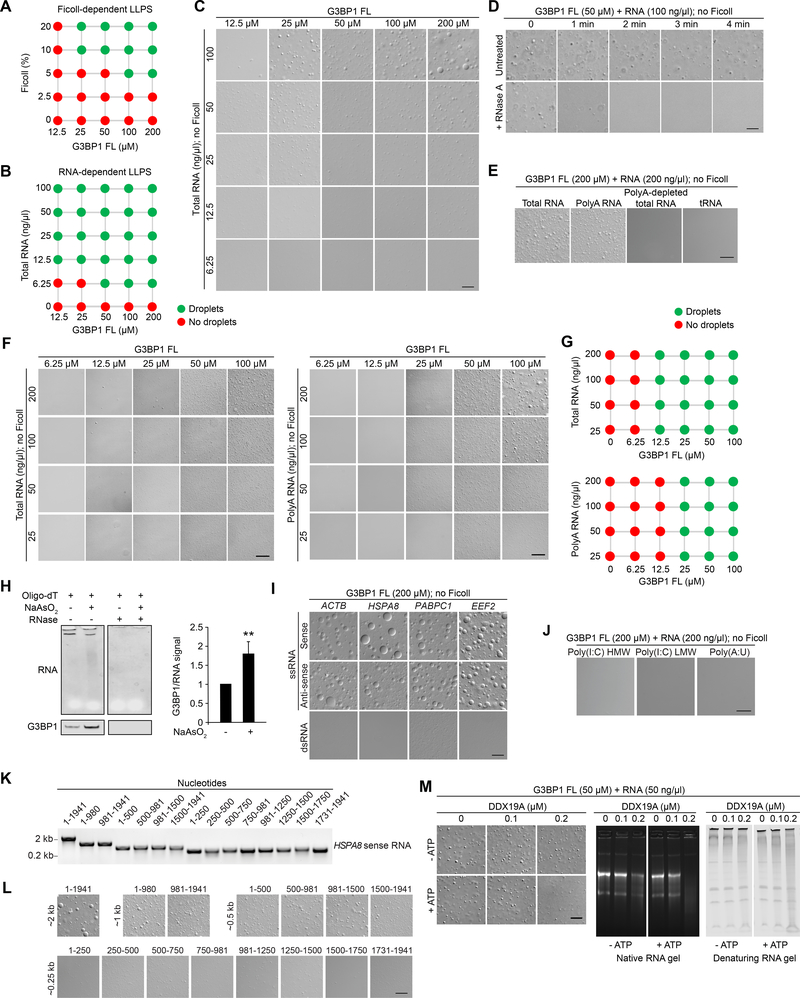
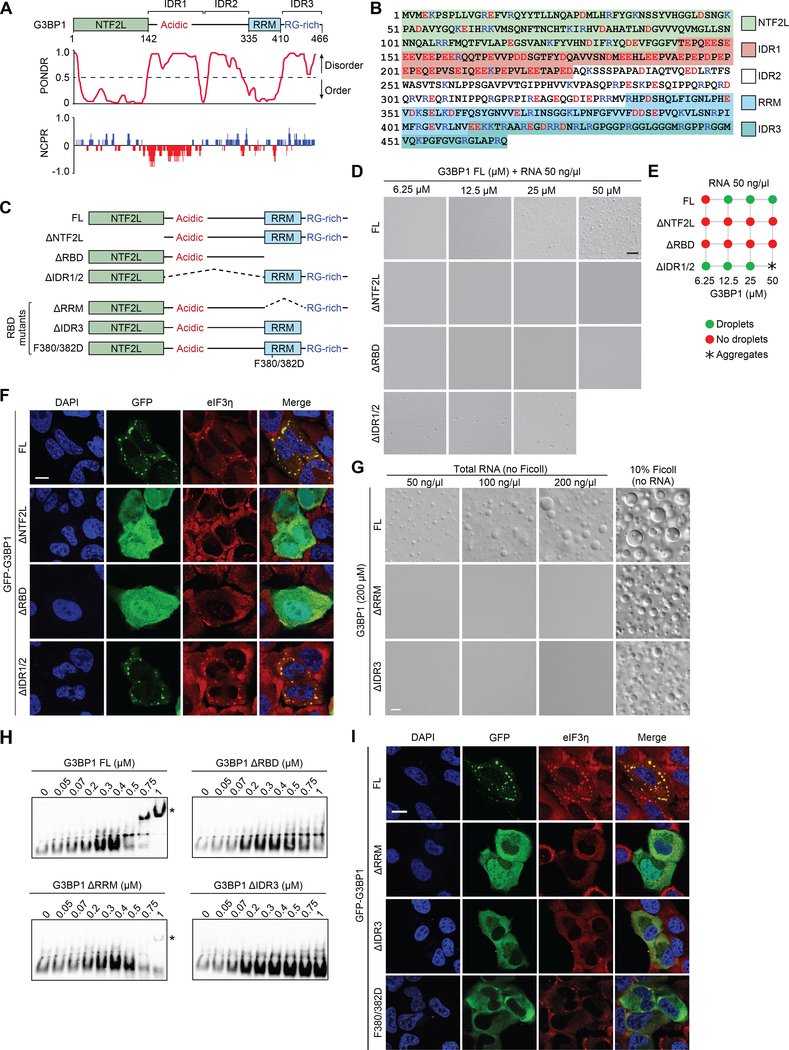
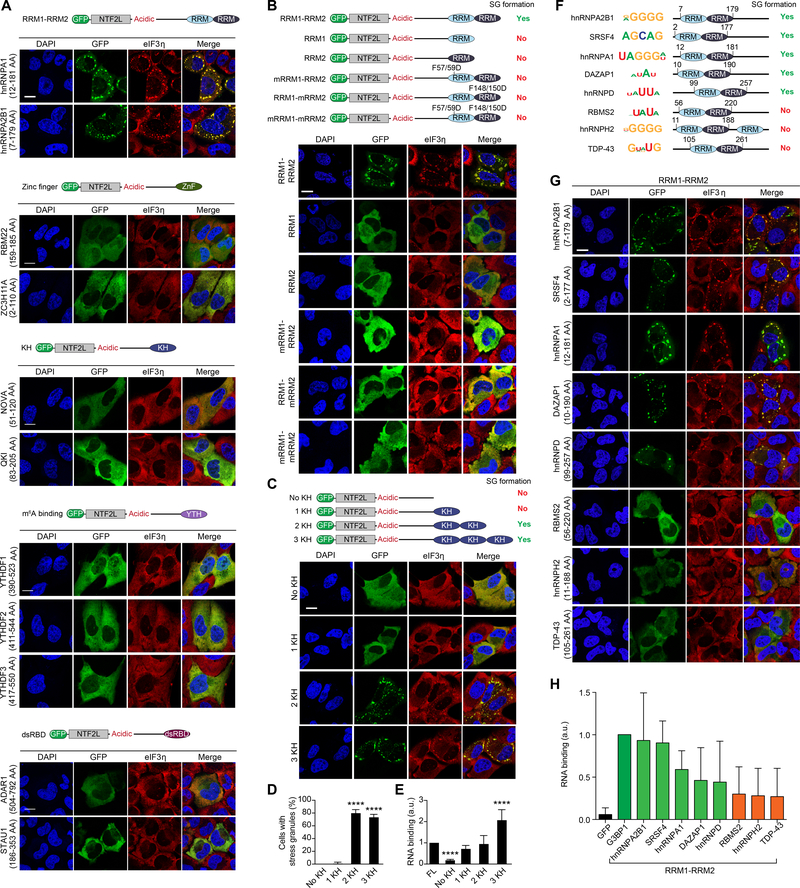
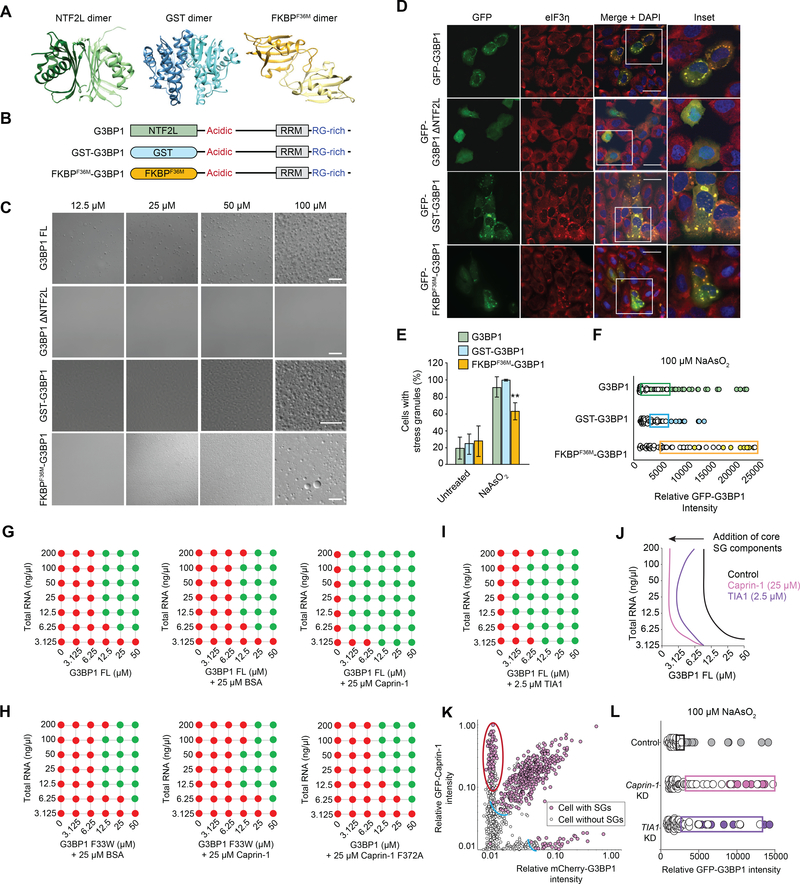
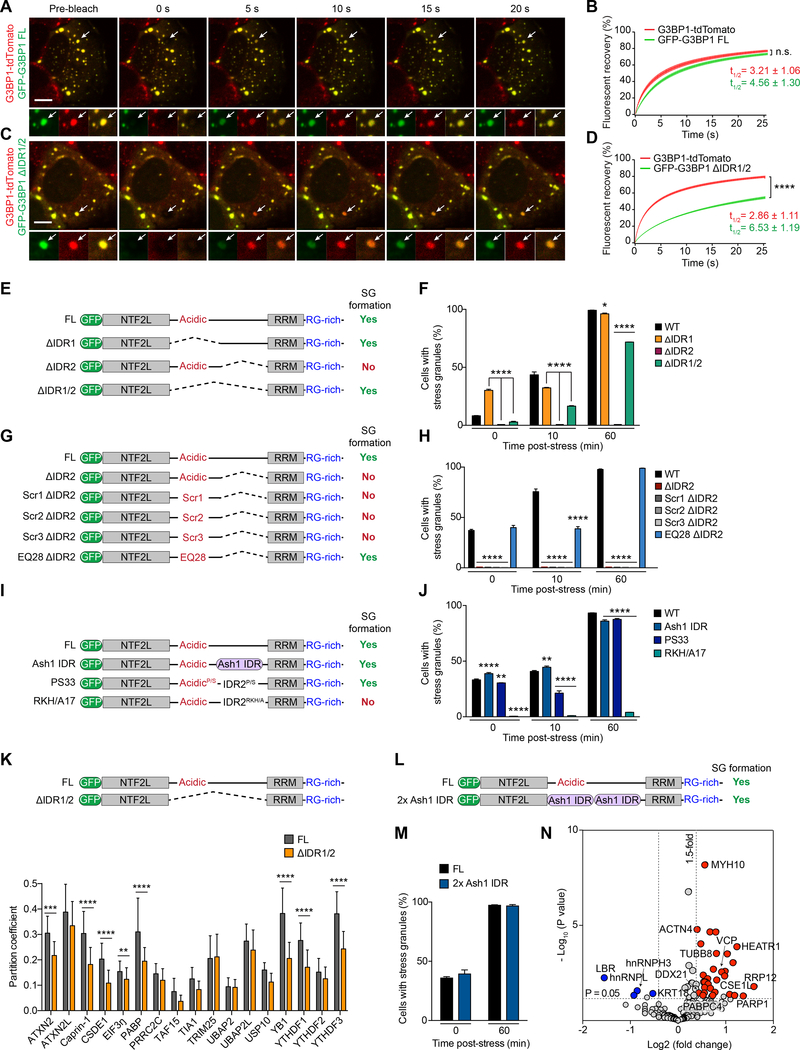
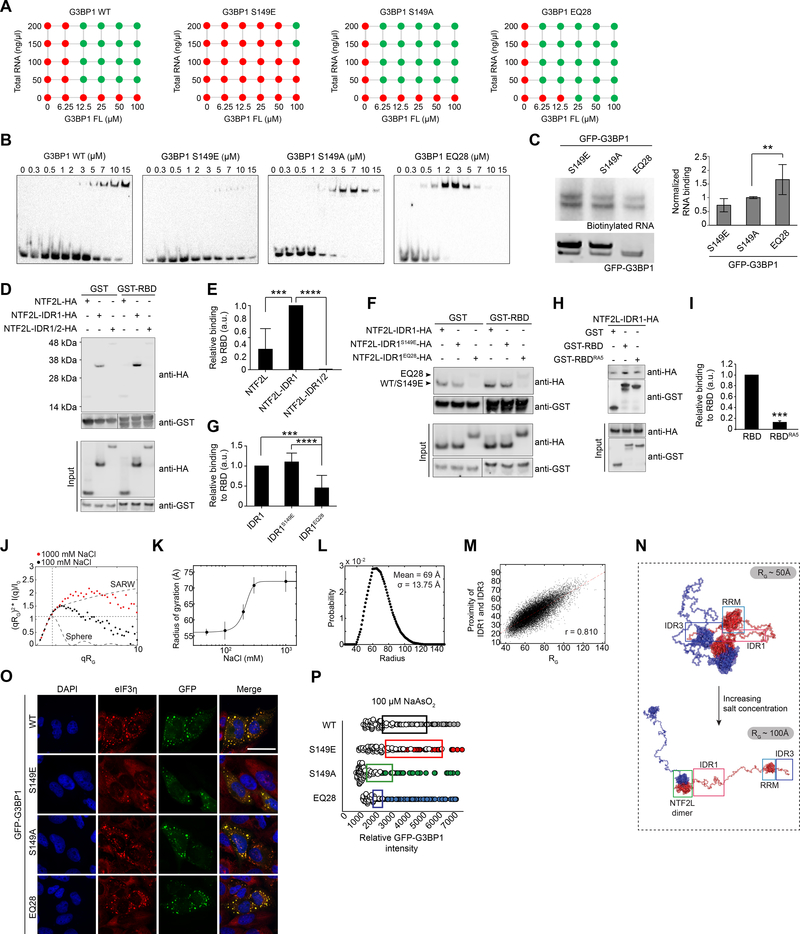
The mechanisms underlying ribonucleoprotein (RNP) granule assembly, including the basis for establishing and maintaining RNP granules with distinct composition, are unknown. One prominent type of RNP granule is the stress granule (SG), a dynamic and reversible cytoplasmic assembly formed in eukaryotic cells in response to stress. Here, we show that SGs assemble through liquid-liquid phase separation (LLPS) arising from interactions distributed unevenly across a core protein-RNA interaction network. The central node of this network is G3BP1, which functions as a molecular switch that triggers RNA-dependent LLPS in response to a rise in intracellular free RNA concentrations. Moreover, we show that interplay between three distinct intrinsically disordered regions (IDRs) in G3BP1 regulates its intrinsic propensity for LLPS, and this is fine-tuned by phosphorylation within the IDRs. Further regulation of SG assembly arises through positive or negative cooperativity by extrinsic G3BP1-binding factors that strengthen or weaken, respectively, the core SG network.

Keywords: G3BP1; Intrinsically disordered protein; biomolecular condensate; cooperativity; core stress granule network; liquid-liquid phase separation; membraneless organelle; molecular switch; multivalency; stress granule.


Conflict of interest statement

Declaration of Interests J.P.T. is a consultant for 5AM and Third Rock Ventures.

Figures

Figure 1.
Figure 1.. G3BP Is the Node of Highest Centrality within the Core Stress Granule (SG) Network
(A) Approach used to identify the core SG network. A genome-wide siRNA screen was performed in heat-shocked U2OS cells expressing G3BP1-GFP. Results from this screen were combined with published results and integrated with proteomic datasets. Genes that overlapped between the genetic screen and the proteomic datasets were assessed individually by CRISPR-Cas9-based knockout (KO). (B-C) Network analyses showing connectivity (network edge density) of the SG regulator network (B) and SG constituent network (C). P values were estimated by empirically calculating the probability of observing a denser network by randomly sampling 1,000 subnetworks of similar size from the entire interactome. (D) The core SG network of 36 core genes identified using the approach illustrated in (A). The color density and size of each node is proportional to its betweenness centrality in the network. Genes tested by CRISPR-Cas9 in (F) are in bold. (E) Network analysis of 36 core SG genes comparing connectivity with the SG constituent network. The P value was estimated similarly as in (B-C) but using the network of SG constituents as background. (F) U2OS cell lines with CRISPR-Cas9-based single or double KOs. Cells were exposed to sodium arsenite (500 μM, 1 h) and SG assembly was assessed by staining with a panel of 17 SG markers. (G) U2OS cells with KO of G3BP1, G3BP2, or both G3BP1 and G3BP2 were exposed to sodium arsenite (500 μM, 1 h) and stained for the SG marker eIF3η. Scale bar, 20 μm. (H) Comparison of human G3BP1 and G3BP2 proteins. NTF2L, NTF2-like; IDR, intrinsically disordered region; RRM, RNA-recognition motif; RG-rich: arginine-glycine rich. (I-J) G3BP1/2 dKO cells were transfected with GFP-G3BP1 or GFP-G3BP2, exposed to sodium arsenite (500 μM, 1 h), and stained for eIF3η. Cells were imaged (I) and the percentage of cells positive for SGs was quantified (J). Error bars indicate SD. ****P < 0.0001 by one-way ANOVA, Tukey’s multiple comparisons test. Scale bar, 20 μm. See also Figure S1, Tables S1 and S2.
Figure 2.
Figure 2.. G3BP1 Undergoes LLPS with RNAs that Have Specific Features
(A) Summary of phase separation behaviors of G3BP1 FL with increasing concentration of Ficoll (crowding agent). Corresponding images are shown in Figure S2A. (B-C) LLPS of purified recombinant G3BP1 in the absence of a crowding agent and increasing concentrations of total RNA purified from human cells. Scale bar, 20 μm. (D) LLPS of purified recombinant G3BP1 with 100 ng/μl total RNA, with or without the addition of 1 μg/ml RNase A. Scale bar, 50 μm. (E) LLPS of purified recombinant G3BP1 with the addition of RNA species as indicated. Scale bar, 20 μm. (F) LLPS of purified recombinant G3BP1 with increasing concentrations of total (left panels) or polyA (right panels) RNA. Scale bars, 50 μm. (G) Summary of phase separation behaviors of G3BP1 in (F). (H) PolyA pulldown from U2OS cells exposed to sodium arsenite (500 μM, 1 h) revealing RNA (SYBR Gold staining) and G3BP1 pulldown (immunoblot). Representative image from 4 experiments is shown. The level of G3BP1 pulled down by polyA RNA was normalized to the total RNA level. Quantification was performed using 4 replicates. Error bar indicates SD. **P = 0.0038 by unpaired t-test. (I) LLPS of purified recombinant G3BP1 in the absence of a crowding agent and the addition of mRNAs as indicated. Scale bar, 20 μm. (J) LLPS of purified recombinant G3BP1 in the presence of long double strands of poly(I:C) or poly(A:U). Scale bar, 20 μm. (K) In vitro-transcribed HSPA8 sense-strand RNA of different lengths was assessed by agarose gel and ethidium bromide staining. (L) In vitro-transcribed HSPA8 sense-strand RNA was mixed with 200 μM recombinant G3BP1 to assess its ability to trigger LLPS in the absence of a crowding agent. Scale bar, 20 μm. (M) DIC images and RNA gels showing effect of helicase pre-treatment of RNA on G3BP1-RNA LLPS. Scale bar, 10 μm. All in vitro LLPS experiments were performed in 150 mM NaCl. See also Figure S2 and Video S1.
Figure 3.
Figure 3.. G3BP1 Phase Separation Correlates with SG Reconstitution
(A) G3BP1 domains aligned with results of PONDR (Predictor of Natural Disordered Regions) and NCPR (net charge per residue; 5-amino acid window) analyses. (B) Human G3BP1 protein is shown with major domains marked by highlighted colors. Charged residues are shown in blue (basic; Arg and Lys) and red (acidic; Asp and Glu). (C) Constructs used to investigate the function of individual domains of G3BP1. (D) LLPS of purified recombinant G3BP1 in 150 mM NaCl and 50 ng/μl total RNA and the absence of a crowding agent. Scale bar, 10 μm. (E) Summary of phase separation behaviors of G3BP1 shown in (D). (F) G3BP1/2 dKO cells were transfected with indicated G3BP1 constructs, exposed to sodium arsenite (500 μM, 1 h), and stained for eIF3η. Scale bar, 20 μm. (G) LLPS of recombinant G3BP1 proteins in 150 mM NaCl, with or without crowding agent or total RNA from human cells. Scale bar, 10 μm. (H) Electrophoretic mobility shift assay of purified G3BP1 proteins showing biotinylated RNA as detected by HRP-conjugated streptavidin. Asterisk indicates RNA-G3BP1 complex. (I) G3BP1/2 dKO cells were transfected with indicated G3BP1 constructs, exposed to sodium arsenite (500 μM, 1 h), and stained for eIF3η. Scale bar, 20 μm. See also Figure S3.
Figure 4.
Figure 4.. Multivalency in RNA Binding Mediates SG Formation
(A-C) G3BP1/2 dKO cells were transfected with G3BP1 constructs in which the RBD was substituted with different types of RBDs as indicated. Cells were exposed to sodium arsenite (500 μM, 1 h) and stained for eIF3η. Scale bars, 20 μm. (D) Cells from (C) were imaged and the percentage of cells positive for SGs was quantified. Error bars indicate SD. ****P < 0.0001 vs. no KH by one-way ANOVA, Dunnett’s multiple comparisons test. (E) G3BP1/2 dKO cells were transfected with indicated G3BP1 constructs. Immunoprecipitated G3BP1 cross-linked to RNA was assessed by immunoblotting for biotin (RNA) and GFP (G3BP1). Binding of RNA was quantified and normalized to protein signal. Results show quantification of triplicate experiments. Error bars indicate SD. ****P < 0.0001 vs. FL by one-way ANOVA, Dunnett’s multiple comparisons test. (F) RNA-binding proteins with tandem RRM motifs are shown together with their top binding motif and domain structure. (G) G3BP1/2 dKO cells were transfected with G3BP1 constructs in which the RBD was substituted with indicated tandem RRM domains. Cells were exposed to sodium arsenite and stained as in (A). Scale bar, 20 μm. (H) G3BP1/2 dKO cells were transfected with indicated G3BP1 constructs and analyzed as in (E). Green bars correspond to functional swap mutants for SG formation, orange bars correspond to non-functional swap mutants. Results show quantification from triplicate experiments. Error bars indicate SD. See also Figure S4.
Figure 5.
Figure 5.. NTF2L Domain-Mediated Dimerization and Interaction with Core SG Components Regulate SG Assembly
(A) Structures of the G3BP1 NTF2L (PDBID: 4FCJ), GST (PDBID: 1UA5), and FKBPF36M (PDBID: 1YEM) dimers. (B) Constructs used to investigate the function of the NTF2L domain. (C) LLPS of purified recombinant G3BP1 in the presence of a crowding agent and 150 mM NaCl. Scale bar, 50 μm. (D-E) G3BP1/2 dKO cells were transfected with indicated G3BP1 constructs, exposed to sodium arsenite (500 μM, 1 h), and stained for eIF3η. Cells were imaged (D) and the percentage of cells positive for SGs was quantified (E). Scale bars, 50 μm. Error bars indicate SD. **P = 0.0098 vs. G3BP1 by two-way ANOVA, Sidak’s multiple comparisons test. (F) Intracellular phase diagrams of indicated G3BP1 constructs transfected into G3BP1/2 dKO cells. Cells were exposed to sodium arsenite (30 min), fixed, and stained for PABP. SG formation and GFP intensities were assessed cell-by-cell. Cells with SGs are plotted as filled circles; cells without SGs are plotted as empty circles. Boxes highlight the 25% highest levels of expression among SG-negative cells. (G) Co-phase separation of purified recombinant G3BP1 with BSA or caprin-1 in the absence of a crowding reagent, in 150 mM NaCl, and with increasing concentrations of total RNA from human cells. (H) Co-phase separation of purified recombinant G3BP1 and caprin-1 variants as in (G). (I) Co-phase separation of purified recombinant G3BP1 and TIA1 as in (G). (J) Phase diagram of G3BP1 with caprin-1 and TIA1 as shown in (G-I). (K) Intracellular phase diagrams of G3BP1 with addition of caprin-1. G3BP1/2 dKO cells were co-transfected with mCherry-G3BP1 and GFP-caprin-1 and intracellular phase diagrams were measured as in (F). Expression of caprin-1 reduces the G3BP1 threshold for SG formation (blue arc). Cells with high caprin-1 levels assembled SGs at very low levels of G3BP1 (red oval). (L) Intracellular phase diagrams of G3BP1 after knockdown of caprin-1 or TIA1. G3BP1/2 dKO cells were co-transfected with GFP-G3BP1 WT and a pool of siRNA targeting expression of caprin-1 or TIA1 and intracellular phase diagrams were measured as in (F). See also Figure S5, Table S2, and Video S2.
Figure 6.
Figure 6.. The Long Central IDR of G3BP1 Regulates SG Assembly, Dynamics, and Composition; G3BP1 IDR1 Is an Autoinhibitory Element
(A-D) U2OS cells expressing tdTomato-tagged endogenous G3BP1 were transfected with indicated GFP-tagged G3BP1 constructs, exposed to sodium arsenite (500 μM, 1 h), and the relative mobility of endogenous tdTomato-G3BP1 was compared to exogenous GFP-G3BP1 by FRAP. Error bars indicate SEM. n.s., not significant, ****P < 0.0001 by two-way ANOVA, Sidak’s multiple comparison test. Mobile fractions were 76% (tdTomato-G3BP1 FL), 73% (GFP-G3BP1 FL) in (A-B); 79% (tdTomato-G3BP1 FL) and 54% (GFP-G3BP1 ΔIDR1/2) in (C-D). Scale bar, 10 μm. (E-F) G3BP1/2 dKO cells were transfected with indicated G3BP1 constructs and exposed to sodium arsenite (500 μM). Cells were imaged and the percentage of cells positive for SGs was quantified prior to arsenite exposure (0 min) or 10 min or 60 min after arsenite exposure. Error bars indicate SEM. *P = 0.0224, ****P < 0.0001 by two-way ANOVA, Dunnett’s multiple comparisons test. (G-H) G3BP1/2 dKO cells were transfected, stressed, imaged, and quantified as in (E-F). G3BP1 mutant constructs had deletion of IDR2 and either a scrambled IDR1 sequence (Scr) or mutation of all 28 glutamates in IDR1 to glutamine (EQ28). Error bars indicate SEM. ****P < 0.0001 by two-way ANOVA, Dunnett’s multiple comparisons test. (I-J) G3BP1/2 dKO cells were transfected, stressed, imaged, and quantified as in (E-F). G3BP1 mutant constructs had substitution of IDR2 with Ash1 IDR, substitution of all 33 proline residues in IDR1/2 to serine (PS33), or substitution of 17 positively charged residues to alanines (RKH/A17). Error bars indicate SEM. **P = 0.0077 (0 min) and 0.0014 (10 min), ****P < 0.0001 by two-way ANOVA, Dunnett’s multiple comparisons test. (K) G3BP1/2 dKO cells were transfected with indicated G3BP1 constructs, exposed to sodium arsenite (500 μM, 1 h), fixed, and stained with SG markers as indicated. Confocal images were taken for partition coefficient analysis. Error bars indicate SD. **P =0.0011, ***P =0.0001, ****P < 0.0001 by two-way ANOVA, Sidak’s multiple comparisons test. (L-M) G3BP1/2 dKO cells were transfected with indicated G3BP1 constructs (L) and exposed to sodium arsenite (500 μM, 1 h). Cells were imaged and the percentage of cells positive for SGs was quantified (M). Error bars indicate SD. (N) Fold change of spectral counts of proteins identified by APEX2 proximity labeling and P values are plotted. Colored circles indicate proteins more enriched in SGs formed with G3BP1–2xAsh1 IDR (red; 10 representative proteins are labeled) or with G3BP1 FL (blue). See also Figure S6, Tables S3, Videos S3 and S4.
Figure 7.
Figure 7.. IDR1 Phosphorylation Tunes Interplay between 3 IDRs and Regulates LLPS
(A) Summary of RNA-triggered LLPS of G3BP1 under indicated conditions, in the presence of 150 mM NaCl. Corresponding images are shown in Figure S7E. (B) Electrophoretic mobility shift assay of G3BP1 WT and IDR1 mutants. (C) CLIP analysis of G3BP1 IDR1 mutants. Indicated G3BP1 constructs were transiently expressed in G3BP1/2 dKO cells and analyzed as in Figure 4E. Error bars indicate SD. **P = 0.005 vs. S149A by one-way ANOVA, Dunnett’s multiple comparisons test. (D-E) GST pulldown of purified GST-RBD with HA-G3BP1 N-terminal mutants indicates an intramolecular interaction between G3BP1 RBD and IDR1, and IDR2 mitigates this interaction. Results are quantified in (H). Error bars indicate SD. ***P = 0.0002 and ****P < 0.0001 vs. NTF2L-IDR1-HA by one-way ANOVA, Dunnett’s multiple comparisons test. (F-G) GST pulldown of GST-RBD with NTF2L-IDR1-HA. RBD interactions with WT or mutant IDR1 (S149E, EQ28) were assessed as in (G) and quantified in (J). Error bars indicate SD. ***P = 0.0006 and ****P < 0.0001 by one-way ANOVA, Tukey’s multiple comparisons test. (H-I) GST pulldown of GST-RBD mutants with NTF2L-IDR1-HA. IDR1 interactions with WT or RBDRA5 were assessed as in (G) and quantified in (L). Error bar indicates SD. ***P = 0.0002 by unpaired t-test. (J) Small-angle X-ray scattering (SAXS) data for G3BP1 WT at high and low NaCl concentration. Data are presented as normalized Kratky plots where the intensity is normalized by the zero-angle scattering and the momentum transfer (q) is normalized by the radius of gyration (Rg). The intersection of dashed lines indicates the theoretical maximum of a solid sphere. Experimental data with a higher maximum coupled to a shift to the right is caused by conformational flexibility. Comparing the experimental data to synthetic data for a sphere and a self-avoiding random walk (SARW) indicates that G3BP1 is flexible in both conditions and expands toward maximal random dimensions at high NaCl concentration. (K) Rgs were extracted from SAXS data by Guinier analysis at 50–1000 mM NaCl. Data were fit to a logistic function suggesting a minimum dimension of ~55Å at low NaCl concentration to a maximum extension of ~72 Å at high NaCl concentration with a transition with a midpoint at ~215 mM NaCl, indicating an interaction between oppositely charged regions of the protein. Error bars indicate SD. (L) Distribution of G3BP1 radii in randomly generated conformations. (M) In random synthetic conformations, the distance between IDR1 and IDR3 is positively correlated with the total RG. (N) Representative conformations of G3BP1. Conformations with representative radii were sampled from the randomly generated pool shown in (E) to show compact conformations enriched in buffers with ionic strength below 200 mM (top) and extended conformations that would be enriched at high ionic strength (bottom). (O) G3BP1/2 dKO cells transiently expressing indicated G3BP1 constructs were exposed to sodium arsenite (500 μM, 1 h), fixed, and stained for eIF3η. Scale bar, 50 μm. (P) Intracellular phase diagram of indicated G3BP1 constructs transfected into G3BP1/2 dKO cells. Cells were exposed to 100 μM sodium arsenite (30 min), fixed, and stained for PABP. SG formation and GFP intensities were assessed cell-by-cell. Cells with SGs are plotted as filled circles; cells without SGs are plotted as empty circles. Boxes highlight the 25% highest levels of expression among SG-negative cells. Vertical lines in blots in (I) and (K) indicate noncontiguous lanes from the same gel. See also Figure S7.

Comment in

Similar articles

Cited by

References

    1. Banani SF, Lee HO, Hyman AA, and Rosen MK (2017). Biomolecular condensates: organizers of cellular biochemistry. Nat Rev Mol Cell Biol 18, 285–298. - PMC - PubMed
    1. Banani SF, Rice AM, Peeples WB, Lin Y, Jain S, Parker R, and Rosen MK (2016). Compositional Control of Phase-Separated Cellular Bodies. Cell 166, 651–663. - PMC - PubMed
    1. Barabasi AL, and Albert R (1999). Emergence of scaling in random networks. Science 286, 509–512. - PubMed
    1. Bernado P, Mylonas E, Petoukhov MV, Blackledge M, and Svergun DI (2007). Structural characterization of flexible proteins using small-angle X-ray scattering. J Am Chem Soc 129, 5656–5664. - PubMed
    1. Brown PH, and Schuck P (2006). Macromolecular size-and-shape distributions by sedimentation velocity analytical ultracentrifugation. Biophys J 90, 4651–4661. - PMC - PubMed

Publication types