. 2020 May 14;181(4):800-817.e22.
doi: 10.1016/j.cell.2020.03.052. Epub 2020 Apr 16.

Heterochromatin-Driven Nuclear Softening Protects the Genome against Mechanical Stress-Induced Damage

Affiliations

Heterochromatin-Driven Nuclear Softening Protects the Genome against Mechanical Stress-Induced Damage

Michele M Nava et al. Cell. .

Abstract

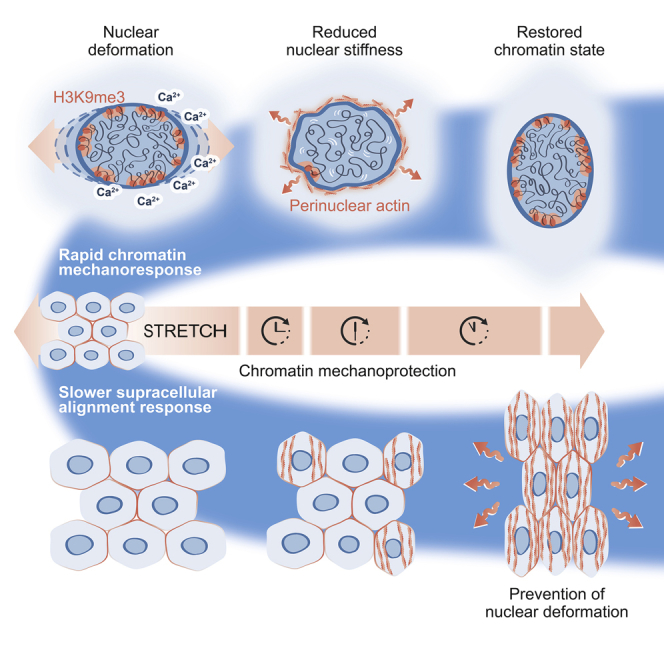
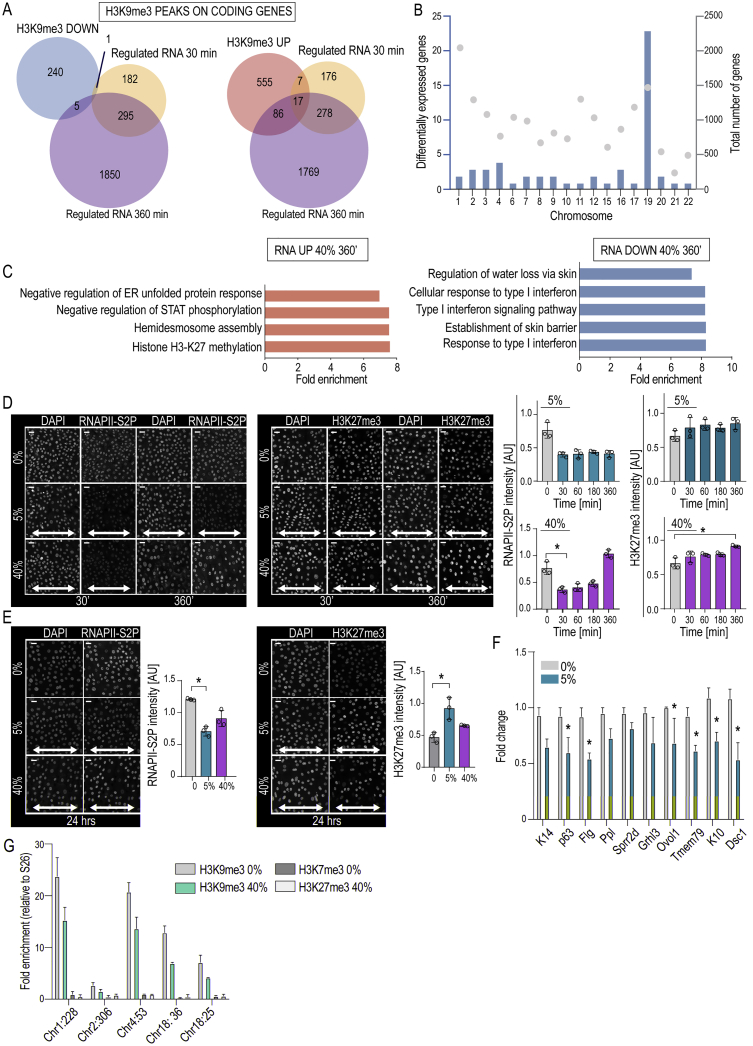
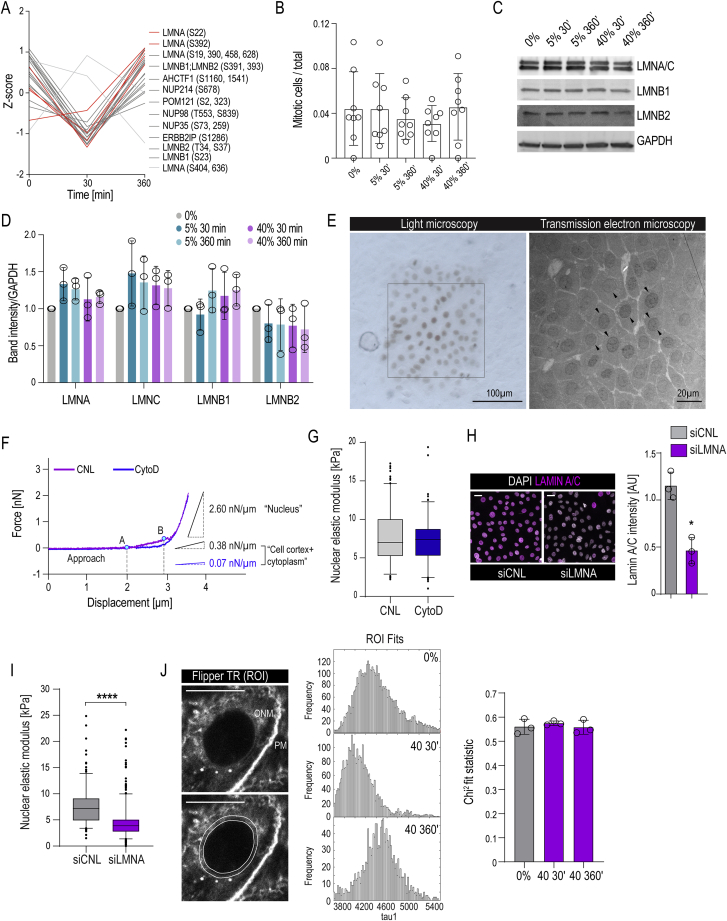
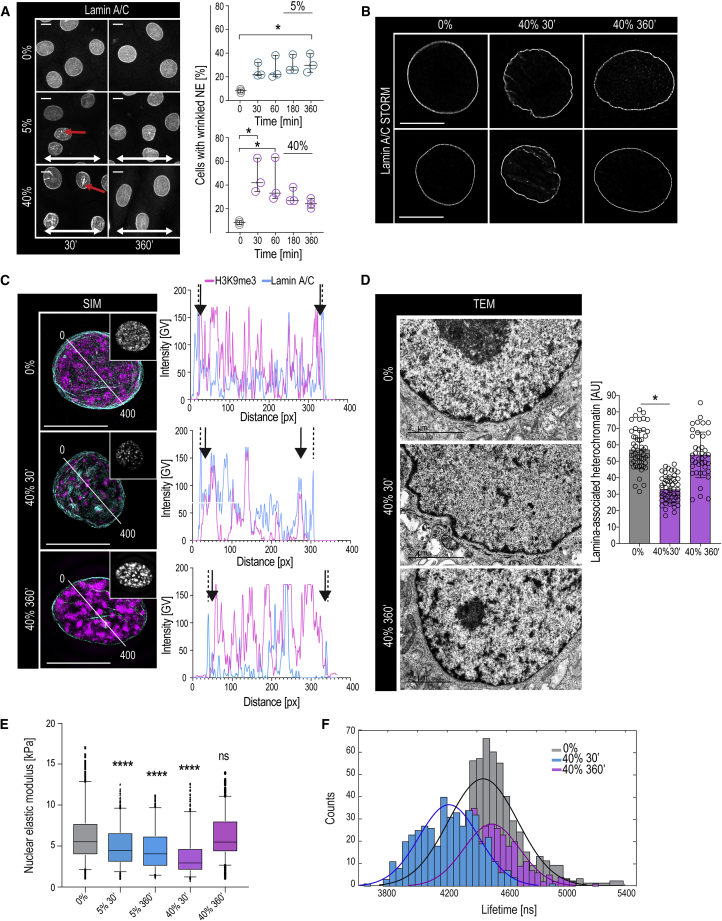
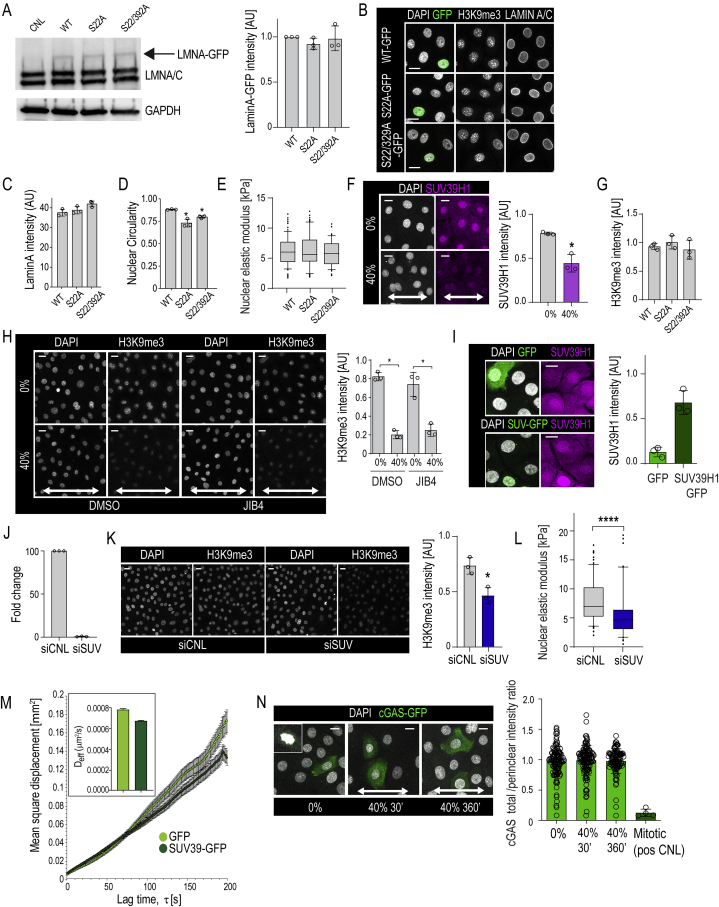
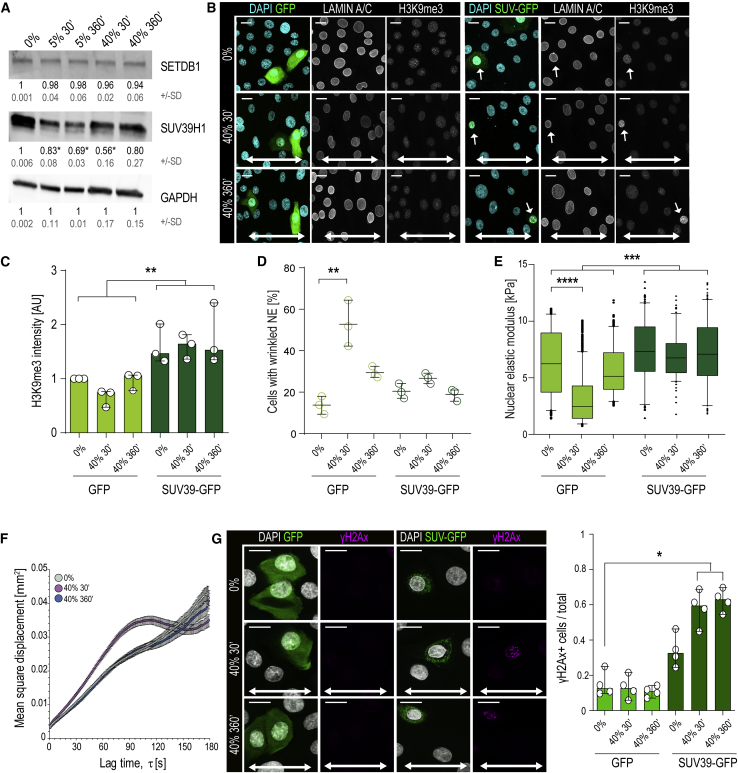
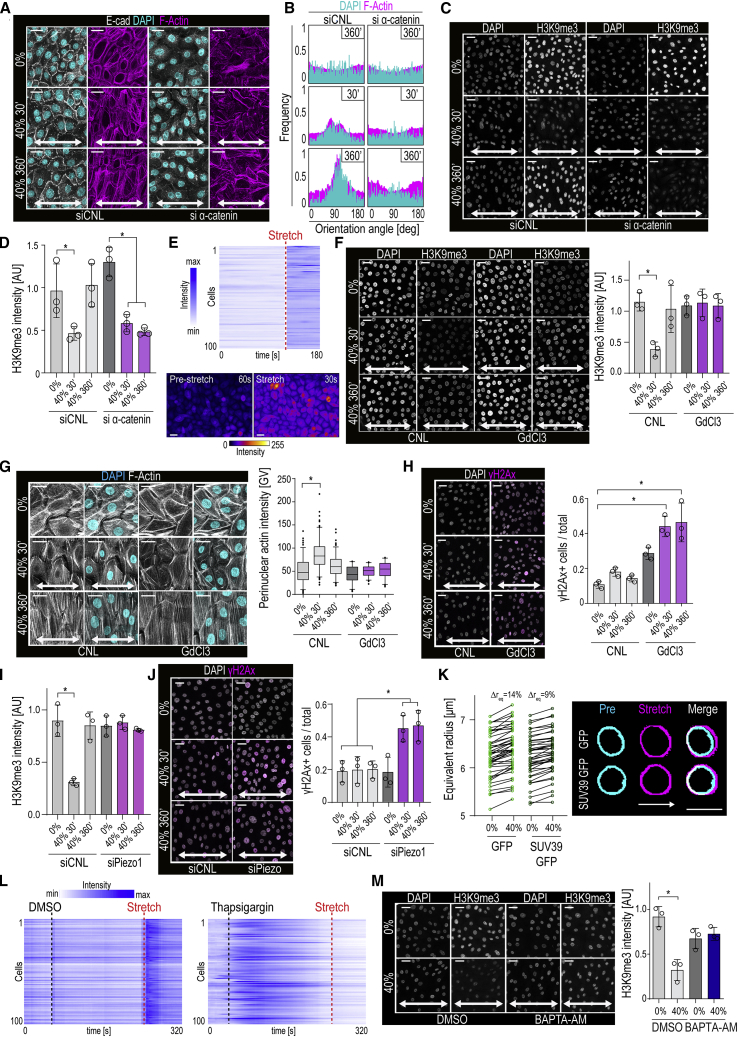
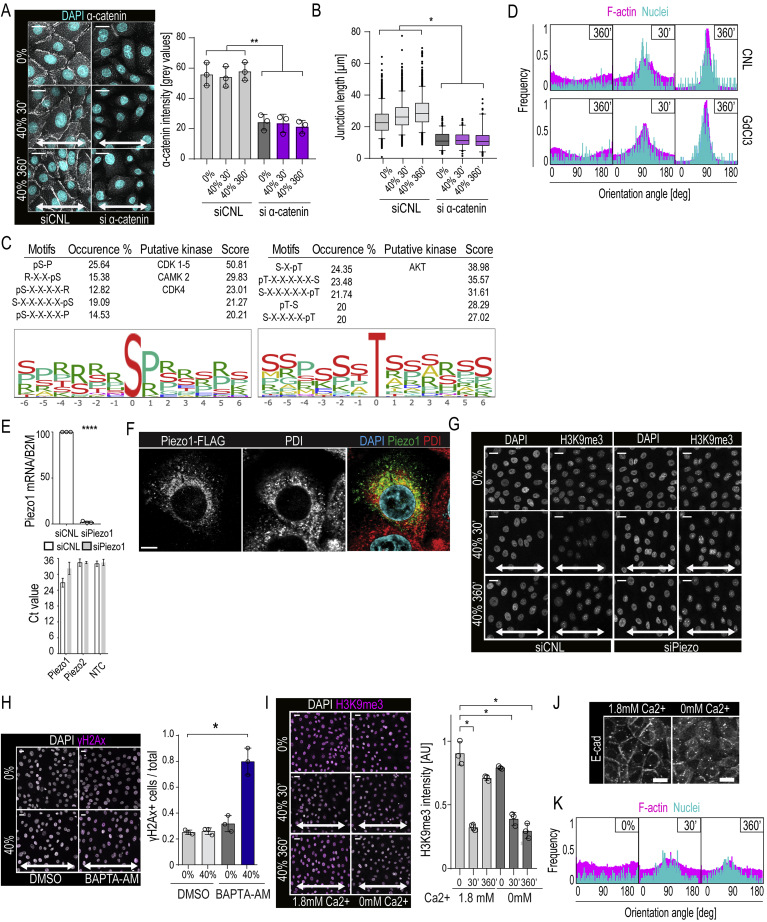
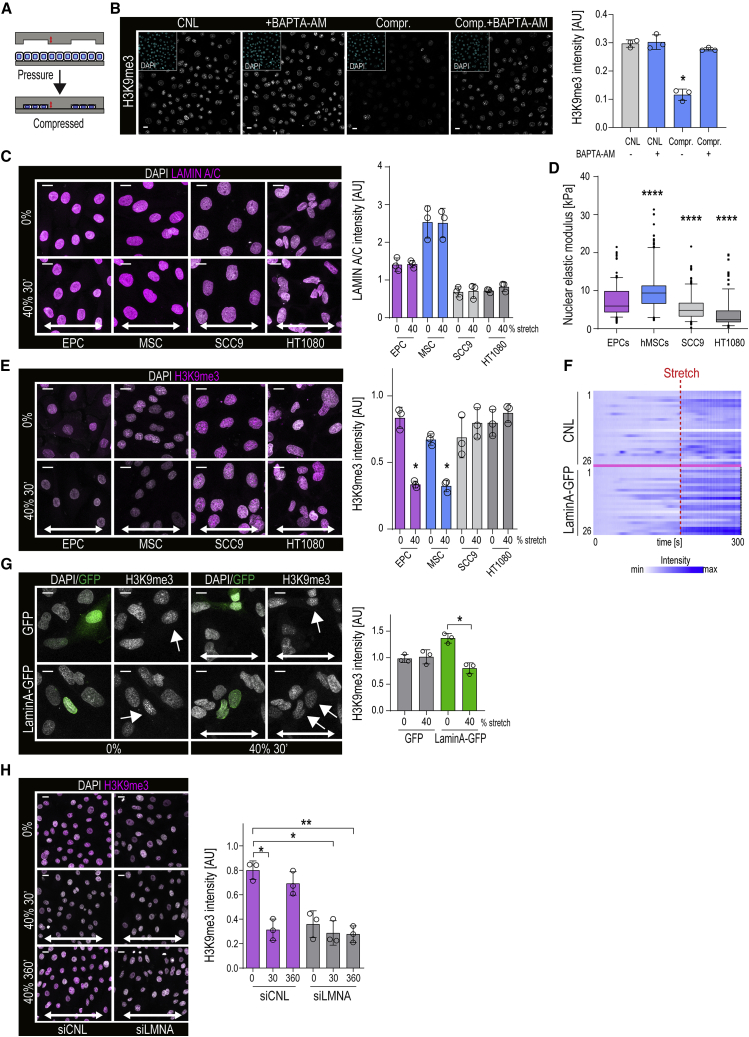
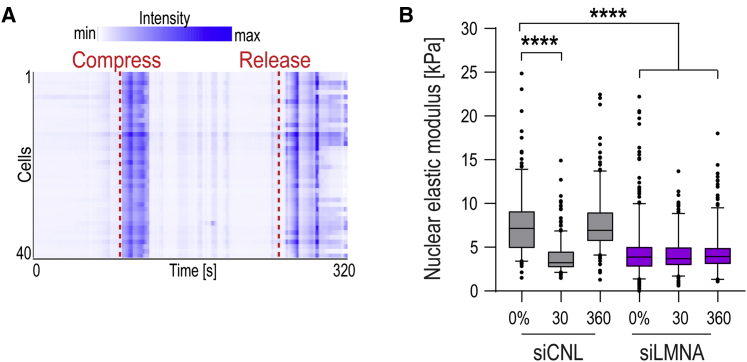
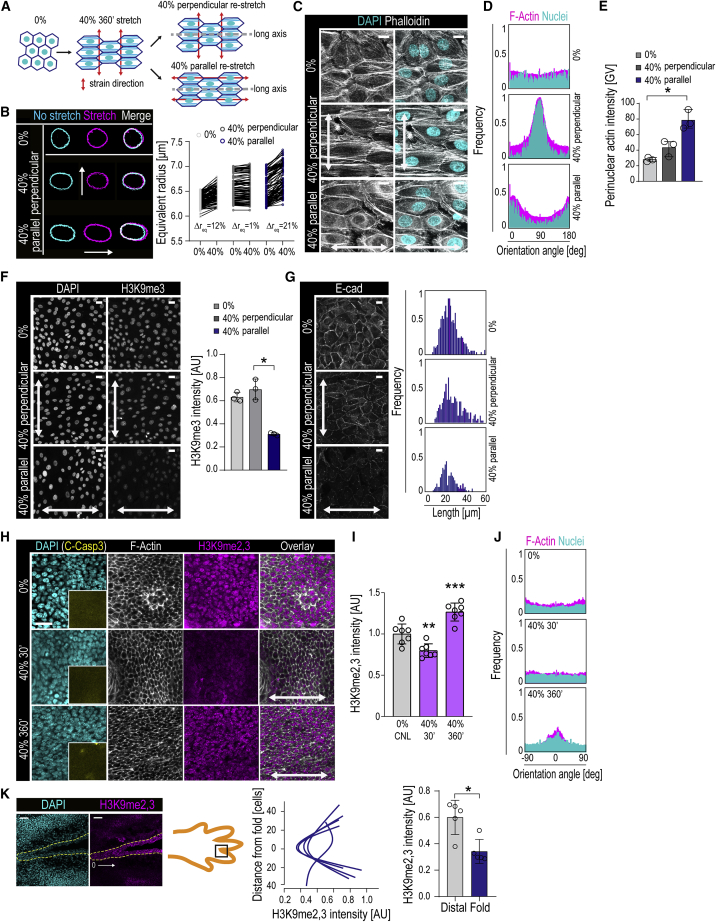
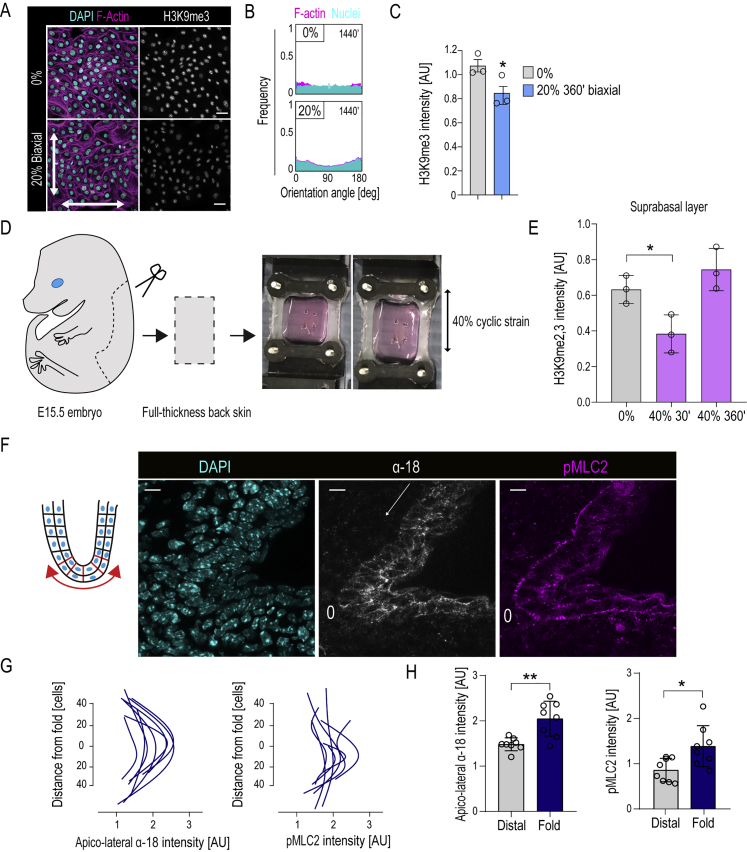
Tissue homeostasis requires maintenance of functional integrity under stress. A central source of stress is mechanical force that acts on cells, their nuclei, and chromatin, but how the genome is protected against mechanical stress is unclear. We show that mechanical stretch deforms the nucleus, which cells initially counteract via a calcium-dependent nuclear softening driven by loss of H3K9me3-marked heterochromatin. The resulting changes in chromatin rheology and architecture are required to insulate genetic material from mechanical force. Failure to mount this nuclear mechanoresponse results in DNA damage. Persistent, high-amplitude stretch induces supracellular alignment of tissue to redistribute mechanical energy before it reaches the nucleus. This tissue-scale mechanoadaptation functions through a separate pathway mediated by cell-cell contacts and allows cells/tissues to switch off nuclear mechanotransduction to restore initial chromatin state. Our work identifies an unconventional role of chromatin in altering its own mechanical state to maintain genome integrity in response to deformation.

Keywords: DNA damage; chromatin; heterochromatin; mechanoprotection; mechanotransduction; nuclear architecture; nuclear lamina; nuclear mechanics; stem cells.


Conflict of interest statement

Declaration of Interests The authors declare no competing interests.

Figures

None
Graphical abstract
Figure 1
Figure 1
Cells Show a Rapid Chromatin and a Slow Supracellular Mechanoresponse with Distinct Amplitude Dependencies (A) Stretch experiment design and quantification strategy of F-actin and nuclear axis orientation. (B) Representative F-actin (phalloidin) and DAPI images of cells exposed to uniaxial stretch. (C) Quantification of images in (B) shows time-dependent reorientation of F-actin and nuclear major axes perpendicular to 40% stretch direction (frequency distribution of >500 cells/condition pooled across three independent experiments). (D) Parameters measured from 3D nuclear images. Aspect ratio was calculated as a/b and flatness index as c/b. (E and F) Quantification of nuclear aspect ratio (E) and flatness index (F) (n = 3 independent experiments with > 365 cells/condition/experiment). (G) Representative E-cadherin (E-cad) images and quantification show time-dependent reorientation of E-cad-positive adherens junctions 45° away from 40% stretch direction (frequency distribution of 380 cells/condition pooled across three independent experiments; p = 0.0390, Friedman/Dunn’s). (H) Representative F-actin images and quantification illustrating sustained and transient perinuclear actin polymerization (red arrows) at 5% and 40% stretch, respectively (n > 300 cells/condition pooled across three independent experiments; p = 0.0343, Friedman/Dunn’s). (I) Heatmap and Euclidian distance dendrogram of phosphosites quantified by mass spectrometry at 30 and 360 min of 40% stretch (n = 3 independent experiments; padj cutoff = 0.05). (J) Distance-based clustering of phosphosites shows a cluster of transiently decreased phosphosites at 30 min (cluster 1) and a cluster with sustained decrease at 30 and 360 min (cluster 2). (K) GO terms of clusters 1 and 2. (L) Representative images and quantification show a sustained and transient decrease in H3K9me2,3 in EPC monolayers subjected to 5% and 40% stretch, respectively (n = 3 independent experiments with >200 cells/condition/experiment; p = 0.0451, Friedman/Dunn’s). Bar graphs show mean ± SD, boxplots show 95% confidence interval, scale bars represent 10 μm, and white arrows indicate stretch direction. AU, arbitrary units; GV, gray values. See also Figure S1.
Figure S1
Figure S1
Characterization of EPC Monolayer Changes in Response to Stretch, Related to Figure 1 (A) Quantifications of F-actin (phalloidin; magenta) and nuclear (dapi; cyan) orientation after 1440 min of uniaxial cyclic stretch (0.1 Hz) at indicated amplitudes (frequency distribution with n > 300 cells/condition pooled across 3 independent experiments). Note absence of alignment at 5% stretch. (B) Representative immunofluorescence images and quantification of F-actin (phalloidin; magenta) and nuclear (dapi; cyan) orientation in EPC monolayers exposed to 20% stretch from experiments shown in Figures 1B and 1C (frequency distribution with n > 300 cells/condition pooled across 3 independent experiments). (C) Quantification of nuclear volume (n = 3 independent experiments with 300 cells/condition/experiment). (D) Western blot analyses and quantification of selected phosphoproteins found altered in mass spectrometry experiments. Note transient versus sustained downregulation of Cluster 1 and 2 phosphoproteins, respectively, at 40% stretch, whereas all phosphoproteins show sustained response in 5% (n = 3 independent experiments). (E) Western blot analyses and quantification of H3K9me2,3 levels in EPC monolayers exposed to uniaxial stretch at indicated amplitudes and times (n = 3 independent experiments). (F) Representative immunofluorescence images and quantification of H3K9me2 in cells exposed to 5% or 40% stretch for indicated times (n = 3 independent experiments with > 200 cells/condition/experiment; ∗∗p = 0.0078, Friedman/Dunn’s). (G) Representative immunofluorescence images and quantification of H3K9me3 in cells exposed to 5% or 40% stretch for indicated times (n = 3 independent experiments with > 350 cells/condition/experiment; ∗∗p = 0.0393, Friedman/Dunn’s). Bar graphs and dot plots show mean ± SD, scale bars represent 10 μm, white arrows indicate stretch direction, AU = arbitrary units.
Figure 2
Figure 2
Stretch-Triggered Heterochromatin Changes Occur Mainly at Non-coding Regions with No Substantial Correlation with Transcriptional Changes (A) Distance-based clustering of differential H3K9me3 occupancy from ChIP-seq shows widespread decrease in H3K9me3 upon 40% stretch. (B) Biotype distribution of all identified H3K9me3 peaks and peaks increased or decreased by stretch. (C) Differential H3K9me3 peaks plotted according to chromosome position. (D) Genome browser views of representative H3K9me3 peaks with reduced intensity upon stretch: ribosomal RNA (left panel), non-coding intergenic region (middle panel), and subtelomeric region (right panel). Red boxes show chromosome location, and peak intensity range is in brackets. (E) Correlation plots and quantification of H3K9me3 and differential gene expression overlap after 30 min (left panel) and 360 min (right panel) of 40% stretch shows no significant correlation between transcriptional changes and altered H3K9me3 occupancy. (F) GO-term enrichment of significantly altered genes from RNA-seq after 30 min (left) and 360 min (right) of 40% stretch. (G) Volcano plots of differentially expressed transcripts (padj < 0.05) with examples of cell adhesion, H3K27me3 regulators, and epidermal differentiation genes highlighted. See also Figure S2.
Figure S2
Figure S2
Analyses of Epigenetic and Transcriptional Changes in Stretched Cells, Related to Figure 2 (A) Venn diagrams of overlap between differential H3K9me3 peaks found on protein-coding genes upon 30 min 40% stretch and differentially expressed genes after 30 or 360 min of 40% stretch. Note lack of overlap between H3K9me3 peaks down upon stretch and gene expression changes. (B) Quantification of chromosome distribution of genes that have decreased levels of H3K9me3 as determined by ChIPseq and corresponding increased levels of mRNA as determined by RNaseq. Grey dots show total amount of genes present in each chromosome. (C) GO-term analysis of genes upregulated (left panel) or downregulated (right panel) upon 360 min of 40% stretch. (D) Representative immunofluorescence images and quantification of phosphorylated (Serine2) RNA polymerase 2 (RNAPII-S2P) and H3K9me3 in cells exposed to 5% or 40% stretch for indicated times. Note minor increase in H3K27me3 at 360 min and a stable versus reversible decrease in RNAPII-S2P in 5% and 40% stretch, respectively (mean ± SD; n = 3 independent experiments with > 250 cells/condition/experiment; p = 0.0180, Friedman/Dunn’s). (E) Representative immunofluorescence images and quantification of RNAPII-S2P and H3K9me3 in cells exposed to 5% or 40% stretch for 24h. Note decrease in RNAPII-S2P and H3K9me3 in 5% but not in 40% stretch conditions (mean ± SD; n = 3 independent experiments with > 250 cells/condition/experiment; p = 0.0286, Friedman/Dunn’s). (F) Quantitative RT-PCR of selected EPC identity and differentiation genes from cells exposed to 5% stretch for 24 h (mean ± SEM; n = 3 independent experiments; p < 0.05, Student’s t test). (G) H3K9me3 and H3K7me3 chromatin immunoprecipitation and subsequent quantitative RT-PCR of selected regions with decreased H3K9me3 show lack of compensation with H3K27me3 (mean ± SEM; n = 2 independent experiments with technical replicates). Scale bars represent 20 μm, white arrows indicate stretch direction, AU = arbitrary units.
Figure S3
Figure S3
Analyses of Nuclear Lamina, Chromatin, and Membrane Tension in Stretched Cells, Related to Figure 3 (A) Profile plots of significantly changed NE-related phosphopeptides with 40% stretch identified by time-resolved phosphoproteomic analysis of stretched EPCs indicate downregulation of phosphosites shown to be hyperphosphorylated during mitotic NE breakdown. (B) Quantification of mitoses in EPC monolayers exposed to stretch at indicated amplitudes and times (n = 8 independent experiments with > 50 cells/experiment). (C and D) Representative western blots (C) and quantification (D) of total Lamin A/C, Lamin B1, and Lamin B2 (n = 3 independent experiments). (E) Representative light microscopy image of DRAQ5 photoconverted nuclei and transmission electron micrograph from the corresponding marked area. Cells analyzed further with electron tomography are indicated with arrowheads in the micrograph. (F) Representative force - distance curves from AFM force indentation experiments of untreated control cells (CNL) and cells treated with Cytochalasin D (CytoD) to depolymerize the F-actin cytoskeleton shows two components, corresponding to the soft cell cortex and cytoplasm (points A-B) and subsequently the stiffer nucleus. Curve slopes for both components are indicated. Only cortex component is affected by CytoD treatment. (G) AFM force indentation experiments of cells treated with CytoD (n = 3 independent experiments with > 60 nuclei/condition/experiment; no statistically significant difference found, Mann-Whitney). (H) Representative immunofluorescence images and quantification Lamin A expression in siLMNA cells show efficient depletion (n = 3 independent experiments with > 200 nuclei/condition/experiment; p = 0.05, Mann-Whitney; scale bars 20 μm). (I) AFM force indentation experiments of Lamin A depleted cells (siLMNA) (n = 3 independent experiments with > 50 nuclei/condition/experiment; ∗∗∗∗p < 0.0001, Mann-Whitney). (J) Representative image (lower panel with indicated ROI; PM = plasma membrane, ONM = outer nuclear membrane, scale bars 10 μm), frequency distribution of lifetimes and Chi2 measurements for goodness of fits for the single images of EPC monolayers stained with Flipper-TR membrane tension probe. Bar graphs show mean ± SD, boxplots show 95% confidence interval, AU = arbitrary units.
Figure 3
Figure 3
Stretch Induces Changes in NE Tension and Nuclear Mechanical Properties (A) Representative Lamin A/C images and quantification of EPCs exposed to stretch. Increased nuclear wrinkling (red arrows) is observed in 5% and transiently in 40% stretch. White arrows indicate stretch direction (three independent experiments with n > 350 cells/condition/experiment; p = 0.0451, ANOVA/Dunn’s). (B) Representative STORM images of Lamin A/C immunofluorescence (n > 34 cells/condition visualized from three independent experiments). (C) Representative structured illumination microscopy (SIM) images and intensity line scans from Lamin A/C and H3K9me3 immunostainings (inset: H3K9me3 alone). Dotted lines mark outer edges of Lamin A/C staining and arrowheads the most peripheral peak of H3K9me (n > 41 cells/condition from three independent experiments). (D) Representative electron micrographs and quantification of nuclear lamina-associated heterochromatin indicate transient nuclear wrinkling and decreased lamina-associated heterochromatin after 30 min of 40% stretch (n > 40 cells pooled across three independent experiments; p = 0.00284, Kruskal-Wallis/Dunn’s). (E) Force indentation spectroscopy showing sustained and transient decrease in nuclear elastic modulus in EPC monolayers subjected to 5% and 40% stretch, respectively (n > 140 nuclei/condition pooled across three independent experiments; ∗∗∗∗p = 0.0013, Kruskal-Wallis/Dunn’s). (F) Distribution of fluorescence lifetimes with Gaussian fits for Flipper-TR membrane tension probe. Note decreased nuclear membrane tension at 30 min of stretch (n > 360 nuclei/condition from three independent experiments; ∗∗p < 0.0001, Kolmogorov-Smirnov). Scale bars represent 2 μm in (D) and 5 μm in other panels. AU, arbitrary units. See also Figure S3.
Figure S4
Figure S4
H3K9me3 Regulates Chromatin Rheology and Nuclear Mechanics, Related to Figure 4 (A) Representative western blots and quantification of GFP-tagged wild-type (WT) Lamin A or Lamin A mutants (Serine 22 to Alanine (S22A) or S22A/S392A double mutant) show equal levels of expression. Lamin A band intensities are normalized to GAPDH (n = 3 independent experiments). (B) Representative immunofluorescence images of nuclei (DAPI), GFP, Lamin A/C, and H3K9me3 in cells expressing WT Lamin A-GFP or Lamin mutants S22A-GFP; S22A/S392A-GFP. (C and D) Quantification of Lamin A intensity and nuclear shape in WT Lamin A and mutant expressing cells (n = 3 independent experiments with > 100 nuclei/condition/experiment; p = 0.034, ANOVA/Dunnett’s). (E) AFM force indentation experiments of cells expressing WT Lamin A-GFP or Lamin mutants S22A-GFP; S22A/S392A-GFP (n = 3 independent experiments with > 40 nuclei/condition/experiment; no statistically significant difference found, Friedman/Dunn’s). (F) Representative immunofluorescence images and quantification of Suv39H1 levels in cells exposed to uniaxial 40% stretch for 30 min (n = 3 independent experiments with > 100 nuclei/condition/experiment; p = 0.05, Mann-Whitney) (G) Quantification of H3K9me3 intensity from cells in (B) (n = 3 independent experiments with > 30 nuclei/condition/experiment; no statistically significant difference found, Friedman/Dunn’s). (H) Representative immunofluorescence images and quantification of H3K9me3 levels in cells treated with JIB4 to inhibit H3K9me3 demethylation and exposed to 30 min uniaxial 40% stretch (n = 3 independent experiments with > 200 nuclei/condition/experiment; p = 0342, Friedman/Dunn’s). (I) Representative immunofluorescence images and quantification of Suv39H1 levels in cells transfected with Suv39H1-IRES-GFP or GFP only (n = 3 independent experiments with > 24 nuclei/condition/experiment). (J) Quantitative RT-PCR analyses of Suv39H1 mRNA expression, normalized to B2M in EPC monolayers where Suv39H1 has been silenced by siRNA (siSUV) (n = 3 independent experiments). (K) Representative immunofluorescence images and quantification of H3K9me3 in siSUV cells cells (n = 3 independent experiments with > 200 nuclei/condition/experiment; p = 0.05, Mann-Whitney). (L) AFM force indentation experiments of siSUV cells (n = 3 independent experiments with > 40 nuclei/condition/experiment; ∗∗∗∗p < 0.001, Mann-Whitney). (M) Quantification of chromatin rheology by mean square displacement versus lag time τ of CRISPR-rainbow labeled telomeres. From linear data, material properties of chromatin can be calculated from MSD = Deffτ, where a higher Deff corresponds to less condensed chromatin (n = 40 (GFP)/30 (Suv39-GFP) cells from 3 independent experiments; ∗∗∗p = 0.0001, Student’s t test). (N) Representative immunofluorescence images and quantification of cGAS-transfected cells to detect nuclear rupture in cells exposed to 30 or 360 min uniaxial 40% stretch. Note lack of perinuclear accumulation of cGAS indicating absence of nuclear rupture upon stretch. Inset shows accumulation of cGAS to chromatin upon mitotic breakdown of NE as positive control (n = 3 independent experiments with > 150 nuclei/condition/experiment). Bar graphs show mean ± SD, boxplots show 95% confidence interval, scale bars represent 10 μm, white arrows indicate stretch direction, AU = arbitrary units.
Figure 4
Figure 4
H3K9me3 Heterochromatin Regulates Nuclear Mechanics and Chromatin Mobility to Prevent DNA Damage (A) Representative western blots and quantification show reduced levels of Suv39H1 in response to stretch (mean ± SD; n = 3 independent experiments; p = 0.0438, ANOVA/Dunnet’s). (B–D) Representative images (B) and quantification of H3K9me3 (C) and nuclear wrinkling (D; white arrows) in GFP or Suv39H1-IRES-GFP expressing cells. Note increased H3K9me3 and lack of nuclear wrinkling in Suv39H1 expressing cells (n = 3 independent experiments with > 300 cells/condition/experiment; ∗∗p = 0.0053, Friedman/Dunn’s). (E) Force indentation experiments show that decreased nuclear stiffness in 40% stretch is prevented by expression of Suv39H1 (n > 100 cells/condition pooled across three independent experiments; ∗∗∗∗p = 0.0015, Kruskal-Wallis/Dunn’s). (F) Quantification of chromatin rheology by mean square displacement (MSD) versus lag time τ of CRISPR-Rainbow labeled telomeres. Note transient increase in mobility after 30 min of stretch, nonlinear with lag time, consistent with energy-dependent reorganization of chromatin (n > 21 cells/condition with >200 tracks/condition from three independent experiments; control and 360 min are statistically similar; ∗∗p < 0.001 at every lag time, Student’s t test). (G) Representative images and quantification demonstrating increased γH2AX-positive cells in Suv39-expressing cells upon 40% stretch (n = 4 independent experiments with >250 cells/condition/experiment; p = 0.018, Friedman/Dunn’s). Bar graphs show mean ± SD, boxplots show 95% confidence interval, white arrows indicate stretch direction, and scale bars represent 10 μm. AU, arbitrary units. See also Figure S4.
Figure 5
Figure 5
Chromatin Mechanoresponse Is Induced by Cell/Nuclear-Deformation-Triggered Intracellular Calcium Signaling (A) Representative F-actin (phalloidin), DAPI, and E-cadherin (E-cad) staining of α-catenin-depleted (siα-catenin) and scrambled control (siCNL) cells exposed to stretch. (B) Quantification of images in (A) shows absence of F-actin and nuclear alignment in siα-catenin cells (frequency distribution of >500 cells/experiment pooled across three independent experiments). (C and D) Representative images (C) and quantification (D) of H3K9me3 in α-catenin-depleted cells. Note absence of H3K9me3 recovery at 360 min stretch in siα-catenin cells (n = 3 independent experiments with >300 cells/condition/experiment; p = 0.0269, ∗∗p = 0.0099, repeated measures-ANOVA). (E) Representative heatmaps and images of Ca2+- sensor intensity during 10 cycles of 40% stretch (n > 100 cells from a representative of three independent experiments). (F) Representative images and quantification of H3K9me3 in cells treated with GdCl3. Note lack of stretch-induced H3K9me3 reduction in GdCl3-treated cells (n = 3 independent experiments with n > 200 cells/condition/experiment; p = 0.0164, Friedman/Dunn’s). (G) Representative F-actin images and quantification indicating lack of perinuclear actin rings in GdCl3-treated cells (n > 300 cells pooled across three independent experiments, p = 0.0338, Friedman/Dunn’s). (H) Representative images and quantification show an increase in γH2AX-positive cells in GdCl3-treated cells upon stretch (n = 3 independent experiments with n > 300 cells/condition/experiment; p = 0.0113, Friedman/Dunn’s). (I) Quantification of H3K9me3 in Piezo1-depleted cells (siPiezo1) shows absence of H3K9me3 reduction by stretch (n = 3 independent experiments with >350 cells/condition/experiment; p = 0.0164, Friedman/Dunn’s). (J) Representative staining and quantification showing an increase in γH2Ax-positive cells in stretched siPiezo1 cells (n = 3 independent experiments with >300 cells/condition/experiment; p = 0.0274, Friedman/Dunn’s). (K) Representative nuclear outlines and quantifications of equivalent nuclear radius imaged before and during 40% stretch. Δreq is % difference between equivalent radius during and prior to stretch in control (GFP) and SUV-IRES-GFP expressing cells (n > 40 cells pooled across three independent experiments). (L) Representative heatmaps of Ca2+- sensor dye Cal-590AM intensity prior and during 10 cycles of 40% stretch with or without thapsigargin pretreatment. Thapsigargin application triggers initial Ca2+ flash, after which the cells do not respond to stretch (n > 100 cells/condition from a representative of three independent experiments). (M) Representative immunofluorescence images and quantification of H3K9me3 in cells treated with BAPTA-AM to chelate intracellular calcium and subjected to stretch. Note lack of stretch-induced reduction in H3K9me3 in BAPTA-AM-treated cells (n = 3 independent experiments with n > 200 cells/condition/experiment; p = 0.0133, Friedman/Dunn’s). Bar graphs show mean ± SD, scale bars represent 20 μm, and white arrows indicate stretch direction. AU, arbitrary units. See also Figure S5.
Figure S5
Figure S5
Intracellular Ca2+ Regulates Heterochromatin, Related to Figure 5 (A) Representative immunofluorescence images and quantification of α-catenin-depleted EPCs (siα-catenin) and scrambled siRNA controls (siCNL) exposed to stretch. Note efficient depletion of α-catenin. (B) Quantification of adherens junction length (E-cad) show loss of junctions in α-catenin-depleted cells (n = 1000 cells/condition pooled across 3 independent experiments; p = 0.0009, Friedman/Dunn’s). (C) Motif-enrichment analysis of significantly altered phosphopeptide sequences using Phosida posttranslational modification database indicates over-representation of CDK1-5, CAMK, and AKT kinase consensus motifs. (D) Quantification of F-actin and nuclei of EPC monolayers treated with GdCl3 and exposed to stretch at indicated amplitudes and times. No effect of time-dependent reorientation of F-actin and nuclear axes perpendicular are seen with GdCl3. (E) Quantitative RT-PCR analyses of Piezo1 mRNA expression, normalized to B2M (upper panel) in EPC monolayers subjected to siRNA-mediated silencing of Piezo1 (n = 3 independent experiments). Ct values for Piezo2 mRNA in EPC monolayers are in the same range as no-template controls (NTC), indicating lack of expression and compensation upon Piezo1 silencing (lower panel). (F) Representative immunofluorescence image of siPiezo1 cells transfected with Piezo1-FLAG and stained with ER marker PDI and FLAG antibodies to detect Piezo1 localization. (G) Representative images of siPiezo1 cells show loss of stretch effect on H3K9me3 intensity (n = 3 independent experiments with > 300 cells/condition/experiment. (H) Representative immunofluorescence images and quantification of γH2AX in cells treated with BAPTA-AM (3 independent experiments with n > 200 cells/condition/experiment; ∗∗∗p < 0.0342, Friedman/Dunn’s). (I) Representative immunofluorescence images and quantification of H3K9me3 in the absence of extracellular Ca2+ (n > 350 cells/condition pooled across 3 independent experiments; ∗∗∗p < 0.0228, Friedman/Dunn’s). (J) Representative immunofluorescence images of E-cadherin (E-cad) at adherens junctions of cells cultured in the presence of 1.8mM Ca2+ but not in the absence of calcium (representative of 3 independent experiments). (K) Frequency distribution of quantification of F-actin (phalloidin; magenta) and nuclear (dapi; cyan) orientation in EPC monolayers exposed to 40% stretch from in the absence of calcium (n > 300 cells/condition pooled across 3 independent experiments). Bar graphs show mean ± SD, boxplots show 95% confidence interval, scale bars represent 5 μm in (F) and 10 μm in other panels, white arrows indicate stretch direction, AU = arbitrary units.
Figure 6
Figure 6
Minimum Nuclear Stiffness Is Required for Ca2+ Release and Subsequent Heterochromatin Response (A) Schematic representation of the compression system where compression depth depends on pillar height (red arrows) designed to compress nuclei. (B) Representative H3K9me3 images and quantification of cells compressed with and without 10 μm BAPTA-AM. Insets show DAPI stain. Compression triggers reduction in H3K9me3, prevented by BAPTA-AM (n = 3 independent experiments with >300 cells/condition/experiment; p = 0.0052, Friedman/Dunn’s). (C) Representative Lamin A/C images and quantification of EPCs, MSCs, and SCC9 and HT1080 cells exposed to 40% stretch for 30 min. MSCs contain highest Lamin A/C levels, whereas SCC9 and HT1080 cells have low Lamin A/C. Stretch has no effect on Lamin A/C (n = 3 independent experiments with n > 120 cells/condition/experiment). (D) Force indentation experiments indicating reduced nuclear stiffness in SCC9 and HT1080 cells (n > 60 cells/condition pooled across three independent experiments; ∗∗∗∗p = 0.0015, Kruskal-Wallis/Dunn’s). (E) Representative H3K9me3 images and quantification of EPCs, MSCs, and SCC9 and HT1080 cells exposed to 40% stretch for 30 min. Stretch reduces H3K9me3 in EPCs and MSCs but not in SCC9 and HT1080 cells (n = 3 independent experiments with n > 120 cells/condition/experiment p = 0.0303, Friedman/Dunn’s). (F) Representative heatmaps of Ca2+-sensor dye Cal-590AM intensity prior and during 10 cycles of 40% stretch in HT1080 cells with or without Lamin A overexpression. Note stronger Ca2+ response in Lamin-A-expressing cells (n = 26 cells/condition from a representative of three independent experiments). (G) Representative H3K9me3 immunofluorescence images and quantification of HT1080 cells with or without Lamin A-GFP overexpression exposed to 40% stretch for 30 min. Lamin A overexpression increases H3K9me3 and allows H3K9me3 decrease upon stretch (n = 3 independent experiments with n > 20 cells/condition/experiment; p = 0.0266, Friedman/Dunn’s). (H) Representative H3K9me3 immunofluorescence images and quantification of EPCs depleted of Lamin A (siLMNA) or scrambled control (siCNL) exposed to 40% stretch at for 30 min. siLMNA cells have lower baseline H3K9me3 levels which does not further decrease upon stretch (n = 3 independent experiments with n > 200 cells/condition/experiment; p = 0,0495, ∗∗p = 0.0023, Friedman/Dunn’s). Bar graphs show mean ± SD, boxplots show 95% confidence interval, scale bars represent 10 μm, and white arrows indicate stretch direction. AU, arbitrary units. See also Figure S6.
Figure S6
Figure S6
Analyses of Intracellular Ca2+ during Compression and Nuclear Stiffness upon Lamin A Depletion, Related to Figure 6 (A) Representative heatmap of calcium sensor dye Cal-590 intensity during compression and decompression of EPC monolayers show calcium release upon application of compression and upon compression release (red dotted lines; n = 3 independent experiments with > 40 cells /experiment). (B) AFM force indentation experiments of Lamin A-depleted cells (siLMNA) exposed to 30 min 40% stretch show decreased nuclear elastic modulus and lack of further effect by stretch in siLMNA cells (Boxplots with 95% confidence interval, n = 3 independent experiments with > 50 nuclei/condition/experiment; ∗∗∗∗p < 0.001, Kruskal-Wallis/Dunn’s).
Figure 7
Figure 7
Supracellular Monolayer Alignment Prevents Stress Transmission to the Nucleus and Chromatin (A) Experimental design to alter stretch direction after monolayer alignment. (B) Representative nuclear outlines and quantifications of equivalent radius before and during 40% stretch to measure stretch-induced nuclear deformation. Δreq is % difference between equivalent radius during and prior to stretch. Note the lack of nuclear deformation in perpendicularly aligned nuclei, whereas nuclei aligned parallel show substantial deformation. (n > 100 cells/condition pooled across three independent experiments). (C) Representative F-actin (phalloidin) and DAPI images of cells after second 40% stretch regime. Note the alignment of fibers at 40% 360 min before second stretch regime and monolayer disruption and reappearance of perinuclear actin after stretch direction change. (D) Quantification of F-actin alignment from experiments in (C) (frequency distribution of > 500 cells/condition pooled across 3 independent experiments). (E) Quantification of perinuclear actin intensity from experiments in (C) (n = 3 independent experiments with > 250 cells/condition/experiment; p = 0.0429, Friedman/Dunn’s). (F) Representative images and quantification of H3K9me3 intensity before and after stretch direction change (n = 3 independent experiments with > 300 cells/condition/experiment; p = 0.0278, Friedman/Dunn’s). (G) Representative images and quantification of E-cadherin (E-cad) junctions show loss of junction integrity after stretch direction change (frequency distribution of >300 cells/condition pooled across three independent experiments). (H–J) Representative images (H) and quantification of H3K9me2,3 intensity (I) and cell alignment (J) in mouse embryonic day 15.5 (E15.5) skin explants exposed to 40% stretch. Note the transient suppression of H3K9me2,3 intensity at 30 min, absence of apoptosis (inset, cleaved caspase-3), and emergence of alignment at 360 min of stretch (n = 7 mice/condition; ∗∗p = 0.0039, ∗∗∗p = 0.0003, ANOVA/Dunnett’s). (K) Representative images and quantification of H3K9me2,3 intensity in mouse embryo epidermal digit folds. H3K9me2,3 intensity is lower in epidermal stem cells (dotted line) in folds (n = 5 digit folds from 3 mice; 0.0159, Mann-Whitney). Bar graphs show mean ± SD, Scale bars represent 40 μm in (K) and 10 μm in other panels. White arrows indicate stretch direction. AU, arbitrary units. See also Figure S7.
Figure S7
Figure S7
Stretch Responses in Intact Skin, Related to Figure 7 (A) Representative F-actin (phalloidin; magenta), nuclear (dapi; cyan), and H3K9me3 (gray) immunofluorescence images of EPC monolayers exposed to biaxial cyclic stretch at 20% amplitude for 360 min. (B) Quantification of immunofluorescence images in (A) shows lack of F-actin and nuclear major axes reorientation (frequency distribution of > 500 cells/condition pooled across 3 independent experiments). (C) Quantification of H3K9me3 intensity from images in (A) shows a decrease in H3K9me3 in EPC monolayers subjected to 20% biaxial stretch (n = 3 independent experiments with > 200 cells/condition/experiment; p = 0.0113, paired t test). (D) Schematic illustration and images of ex vivo stretch experiments with E15.5 embryonic whole skin explants. (E) Quantification of H3K9me2,3 intensity from the first suprabasal layer of ex vivo stretched epidermis shows a decrease in H3K9me2,3 in EPC monolayers subjected to 40% uniaxial stretch (n = 3 independent experiments with > 200 cells/condition/experiment; p = 0.0435, ANOVA/Dunnet’s). (F–H) Schematic illustration, representative images (F), and quantification of α-catenin tension sensitive epitope antibody (α-18, gray) and phospho-myosin light chain 2 (pMLC2, magenta) immunofluorescence images in digit folds of E15.5 embryos (n = 8 digit folds from 3 mice; p = 0.0148, ∗∗p = 0.0070, Mann Whitney). (G) shows α-18 and pMLC2 intensity as a function of distance, (H) shows α-18 and pMLC2 mean intensity in the digit fold and distal from the fold. Bar graphs show mean ± SD, scale bars represent 20 μm, white arrows indicate stretch direction, AU = arbitrary units.

Comment in

References

    1. Adding L.C., Bannenberg G.L., Gustafsson L.E. Basic experimental studies and clinical aspects of gadolinium salts and chelates. Cardiovasc. Drug Rev. 2001;19:41–56. - PubMed
    1. Anlaş A.A., Nelson C.M. Tissue mechanics regulates form, function, and dysfunction. Curr. Opin. Cell Biol. 2018;54:98–105. - PMC - PubMed
    1. Becker J.S., Nicetto D., Zaret K.S. H3K9me3-dependent heterochromatin: barrier to cell fate changes. Trends Genet. 2016;32:29–41. - PMC - PubMed
    1. Belevich I., Joensuu M., Kumar D., Vihinen H., Jokitalo E. Microscopy image browser: a platform for segmentation and analysis of multidimensional datasets. PLoS Biol. 2016;14:e1002340. - PMC - PubMed
    1. Bian Q., Khanna N., Alvikas J., Belmont A.S. β-Globin cis-elements determine differential nuclear targeting through epigenetic modifications. J. Cell Biol. 2013;203:767–783. - PMC - PubMed

Publication types