. 2020 Jun 15;80(12):2586-2598.
doi: 10.1158/0008-5472.CAN-19-2660. Epub 2020 Apr 17.

Tumor Cell-Derived Angiopoietin-2 Promotes Metastasis in Melanoma

Affiliations

Tumor Cell-Derived Angiopoietin-2 Promotes Metastasis in Melanoma

Ashik Ahmed Abdul Pari et al. Cancer Res. .

Abstract

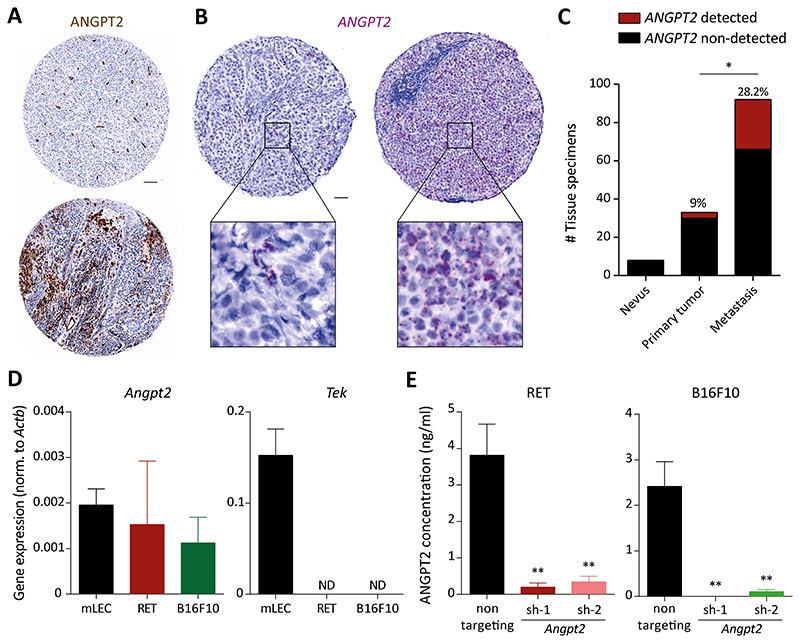
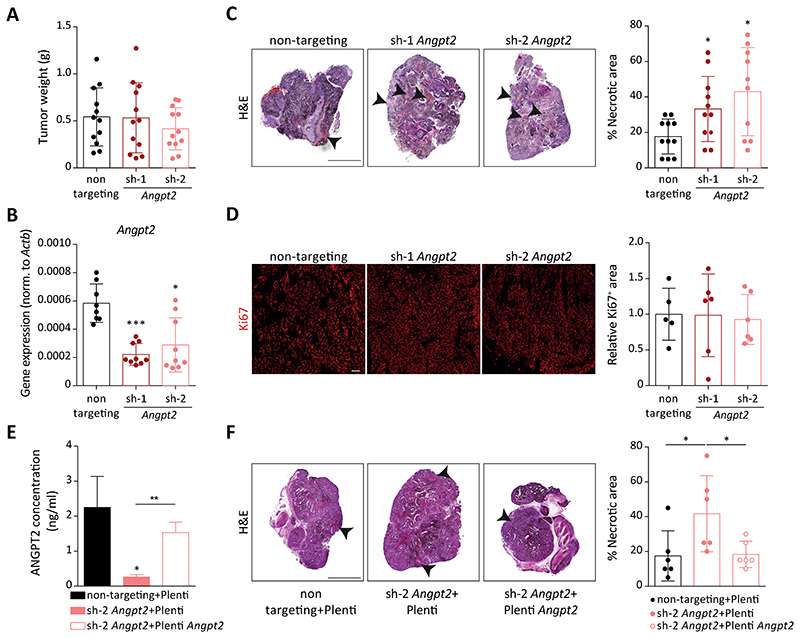
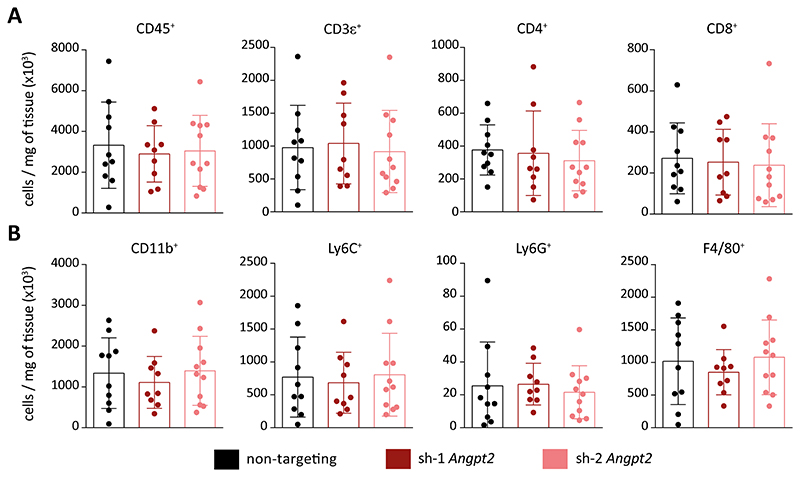
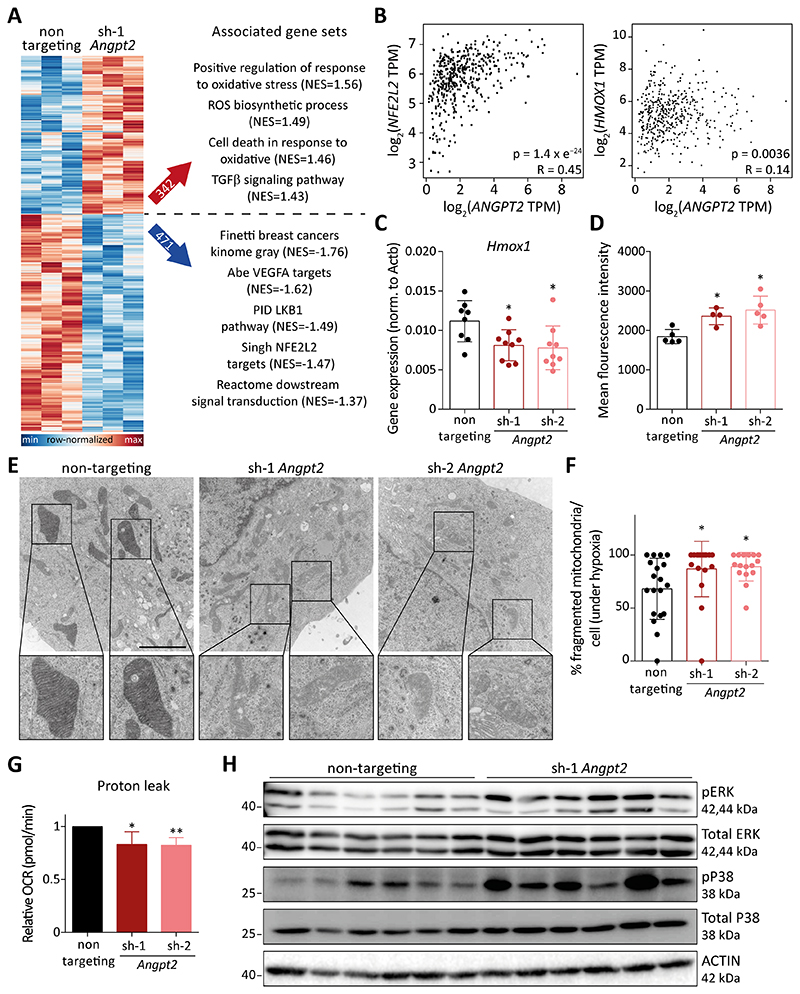
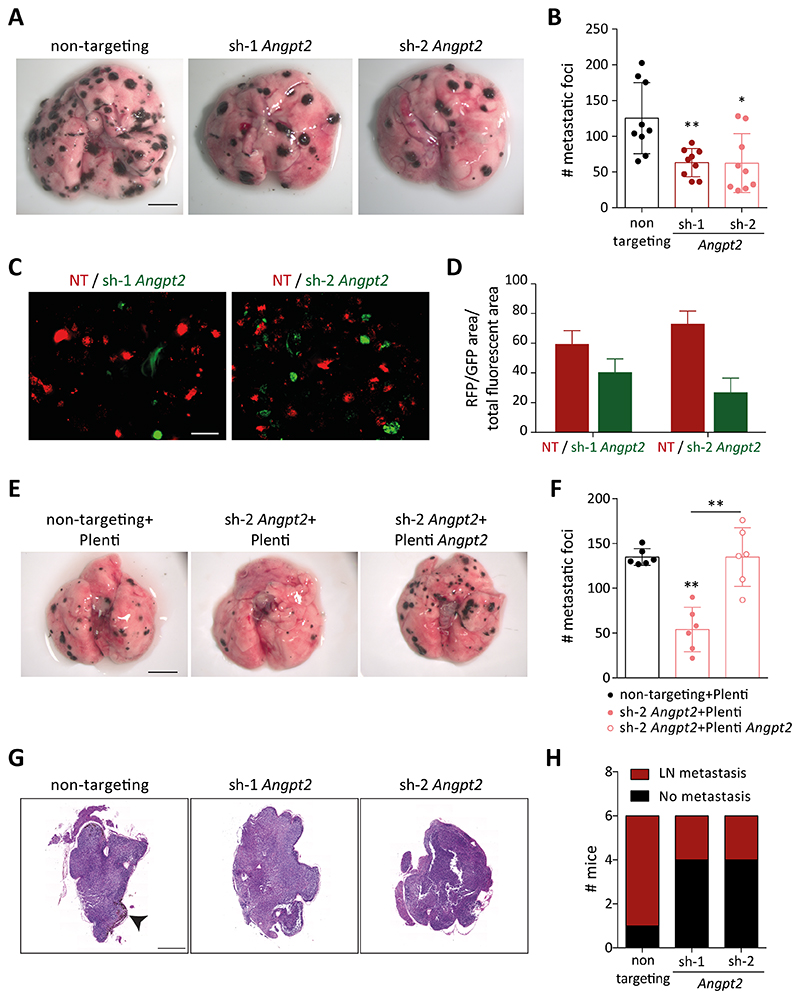
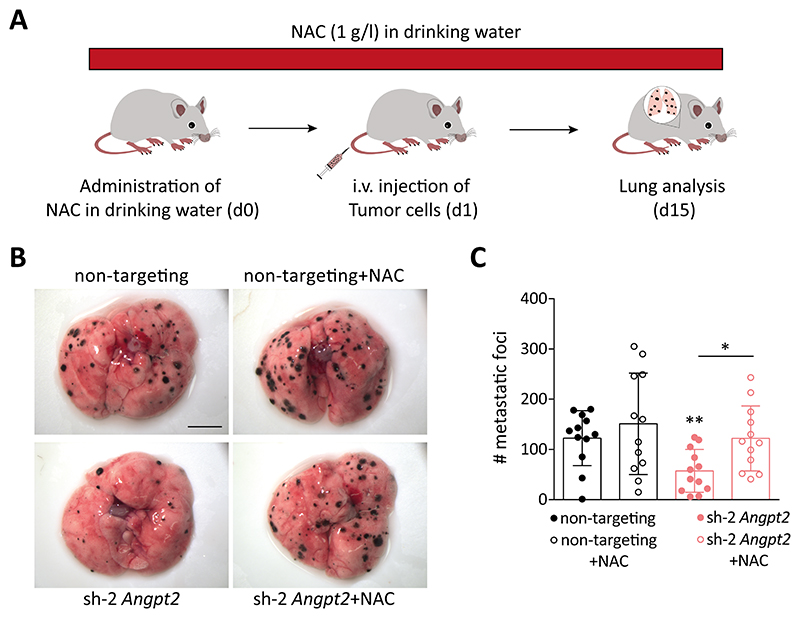
The angiopoietin (Angpt)-TIE signaling pathway controls vascular maturation and maintains the quiescent phenotype of resting vasculature. The contextual agonistic and antagonistic Tie2 ligand ANGPT2 is believed to be exclusively produced by endothelial cells, disrupting constitutive ANGPT1-TIE2 signaling to destabilize the microvasculature during pathologic disorders like inflammation and cancer. However, scattered reports have also portrayed tumor cells as a source of ANGPT2. Employing ISH-based detection of ANGPT2, we found strong tumor cell expression of ANGPT2 in a subset of patients with melanoma. Comparative analysis of biopsies revealed a higher fraction of ANGPT2-expressing tumor cells in metastatic versus primary sites. Tumor cell-expressed Angpt2 was dispensable for primary tumor growth, yet in-depth analysis of primary tumors revealed enhanced intratumoral necrosis upon silencing of tumor cell Angpt2 expression in the absence of significant immune and vascular alterations. Global transcriptional profiling of Angpt2-deficient tumor cells identified perturbations in redox homeostasis and an increased response to cellular oxidative stress. Ultrastructural analyses illustrated a significant increase of dysfunctional mitochondria in Angpt2-silenced tumor cells, thereby resulting in enhanced reactive oxygen species (ROS) production and downstream MAPK stress signaling. Functionally, enhanced ROS in Angpt2-silenced tumor cells reduced colonization potential in vitro and in vivo. Taken together, these findings uncover the hitherto unappreciated role of tumor cell-expressed ANGPT2 as an autocrine-positive regulator of metastatic colonization and validate ANGPT2 as a therapeutic target for a well-defined subset of patients with melanoma. SIGNIFICANCE: This study reveals that tumor cells can be a source of ANGPT2 in the tumor microenvironment and that tumor cell-derived ANGPT2 augments metastatic colonization by protecting tumor cells from oxidative stress.


Conflict of interest statement

Conflict of interest: Markus Thomas is an employee of Roche.

Figures

Figure 1
Figure 1. Melanoma cells express ANGPT2.
(A) Immunohistochemical analysis of ANGPT2 expression in tissue biopsies of human melanomas. Scale bar: 100μM. (B) Tissue sections from melanoma patients were stained with ANGPT2 RNASCOPE probe. Square boxes depict regions of interest (ROIs) at a higher magnification. Scale bar: 50μM. (C) Quantitation of the number of patients with detectable expression of ANGPT2 in tumor cells of benign melanocytic nevi (n=8), primary (n=33), and metastatic melanomas (n=92). *, p<0.05, Chi-square test. (D) Angpt2 and Tek expression were quantified using qRT-PCR in mouse melanoma cell lines and mouse lung EC (ND= non-detected). (E) ANGPT2 ELISA was performed to quantify ANGPT2 protein in supernatants of control and Angpt2 knockdown cells (sh-1 and sh-2) in RET and B16F10n=3; mean ± SD). *, p<0.05, **, p<0.01, two-tailed unpaired Student’s t-test.
Figure 2
Figure 2. Angpt2 knockdown in tumor cells does not alter primary tumor growth.
(A) Tumor weight at day 14 after primary tumor inoculation of control RET and knockdown cell lines (n=12; mean ± SD). (B) Angpt2 expression in control and Angpt2 knockdown RET primary tumors quantified by qRT-PCR (n=8-9; mean ± SD). *, p<0.05, ****, p<0.0001, Mann Whitney U test. (C) On the left, representative H&E images of control and Angpt2 knockdown RET primary tumors are shown. Arrowheads indicate necrotic area. Scale bar: 1mm. On the right, quantitation of necrotic area is shown (n=9-11 mean ± SD). *, p<0.05, Mann Whitney U test. (D) On the left, representative images of tumor sections stained with KI67 (in red). Scale bar: 200μm. On the right, quantitation of KI67-positive area normalized to DAPI area in control and Angpt2 knockdown RET primary tumors (n=5-6; mean ± SD). (E) ANGPT2 ELISA was performed to quantify ANGPT2 protein levels in supernatants of control+Plenti, sh-2+Plenti and sh-2+Plenti Angpt2 cells in RET (n=3; mean ± SD). *, p<0.05, **, p<0.01, two-tailed unpaired Student’s t-test. (F) On the left, representative H&E images of control+Plenti, sh-2+Plenti and sh-2+Plenti Angpt2 RET primary tumors are shown. Arrowheads indicate necrotic area. Scale bar: 1mm. On the right, quantitation of necrotic area is shown (n=6 mean ± SD). *, p<0.05, Mann Whitney U test.
Figure 3
Figure 3. Angpt2 knockdown in tumor cells does not impact immune cell infiltration.
(A-B) FACS-based immune analysis was performed control and Angpt2 knockdown RET primary tumors on day 14 after tumor implantation. Shown are the quantitation of tumor infiltrating lymphoid (A) and myeloid cells (B) (n=9-11; mean ± SD). All comparisons were rendered non-significant by Mann Whitney U test.
Figure 4
Figure 4. Tumor cell-expressed Angpt2 modulates ROS and mitochondrial homeostasis.
(A) On the left, heatmap depicting differentially regulated genes between control- and Angpt2-silenced tumor cells. On the right, gene set enrichment analysis identifying alterations in pathways involved in maintaining oxidative homeostasis (NES=normalized enrichment score). (B) Spearman correlation analysis of ANGPT2, NFE2L2, and HMOX1 in cutaneous melanoma (SKCM) dataset from TCGA database. (C) Hmox1 expression in control and Angpt2 knockdown RET primary tumors was quantified using qRT-PCR (n=8-9; mean ± SD). *, p<0.05, Mann Whitney U test. (D) FACS analysis of ROS levels in control and Angpt2 knockdown RET primary tumors (n=4-5; mean ± SD). *, p<0.05, Mann Whitney U test. (E) Representative electron microscopic images depicting morphological changes in mitochondria of wild type and Angpt2-silenced RET tumor cells. Cells were kept under 1% O2 and serum starvation condition for 24h before processing for electron microscopy. Square boxes depict ROIs at higher magnification. Scale bar: 2μm. (F) Quantitation of fragmented mitochondria per cell (n=16-19 cells/condition; mean ± SD). *, p<0.05, Mann Whitney U test. (G) Proton leak in control and Angpt2 knockdown RET tumor cells was measured in a Seahorse Mito Stress experiment. Prior to Seahorse analysis, cells were kept under 1% O2 for 6h (n=5; mean ± SD). *p<0.05, **p<0.01, two-tailed paired Student’s t-test. (H) Western blot analysis was performed for phospho-ERK, phospho-P38, total-P38, and total-ERK in control and Angpt2 knockdown RET primary tumors. Actin was used as a loading control (n=6).
Figure 5
Figure 5. Tumor cell-expressed Angpt2 promotes metastasis.
(A) Control or Angpt2-deficient RET cells were injected into the tail vein of C57BL/6N mice. Mice were sacrificed after 14 days. Shown are the representative images of lung metastatic foci imaged under a stereomicroscope. Scale bar: 5mm. (B) The graph represents the quantitation of lung metastatic foci (n=9; mean ± SD). *, p<0.05, **, p<0.01, Mann Whitney U test. (C) Control (in red) and Angpt2-silenced (in green) RET tumor cells were co-injected intravenously in mice. Lungs were harvested 14 days after tumor cell inoculation and visualized under a fluorescent dissection microscope. Representative images of lung metastatic foci are shown. Scale bar: 2mm. (D) Quantitation of lung colonization by control (in red) or Angpt2-silenced (in green) RET tumor cells. The area of each metastatic colony (RFP/GFP) was normalized to the combined fluorescent area (n=5-6; mean ± SD). (E) Control+Plenti, sh-2+Plenti and sh-2+Plenti Angpt2 cells were injected into the tail vein of C57BL/6N mice. Mice were sacrificed after 14 days. Shown are representative images of lung metastatic foci imaged under a stereomicroscope. Scale bar: 5mm. (F) The graph represents the quantitation of lung metastatic foci (n=6; mean ± SD). **, p<0.01, Mann Whitney U test. (G) WT C57BL/6N mice were intradermally injected with either 300,000 control or Angpt2 knockdown RET tumor cells in the ear and regional LN were collected 2 weeks later. Representative H&E images of LN. Arrowheads indicate detectable metastases. (H) The incidence of LN metastasis is depicted (n=6).
Figure 6
Figure 6. Administration of NAC rescues metastasis.
(A) Schematic illustration of the rescue experiment to investigate the influence of ROS on regulating tumor cell-Angpt2 mediated metastasis. (B) Control or Angpt2-deficient RET cells were injected into the tail vein of C57BL/6N mice. Mice were administered either regular water or water containing 1g/l NAC. Mice were sacrificed after 14 days. Shown are the representative images of lung metastatic foci imaged under a stereomicroscope. Scale bar: 5mm. (C) The graph represents the quantitation of lung metastatic foci (n=12; mean ± SD). *, p<0.05, **, p<0.01, Mann Whitney U test.

References

    1. Siegel RL, Miller KD, Jemal A. Cancer statistics, 2019. CA Cancer J Clin. 2019;69:7–34. - PubMed
    1. Schadendorf D, Fisher DE, Garbe C, Gershenwald JE, Grob JJ, Halpern A, et al. Melanoma. Nat Rev Dis Primers. 2015;1:15003. - PubMed
    1. Gide TN, Wilmott JS, Scolyer RA, Long GV. Primary and acquired resistance to immune checkpoint inhibitors in metastatic melanoma. Clin Cancer Res. 2018;24:1260–70. - PubMed
    1. Schadendorf D, van Akkooi ACJ, Berking C, Griewank KG, Gutzmer R, Hauschild A, et al. Melanoma. Lancet. 2018;392:971–84. - PubMed
    1. Saharinen P, Eklund L, Alitalo K. Therapeutic targeting of the angiopoietin-TIE pathway. Nat Rev Drug Discov. 2017;16:635–61. - PubMed

Publication types

MeSH terms