

High resolution temporal profiles in the Emissions Database for Global Atmospheric Research
- PMID: 32303685
- PMCID: PMC7165169
- DOI: 10.1038/s41597-020-0462-2
High resolution temporal profiles in the Emissions Database for Global Atmospheric Research
Abstract
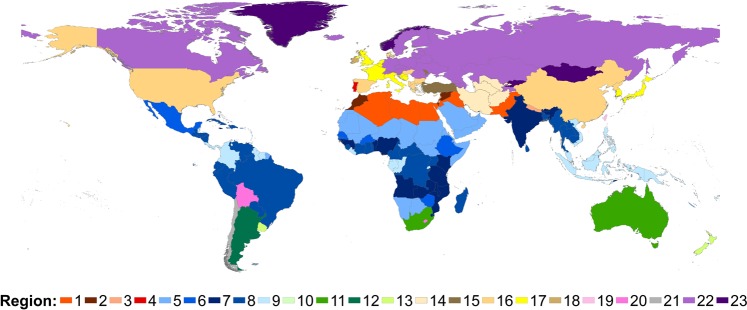
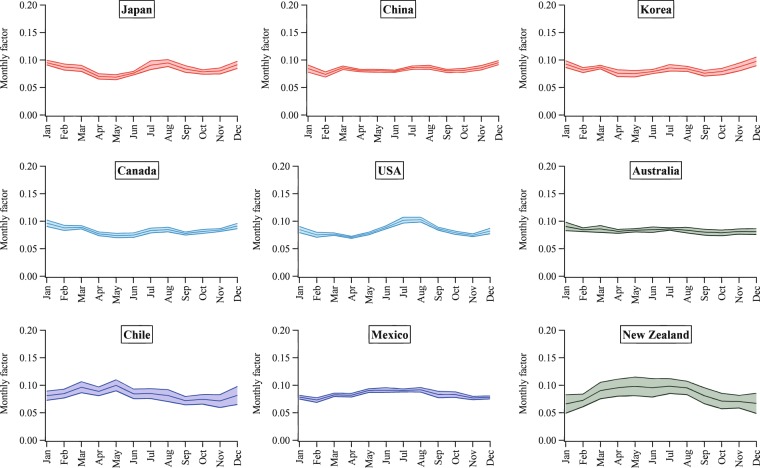
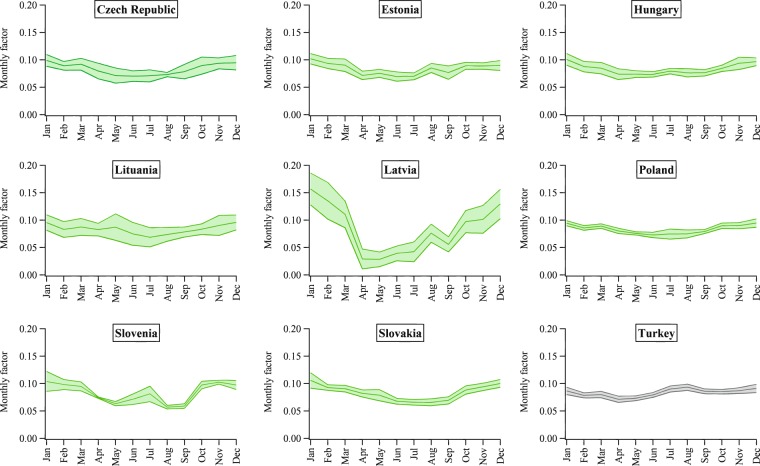
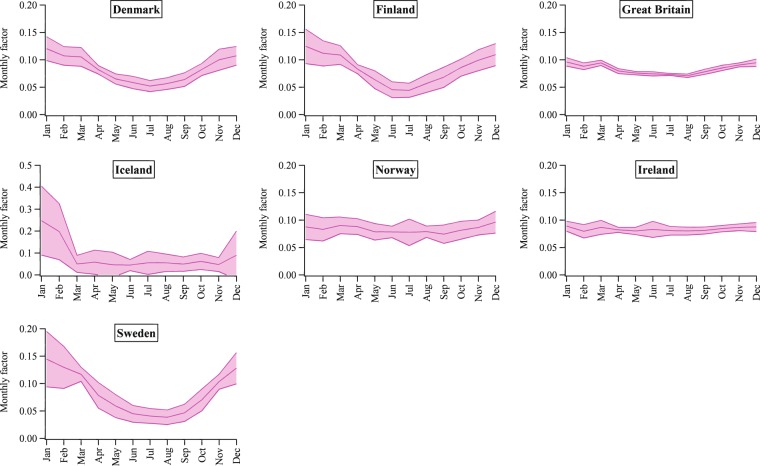
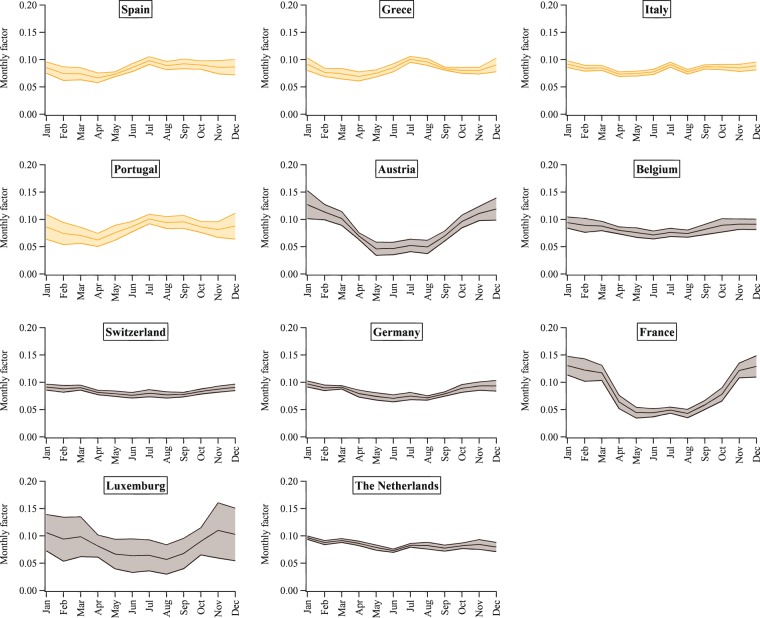
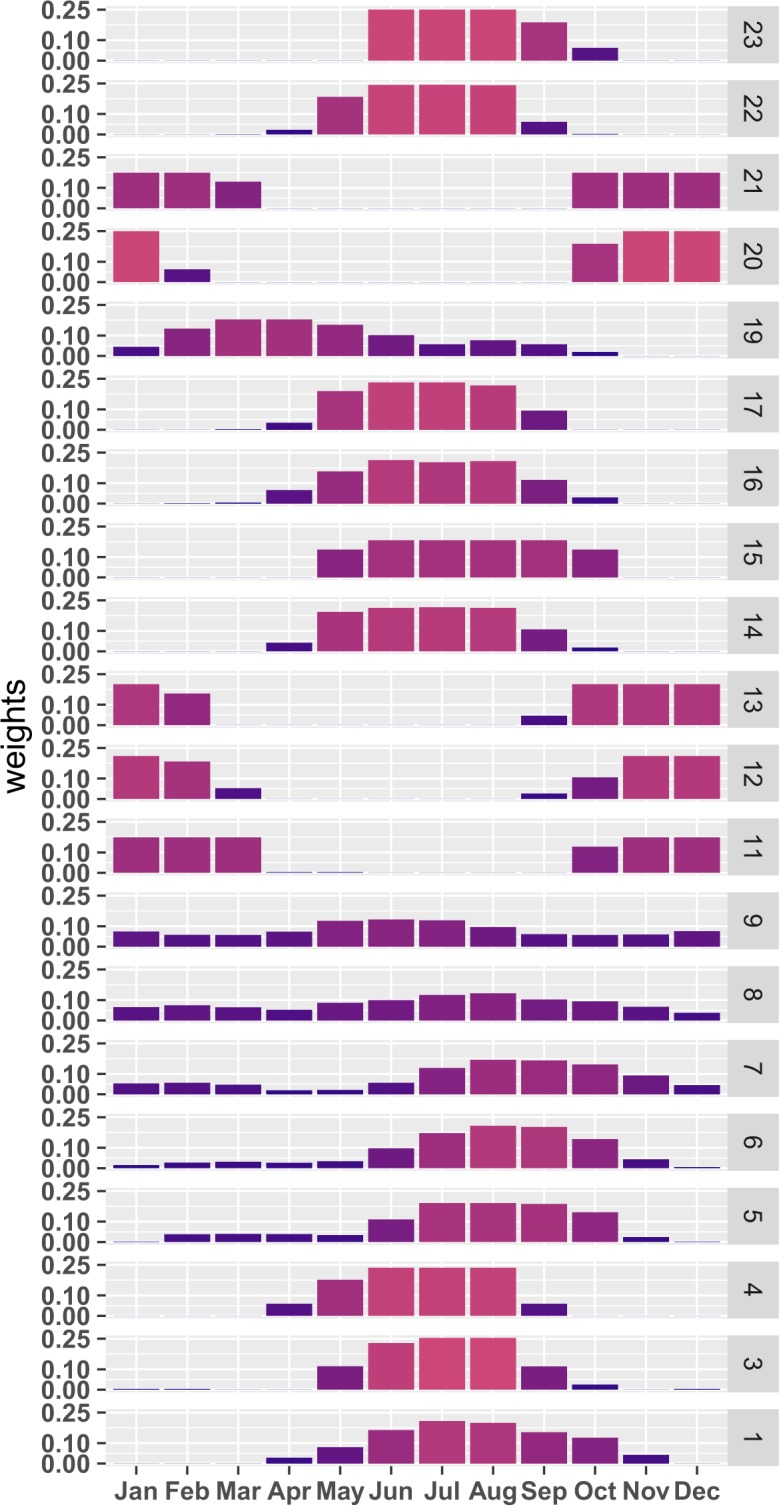
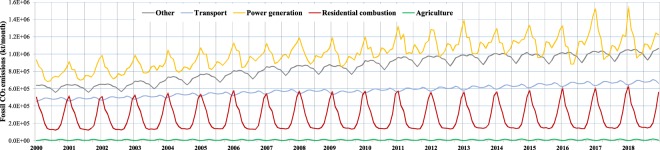
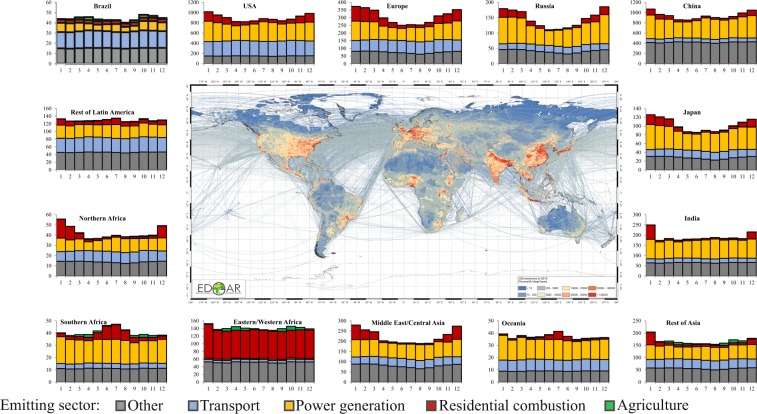
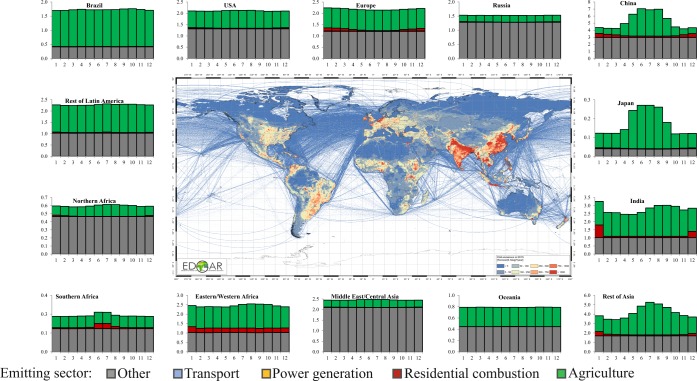
Emissions into the atmosphere from human activities show marked temporal variations, from inter-annual to hourly levels. The consolidated practice of calculating yearly emissions follows the same temporal allocation of the underlying annual statistics. However, yearly emissions might not reflect heavy pollution episodes, seasonal trends, or any time-dependant atmospheric process. This study develops high-time resolution profiles for air pollutants and greenhouse gases co- emitted by anthropogenic sources in support of atmospheric modelling, Earth observation communities and decision makers. The key novelties of the Emissions Database for Global Atmospheric Research (EDGAR) temporal profiles are the development of (i) country/region- and sector- specific yearly profiles for all sources, (ii) time dependent yearly profiles for sources with inter-annual variability of their seasonal pattern, (iii) country- specific weekly and daily profiles to represent hourly emissions, (iv) a flexible system to compute hourly emissions including input from different users. This work creates a harmonized emission temporal distribution to be applied to any emission database as input for atmospheric models, thus promoting homogeneity in inter-comparison exercises.
Conflict of interest statement
The authors declare no competing interests.
Figures
References
-
- Crisp D, et al. The Orbiting Carbon Observatory (OCO) mission. Advances in Space Research. 2004;34:700–709. doi: 10.1016/j.asr.2003.08.062. - DOI
-
- Yokota T, et al. Global Concentrations of CO2 and CH4 Retrieved from GOSAT: First Preliminary Results. SOLA. 2009;5:160–163. doi: 10.2151/sola.2009-041. - DOI
-
- Yoshida Y, et al. Retrieval algorithm for CO2 and CH4 column abundances from short-wavelength infrared spectral observations by the Greenhouse gases observing satellite. Atmos. Meas. Tech. 2011;4:717–734. doi: 10.5194/amt-4-717-2011. - DOI
-
- Andres RJ, Gregg JS, Losey L, Marland G, Boden TA. Monthly, global emissions of carbon dioxide from fossil fuel consumption. Tellus B: Chemical and Physical Meteorology. 2011;63:309–327. doi: 10.1111/j.1600-0889.2011.00530.x. - DOI
-
- Lenhart L, Friedrich R. European emission data with high temporal and spatial resolution. Water, Air, & Soil Pollution. 1995;85:1897–1902. doi: 10.1007/bf01186111. - DOI
LinkOut - more resources
Full Text Sources
