Case Reports
. 2020 May;40(4):554-566.
doi: 10.1007/s10875-020-00778-7. Epub 2020 Apr 17.

Infantile Myelofibrosis and Myeloproliferation with CDC42 Dysfunction

Affiliations
Case Reports

Infantile Myelofibrosis and Myeloproliferation with CDC42 Dysfunction

Jeffrey M Verboon et al. J Clin Immunol. 2020 May.

Abstract

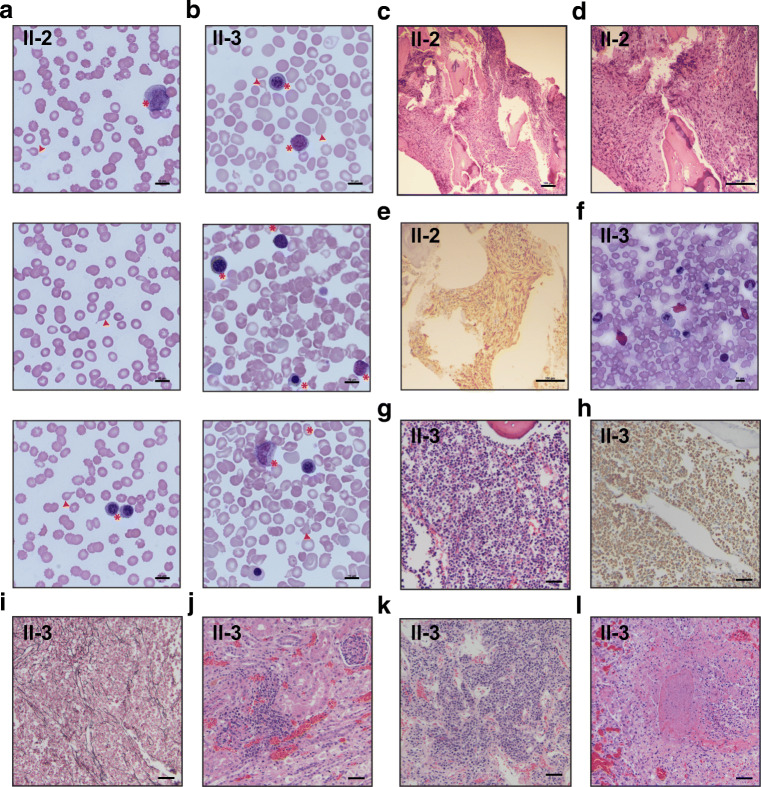
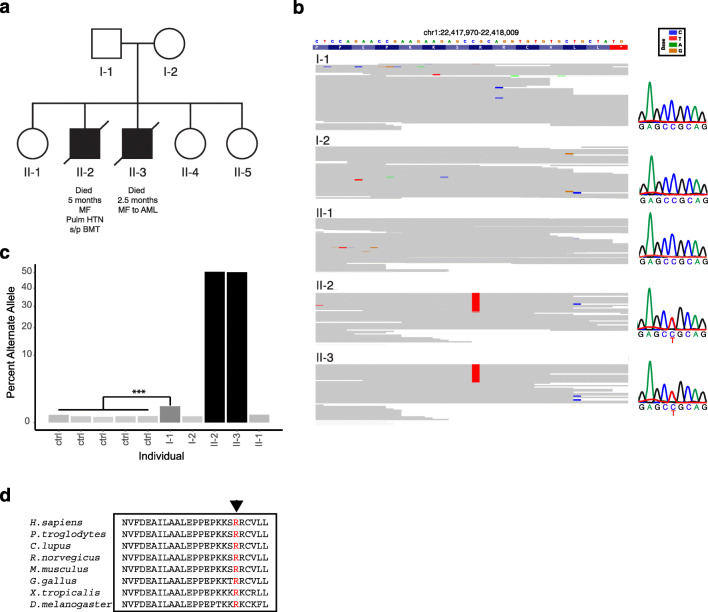
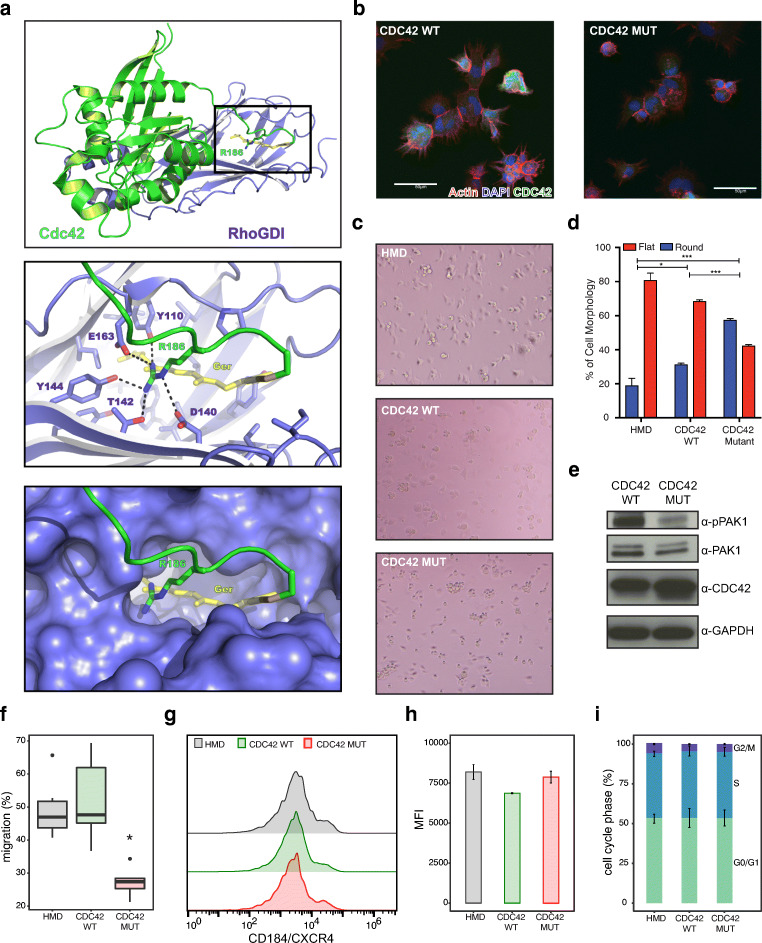
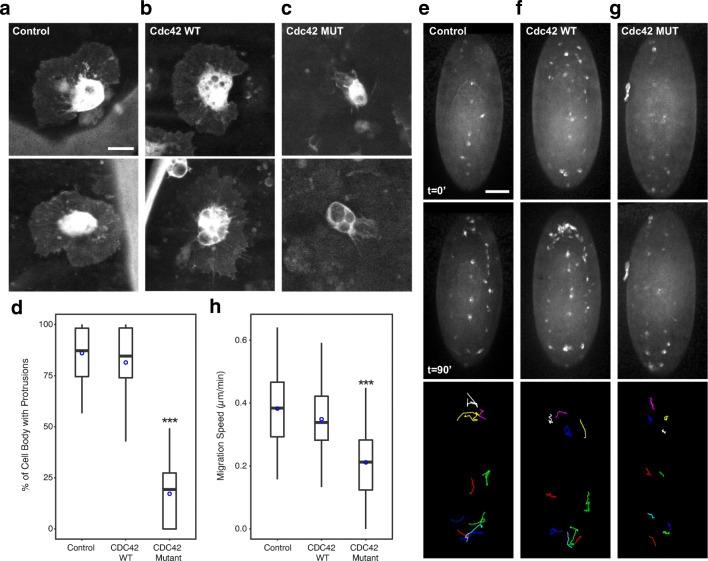
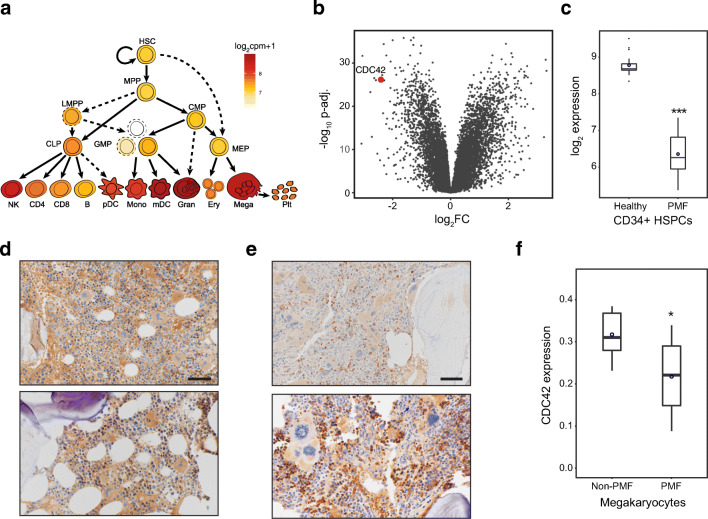
Studies of genetic blood disorders have advanced our understanding of the intrinsic regulation of hematopoiesis. However, such genetic studies have only yielded limited insights into how interactions between hematopoietic cells and their microenvironment are regulated. Here, we describe two affected siblings with infantile myelofibrosis and myeloproliferation that share a common de novo mutation in the Rho GTPase CDC42 (Chr1:22417990:C>T, p.R186C) due to paternal germline mosaicism. Functional studies using human cells and flies demonstrate that this CDC42 mutant has altered activity and thereby disrupts interactions between hematopoietic progenitors and key tissue microenvironmental factors. These findings suggest that further investigation of this and other related disorders may provide insights into how hematopoietic cell-microenvironment interactions play a role in human health and can be disrupted in disease. In addition, we suggest that deregulation of CDC42 may underlie more common blood disorders, such as primary myelofibrosis.

Keywords: Primary Myelofibrosis; Rho GTPases; bone marrow microenvironment.


Conflict of interest statement

All family members provided written informed consent to participate in this study. The institutional review boards of Boston Children’s Hospital and Massachusetts Institute of Technology approved the study protocols.

The authors declare that they have no competing interests.

Figures

Fig. 1
Fig. 1
Hematologic profile of patients with infantile myelofibrosis. a, b Blood smears from patients II-2 and III-3 showing tear drops and leucoerythroblastic picture in the circulation. Shown at × 1000 magnification, scale bar = 10 μm. Teardrop cells are indicated by red arrows. Early myeloid and erythroid precursor cells are indicated with asterisks. c Hematoxylin and eosin-stained bone marrow section showing myelofibrosis from patient II-2. Shown at × 100 magnification, scale bar = 100 μm. d Hematoxylin and eosin (H&E)-stained bone marrow section showing myelofibrosis from patient II-2. Shown at × 200 magnification, scale bar = 100 μm. e Vimentin immunohistochemical-stained bone marrow showing myelofibrosis from patient II-2. Shown at × 200 magnification, scale bar = 100 μm. f Bone marrow aspirate from patient III-3 obtained on day of life 1 demonstrating erythroid dysplasia consisting of erythroid precursors with karyorrhexis, nuclear blebbing, and atypical nuclear contours. There is also left-shifted granulopoiesis. Shown at × 600 magnification, scale bar = 10 μm.g–l Autopsy findings of patient III-3, all shown at × 200 magnification, scale bars = 50 μm.g Representative sections of vertebral column demonstrate hypercellular bone marrow comprised exclusively of early myeloid cells (H&E) highlighted by h myeloperoxidase (MPO) immunostain with i mild fibrosis (reticulin stain). Representative sections of the j bilateral kidneys show multifocal interstitial early myeloid progenitor cells without evidence of extramedullary trilineage hematopoiesis (H&E). k Representative sections of lymph nodes show multifocal clusters of early myeloid progenitor cells predominantly within the medulla (H&E). l Lungs show multifocal necrotizing lesions with frequent neutrophils (H&E)
Fig. 2
Fig. 2
Identification of the R186C missense mutation in CDC42 in two patients with infantile myelofibrosis. a Pedigree of the kindred affected by infantile myelofibrosis. b Visualization of the variant (Chr1:22417990:C>T)-containing region showing the heterozygous variant in the two affected children, which is absent from all unaffected family members. This visualization was produced using the Integrated Genomics Viewer. Exome variant results were validated by using Sanger sequencing, as shown on the right. c Quantification of reads containing the Chr1:22417990:C>T (hg19 coordinates) variant from deep-sequenced amplicons. P values indicated from binomial test. d Alignment of CDC42 from diverse eukaryotes shows that the R186 residue is highly conserved
Fig. 3
Fig. 3
Deregulated activity of the CDC42 R186C mutation leads to altered cell migration. a A visualization using Pymol of the interaction between CDC42 and RhoGDI with the critical interactions by the R186 residue highlighted in the zoomed in bottom two panels. b Confocal micrographs of 3T3 cells infected with FLAG-tagged WT CDC42 showing normal filopodia formation when plated on fibronectin-coated slides. In contrast, the FLAG-tagged CDC42 R186C mutant cells lack filopodia. Scale bars 50 μm. c Light microscopic images of 3T3 cells infected with an empty HMD vector, WT CDC42, or mutant CDC42 plated onto fibronectin-coated plates for 45 min. HMD and WT CDC42-infected cells showed a higher percentage of flat cells, as compared with the presence of rounded cells. d Quantification (mean ± SEM) of observed flattened versus rounded 3T3 cell morphology (the total number of cells assessed per condition was HMD = 637, WT CDC42 = 462, and CDC42 R186C= 545, which were quantified across 3 biological replicates). e Protein lysates of 3T3 cells infected with WT CDC42 and mutant CDC42 vectors analyzed by western blotting. PAK1 expression remains the same between two conditions, but phosphorylated PAK1 shows reduced expression. Representative experiment is shown.f CD34+ HSPCs infected with the control vector or WT CDC42 show more migration towards CXCL12/SDF-1 over a 4 h time period in a transwell migration assay, compared with cells overexpressing mutant CDC42 R186C (mean ± SD, n = 6, *p < 0.05, two-tailed t test). g CXCR4 surface expression of infected CD34+ HSPCs with respective vectors shows similar expression patterns. h Quantification of CD184/CXCR4 mean fluorescence intensity of different conditions shows little variation (mean ± SD, n = 3, two-tailed t test). i The percentage of CD34+ HSPCs in various cell cycle phases show no difference among HMD-, WT CDC42-, and mutant CDC42-transduced cells (mean ± SD, n = 6, two-tailedt test)
Fig. 4
Fig. 4
Defective migration due to dominant-negative or neomorphic Cdc42 activity in Drosophila hemocytes. ac Confocal projections of hemocytes in GFP-expressing embryos of control (Gal4 driver alone) (a), UAS-Cdc42 WT (b), and UAS-Cdc42 mutant (c). d Boxplot of the percentage of the hemocyte cell body with protrusions (n ≥ 20). e–g Time-lapse series of ventral surface projections of control (e), UAS-Cdc42 WT (f), and UAS-Cdc42 mutant (g) migrating hemocytes expressing GFP. T = 0 min (top panel) and t = 90 min (middle panel) time points are shown. Random hemocytes were tracked every 5 min for 90′ (bottom panel) and show reduced migration distances.h Boxplot of hemocyte migration speed (n = 100). P values are indicated. Mean values are indicated by blue circles. Scale bars 10 μm forac and 50 μm foreg
Fig. 5
Fig. 5
Potential role for CDC42 deregulation in primary human myelofibrosis. a Schematic of hematopoiesis showing log2 (cpm+1) expression from RNA sequencing of CDC42 across the hematopoietic hierarchy.b A volcano plot showing log2 fold change (FC) of differentially expressed genes between CD34+ HSPCs from peripheral blood in control (n = 16) compared with PMF patient samples (n = 42) at indicated P values. CDC42 is among the most downregulated genes in PMF CD34+ HSPCs. c Box plot depicting log2 expression of CDC42 in CD34+ HSPCs from peripheral blood in control versus PMF patient samples shows a > 5-fold reduction in expression. ds Representative immunohistochemical stains for CDC42 in the bone marrow of normocellular individuals (d) or individuals with PMF (e). f Quantification of CDC42 staining intensity in megakaryocytes from 10 PMF patients and 7 normocellular marrows for comparison. Between 3 and 14 megakaryocytes were measured from each individual. Mean values are indicated by blue circles

References

    1. Abdulhay, N.J., C. Fiorini, J.M. Verboon, L.S. Ludwig, J.C. Ulirsch, B. Zieger, C.A. Lareau, X. Mi, A. Roy, E.A. Obeng, M. Erlacher, N. Gupta, S.B. Gabriel, B.L. Ebert, C.M. Niemeyer, R.N. Khoriaty, P. Ancliff, H.T. Gazda, M.W. Wlodarski, and V.G. Sankaran. 2019. Impaired human hematopoiesis due to a cryptic intronic GATA1 splicing mutation. J Exp Med. - PMC - PubMed
    1. Abreu-Blanco MT, Verboon JM, Parkhurst SM. Coordination of Rho family GTPase activities to orchestrate cytoskeleton responses during cell wound repair. Curr Biol. 2014;24:144–155. - PMC - PubMed
    1. Arranz L, Sanchez-Aguilera A, Martin-Perez D, Isern J, Langa X, Tzankov A, Lundberg P, Muntion S, Tzeng YS, Lai DM, Schwaller J, Skoda RC, Mendez-Ferrer S. Neuropathy of haematopoietic stem cell niche is essential for myeloproliferative neoplasms. Nature. 2014;512:78–81. - PubMed
    1. Banerjee U, Girard JR, Goins LM, Spratford CM. Drosophila as a genetic model for hematopoiesis. Genetics. 2019;211:367–417. - PMC - PubMed
    1. Baryawno N, Przybylski D, Kowalczyk MS, Kfoury Y, Severe N, Gustafsson K, Kokkaliaris KD, Mercier F, Tabaka M, Hofree M, Dionne D, Papazian A, Lee D, Ashenberg O, Subramanian A, Vaishnav ED, Rozenblatt-Rosen O, Regev A, Scadden DT. A cellular taxonomy of the bone marrow stroma in homeostasis and leukemia. Cell. 2019;177(1915–1932):e1916. - PMC - PubMed

Publication types

Substances

LinkOut - more resources