

Tumor-infiltrating CD39+CD8+ T cells determine poor prognosis and immune evasion in clear cell renal cell carcinoma patients
- PMID: 32306075
- PMCID: PMC11027701
- DOI: 10.1007/s00262-020-02563-2
Tumor-infiltrating CD39+CD8+ T cells determine poor prognosis and immune evasion in clear cell renal cell carcinoma patients
Abstract
Purpose: Tumor microenvironment is important in the progression of clear cell renal cell carcinoma (ccRCC), and its prognostic value is still unclear. Recent reports demonstrated tumor-infiltrating CD39+CD8+ T cells are abundant, but their function remains obscure. We aim to assess clinical value of CD39+CD8+ T cells and seek a potential therapeutic target in ccRCC.
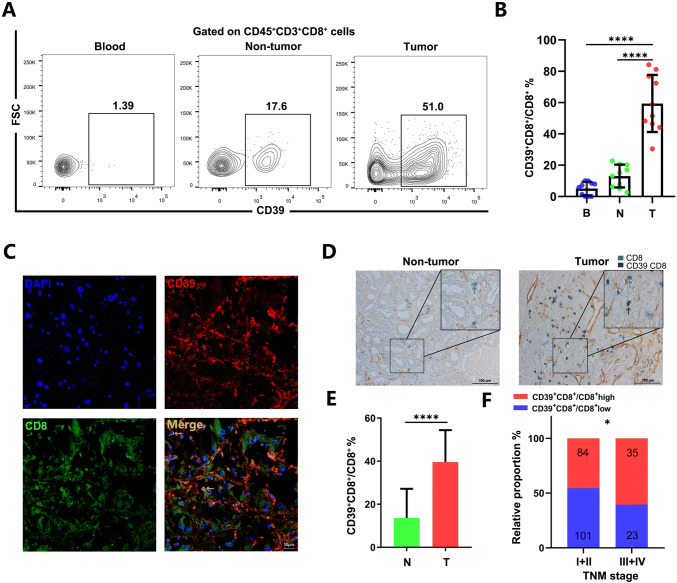
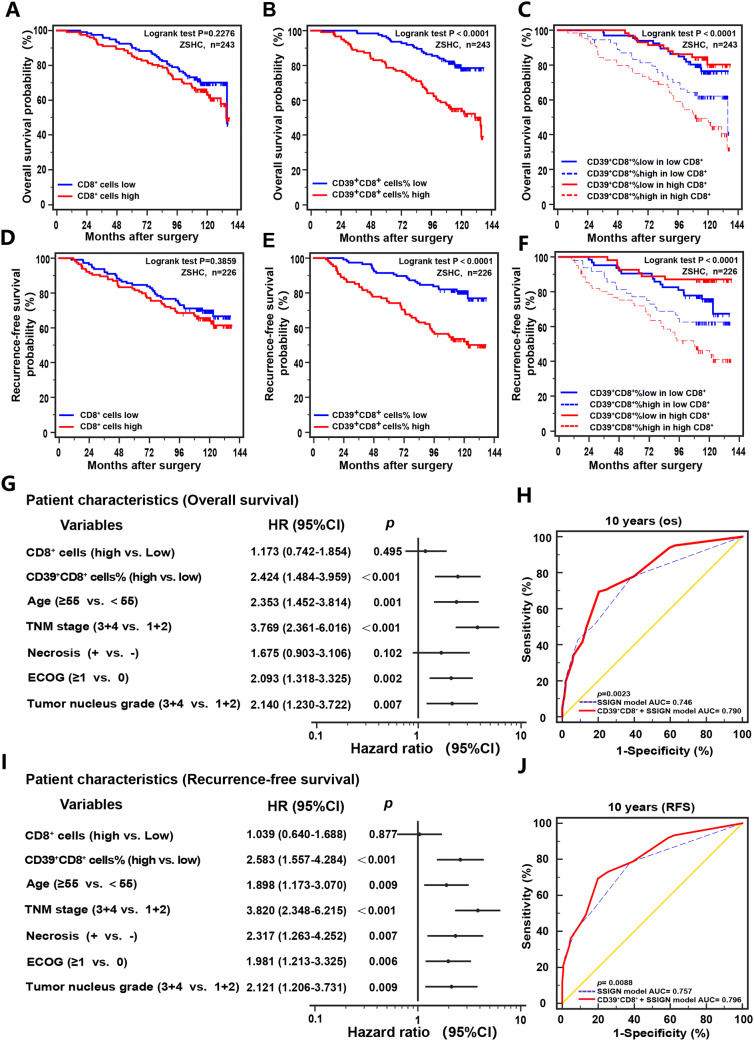
Experimental design: We immunohistochemically evaluated clinical value of CD39+CD8+ T cells in a retrospective Zhongshan Hospital cohort of 243 ccRCC patients. Fresh tumor samples (n = 48), non-tumor tissues and peripheral blood for flow cytometry analyses were collected to analyze immune cell functions from Zhongshan Hospital. The survival benefit of tyrosine kinase inhibitors (TKIs) in this subpopulation was evaluated. Kaplan-Meier analysis and COX regression model were applied for survival analyses. Bioinformatics analysis performed in TCGA KIRC cohort and the scRNA-seq cohort.
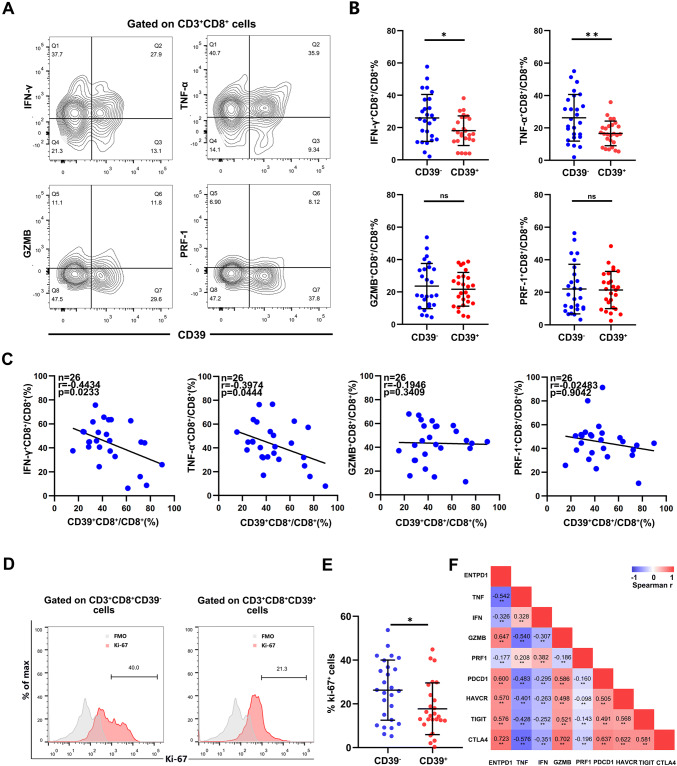
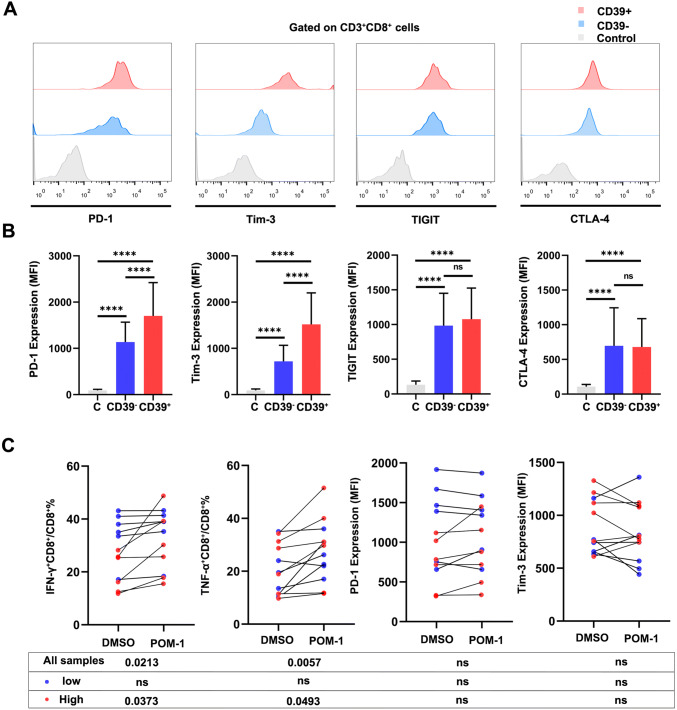
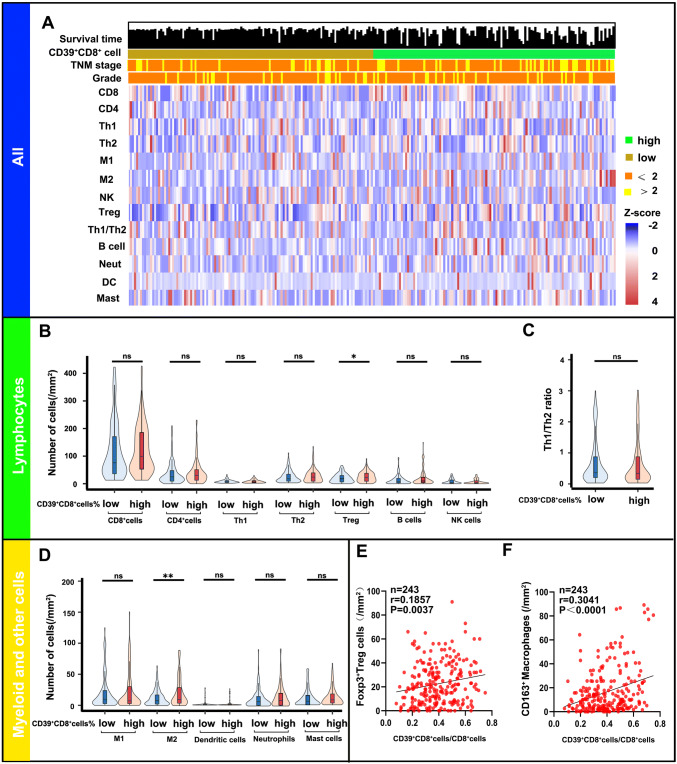
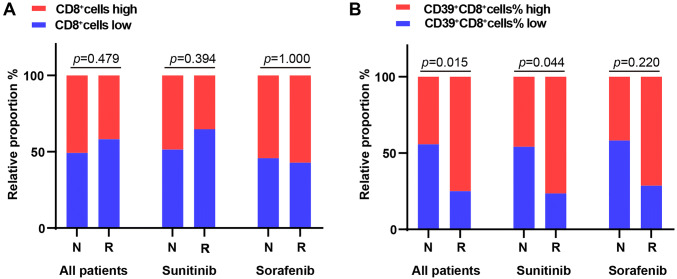
Results: We found that accumulation of CD39+CD8+ T cells indicated poor prognosis (p < 0.0001) and indicated therapeutic benefit of TKIs therapy (p = 0.015). CD39+CD8+ T cells showed decreased TNF-α and IFN-γ with elevated PD-1 and TIM-3 expression. Further analysis of tumor-infiltrating immune cell landscape in the ccRCC revealed the positive correlation between CD39+CD8+ T cells and Tregs (p = 0.037) and M2-polarized macrophages (p < 0.0001). Finally, inhibition of CD39 partially restores the anti-tumor function of CD8+ T cells.
Conclusions: High CD39+CD8+ T cells indicated poor prognosis in ccRCC, due to impaired anti-tumor function of CD39+CD8+ T cells and indicated therapeutic benefit of TKIs therapy.
Keywords: CD39; CD8+ T cell; Clear cell renal cell carcinoma; Prognosis; Tyrosine kinase inhibitors.
Conflict of interest statement
The authors declare no conflict of interest.
Figures
Similar articles
-
Intratumoral CXCL13+CD8+T cell infiltration determines poor clinical outcomes and immunoevasive contexture in patients with clear cell renal cell carcinoma.J Immunother Cancer. 2021 Feb;9(2):e001823. doi: 10.1136/jitc-2020-001823. J Immunother Cancer. 2021. PMID: 33589528 Free PMC article.
-
Tumor infiltrating mast cells determine oncogenic HIF-2α-conferred immune evasion in clear cell renal cell carcinoma.Cancer Immunol Immunother. 2019 May;68(5):731-741. doi: 10.1007/s00262-019-02314-y. Epub 2019 Feb 13. Cancer Immunol Immunother. 2019. PMID: 30758643 Free PMC article.
-
Tumor-infiltrating CD103+CD8+hnRNPA2B1+ tissue-resident T cells indicate poor prognosis in patients with clear cell renal cell carcinoma.J Leukoc Biol. 2025 Aug 5;117(8):qiaf084. doi: 10.1093/jleuko/qiaf084. J Leukoc Biol. 2025. PMID: 40853196
-
Roles of the Dynamic Tumor Immune Microenvironment in the Individualized Treatment of Advanced Clear Cell Renal Cell Carcinoma.Front Immunol. 2021 Mar 4;12:653358. doi: 10.3389/fimmu.2021.653358. eCollection 2021. Front Immunol. 2021. PMID: 33746989 Free PMC article. Review.
-
Phenotypic and spatial heterogeneity of CD8+ tumour infiltrating lymphocytes.Mol Cancer. 2024 Sep 9;23(1):193. doi: 10.1186/s12943-024-02104-w. Mol Cancer. 2024. PMID: 39251981 Free PMC article. Review.
Cited by
-
Cellular milieu in clear cell renal cell carcinoma.Front Oncol. 2022 Oct 14;12:943583. doi: 10.3389/fonc.2022.943583. eCollection 2022. Front Oncol. 2022. PMID: 36313721 Free PMC article. Review.
-
The Immune-Related Gene HCST as a Novel Biomarker for the Diagnosis and Prognosis of Clear Cell Renal Cell Carcinoma.Front Oncol. 2021 Apr 23;11:630706. doi: 10.3389/fonc.2021.630706. eCollection 2021. Front Oncol. 2021. PMID: 33968730 Free PMC article.
-
ATP and cancer immunosurveillance.EMBO J. 2021 Jul 1;40(13):e108130. doi: 10.15252/embj.2021108130. Epub 2021 Jun 14. EMBO J. 2021. PMID: 34121201 Free PMC article. Review.
-
Assessment of AURKA expression and prognosis prediction in lung adenocarcinoma using machine learning-based pathomics signature.Heliyon. 2024 Jun 14;10(12):e33107. doi: 10.1016/j.heliyon.2024.e33107. eCollection 2024 Jun 30. Heliyon. 2024. PMID: 39022022 Free PMC article.
-
CD39 Regulation and Functions in T Cells.Int J Mol Sci. 2021 Jul 28;22(15):8068. doi: 10.3390/ijms22158068. Int J Mol Sci. 2021. PMID: 34360833 Free PMC article. Review.
References
-
- Bray F, Ferlay J, Soerjomataram I, et al. Global cancer statistics 2018: GLOBOCAN estimates of incidence and mortality worldwide for 36 cancers in 185 countries. CA Cancer J Clin. 2018;68(6):394–424. - PubMed
MeSH terms
Substances
Grants and funding
- 81671628/National Natural Science Foundation of China
- 81702496/National Natural Science Foundation of China
- 31770851,81871306,81872082,81902556,81902563/National Natural Science Foundation of China
- 81902898/National Natural Science Foundation of China
- 81974393/National Natural Science Foundation of China
- 81702497/National Natural Science Foundation of China
- 81702805/National Natural Science Foundation of China
- 81772696/National Natural Science Foundation of China
- 20174Y0042/Shanghai Municipal Population and Family Planning Commission
- 2017YFC0114303/National Key R&D Program of China
- 16ZR1406500,17ZR1405100/Shanghai Municipal Natural Science Foundation
- 19ZR1431800/Shanghai Municipal Natural Science Foundation
- 17411963100/Guide Project of Science and Technology Commission of Shanghai Municipality
LinkOut - more resources
Full Text Sources
Other Literature Sources
Medical
Research Materials
