

Covid-19 epidemic in Italy: evolution, projections and impact of government measures
- PMID: 32306149
- PMCID: PMC7165256
- DOI: 10.1007/s10654-020-00631-6
Covid-19 epidemic in Italy: evolution, projections and impact of government measures
Abstract
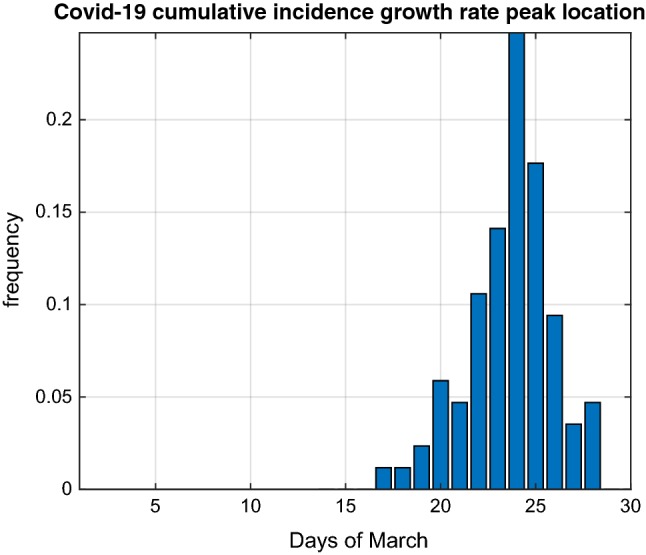
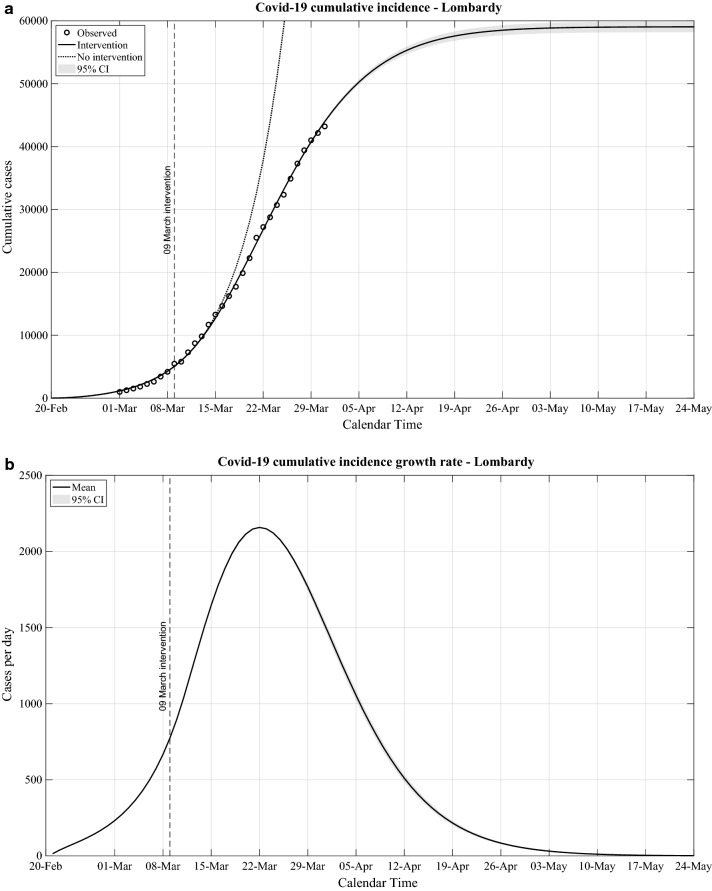
We report on the Covid-19 epidemic in Italy in relation to the extraordinary measures implemented by the Italian Government between the 24th of February and the 12th of March. We analysed the Covid-19 cumulative incidence (CI) using data from the 1st to the 31st of March. We estimated that in Lombardy, the worst hit region in Italy, the observed Covid-19 CI diverged towards values lower than the ones expected in the absence of government measures approximately 7-10 days after the measures implementation. The Covid-19 CI growth rate peaked in Lombardy the 22nd of March and in other regions between the 24th and the 27th of March. The CI growth rate peaked in 87 out of 107 Italian provinces on average 13.6 days after the measures implementation. We projected that the CI growth rate in Lombardy should substantially slow by mid-May 2020. Other regions should follow a similar pattern. Our projections assume that the government measures will remain in place during this period. The evolution of the epidemic in different Italian regions suggests that the earlier the measures were taken in relation to the stage of the epidemic, the lower the total cumulative incidence achieved during this epidemic wave. Our analyses suggest that the government measures slowed and eventually reduced the Covid-19 CI growth where the epidemic had already reached high levels by mid-March (Lombardy, Emilia-Romagna and Veneto) and prevented the rise of the epidemic in regions of central and southern Italy where the epidemic was at an earlier stage in mid-March to reach the high levels already present in northern regions. As several governments indicate that their aim is to "push down" the epidemic curve, the evolution of the epidemic in Italy supports the WHO recommendation that strict containment measures should be introduced as early as possible in the epidemic curve.
Keywords: COVID-19; Cumulative incidence; Epidemic; Growth rate; Italy; Projections.
Figures

Comment in
-
COVID-19 and the need of targeted inverse quarantine.Eur J Epidemiol. 2020 Apr;35(4):339-340. doi: 10.1007/s10654-020-00629-0. Epub 2020 Apr 24. Eur J Epidemiol. 2020. PMID: 32328991 Free PMC article. No abstract available.
References
-
- Bailey NTJ. The mathematical theory of infectious diseases and its applications. 2. New York: Hafner Press; 1975.
-
- Gilks WR, Richardson S, Spiegelhalter D. Markov Chain Monte Carlo in practice. Boca Raton: CRC; 1995.
MeSH terms
LinkOut - more resources
Full Text Sources
Research Materials
