

Fragility fractures in Europe: burden, management and opportunities
- PMID: 32306163
- PMCID: PMC7166207
- DOI: 10.1007/s11657-020-0706-y
Fragility fractures in Europe: burden, management and opportunities
Abstract
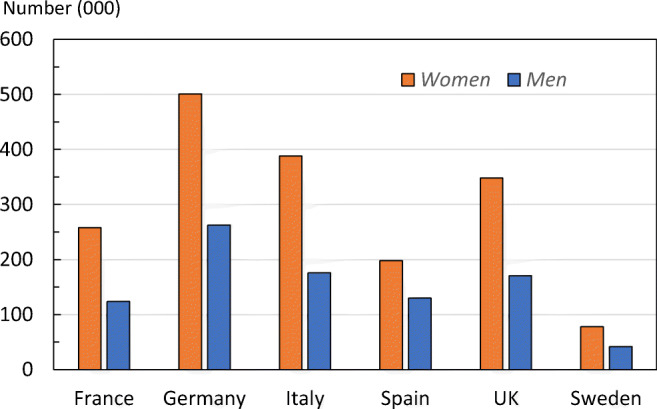
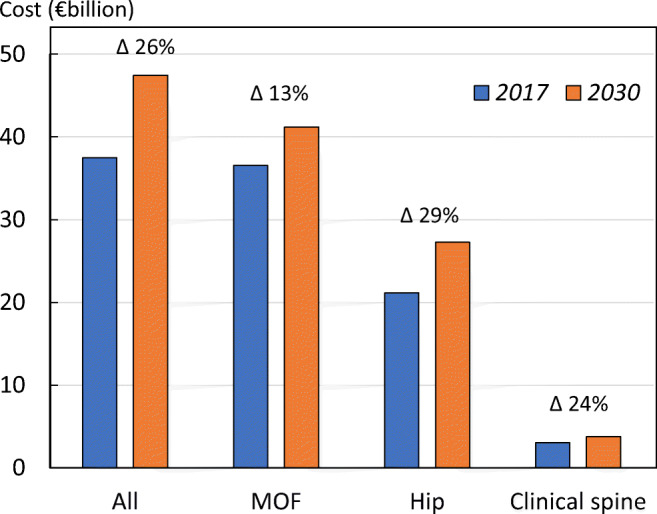
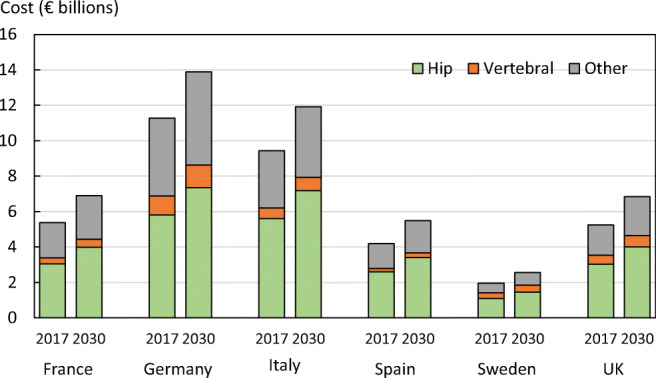
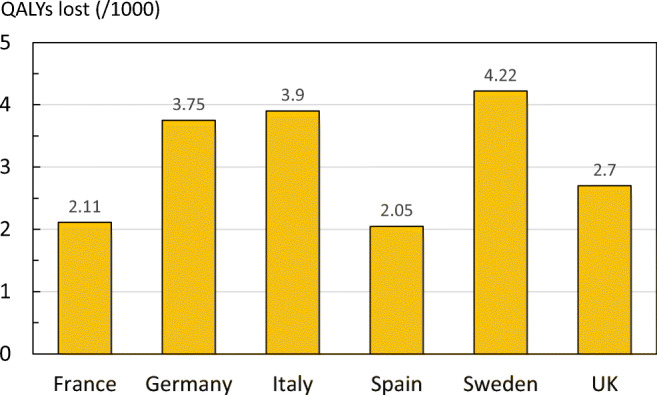
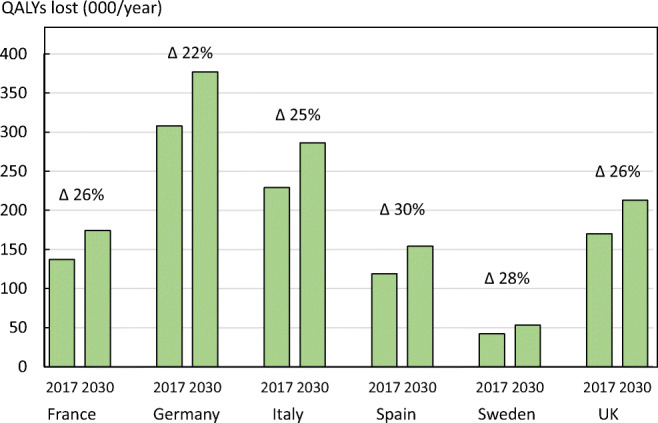
This report provides an overview and a comparison of the burden and management of fragility fractures in the largest five countries of the European Union plus Sweden (EU6). In 2017, new fragility fractures in the EU6 are estimated at 2.7 million with an associated annual cost of €37.5 billion and a loss of 1.0 million quality-adjusted life years.
Introduction: Osteoporosis is characterized by reduced bone mass and strength, which increases the risk of fragility fractures, which in turn, represent the main consequence of the disease. This report provides an overview and a comparison of the burden and management of fragility fractures in the largest five EU countries and Sweden (designated the EU6).
Methods: A series of metrics describing the burden and management of fragility fractures were defined by a scientific steering committee. A working group performed the data collection and analysis. Data were collected from current literature, available retrospective data and public sources. Different methods were applied (e.g. standard statistics and health economic modelling), where appropriate, to perform the analysis for each metric.
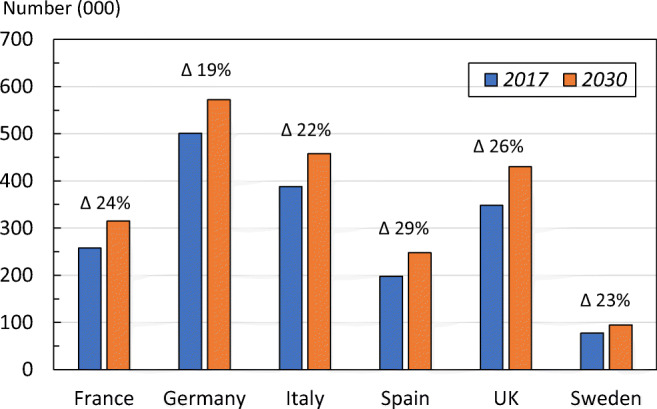
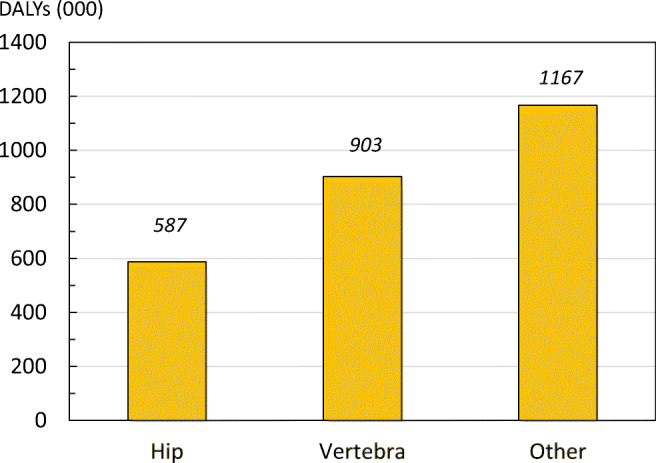
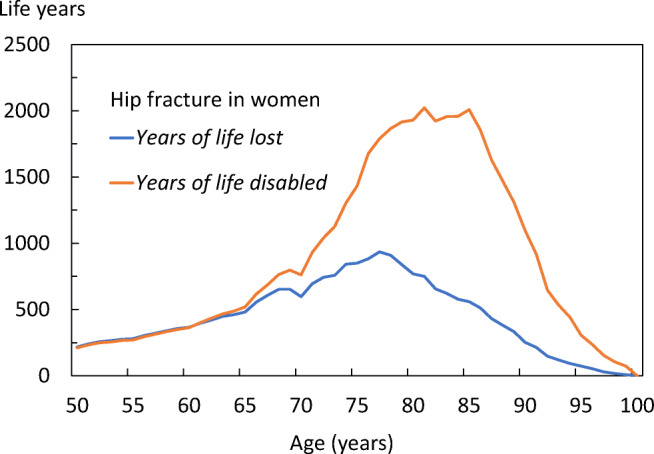
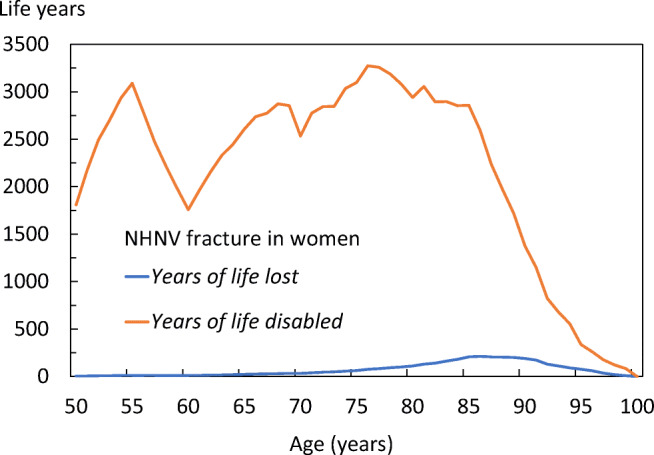
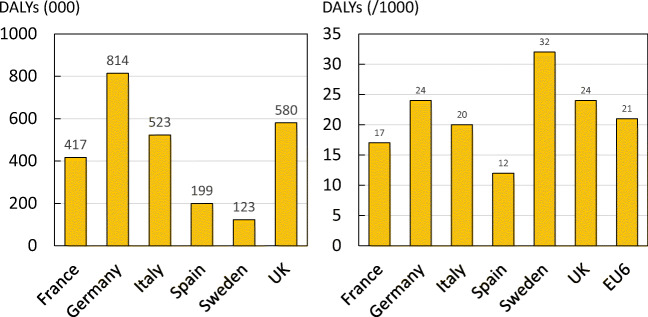
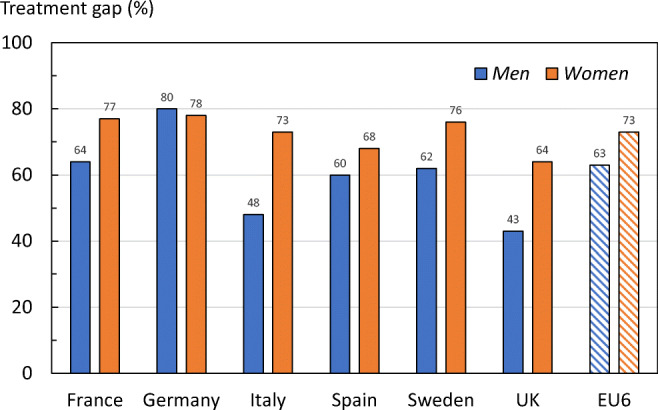
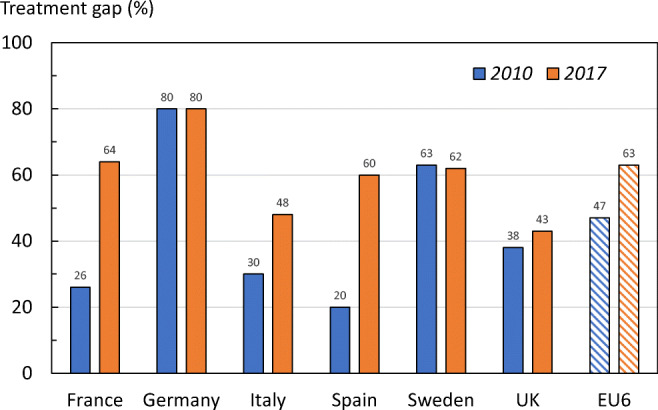
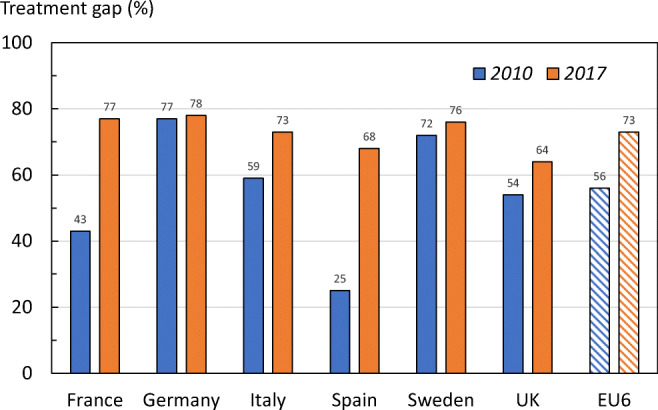
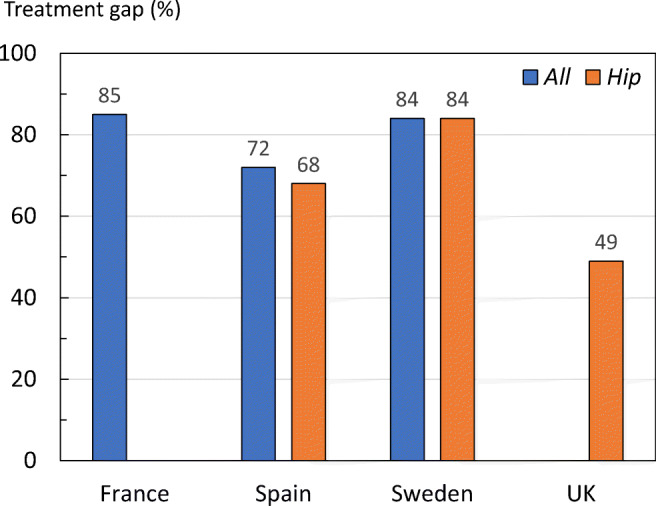
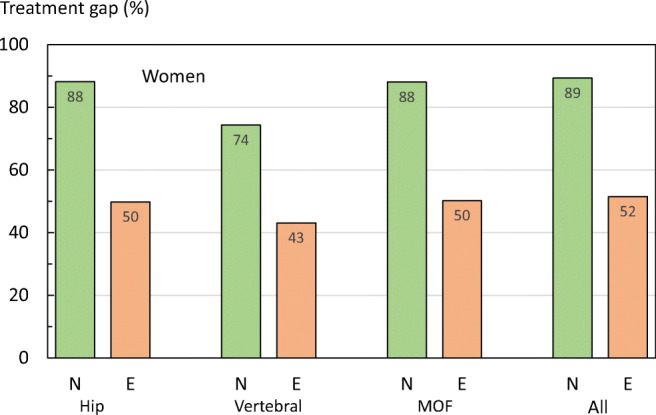
Results: Total fragility fractures in the EU6 are estimated to increase from 2.7 million in 2017 to 3.3 million in 2030; a 23% increase. The resulting annual fracture-related costs (€37.5 billion in 2017) are expected to increase by 27%. An estimated 1.0 million quality-adjusted life years (QALYs) were lost in 2017 due to fragility fractures. The current disability-adjusted life years (DALYs) per 1000 individuals age 50 years or more were estimated at 21 years, which is higher than the estimates for stroke or chronic obstructive pulmonary disease. The treatment gap (percentage of eligible individuals not receiving treatment with osteoporosis drugs) in the EU6 is estimated to be 73% for women and 63% for men; an increase of 17% since 2010. If all patients who fracture in the EU6 were enrolled into fracture liaison services, at least 19,000 fractures every year might be avoided.
Conclusions: Fracture-related burden is expected to increase over the coming decades. Given the substantial treatment gap and proven cost-effectiveness of fracture prevention schemes such as fracture liaison services, urgent action is needed to ensure that all individuals at high risk of fragility fracture are appropriately assessed and treated.
Keywords: Disability-adjusted life years; Fracture costs; Fragility fracture; Quality-adjusted life years; Treatment gap.
Conflict of interest statement
F Borgström is employed and is a shareholder in Quantify Research. A health economic research consultancy that received a grant from IOF to conduct the analysis.
L Karlsson, G Ortsäter and N Norton are employed by Quantify Research. A health economic research consultancy that received a grant from IOF to conduct the analysis.
P Halbout has no competing interests to declare.
C Cooper reports personal fees from Alliance for Better Bone Health, Amgen, Eli Lilly, GSK, Medtronic, Merck, Novartis, Pfizer, Roche, Servier, Takeda and UCB.
EV McCloskey has received consultancy/lecture fees/grant funding/honoraria from ActiveSignal, AgNovos, Amgen, AstraZeneca, Consilient Healthcare, Gilead, GSK, Hologic, Internis, Lilly, Medtronic, Merck, Novartis, Pfizer, Radius Health, Redx Oncology, Roche, SanofiAventis, Servier, Synexus, Tethys, UCB, Viiv, Warner Chilcott, I3 Innovus and Unilever.
NC Harvey has received consultancy/lecture fees/honoraria/grant funding from Alliance for Better Bone Health, Amgen, MSD, Eli Lilly, Servier, Shire, UCB, Consilient Healthcare, Radius Health, Kyowa Kirin and Internis Pharma.
MK Javaid has received honoraria, unrestricted research grants, travel and/or subsistence expenses from Amgen, Lilly UK, Internis, Consilient Health, Zebra Medical Vision, Kyowa Kirin Hakin, UCB.
JA Kanis reports grants from Amgen, Eli Lilly and Radius Health; consulting fees from Theramex. JAK is the architect of FRAX® but has no financial interest.
M Lorentzon has received lecture fees from Amgen, Lilly, Meda, Renapharma, UCB Pharma, and consulting fees from Amgen, Radius Health, UCB Pharma, Renapharma and Consilient Health, all outside the presented work.
Figures


References
-
- International Osteoporosis Foundation (2018) Broken bones, broken lives: a roadmap to solve the fragility fracture crisis in Europe. International Osteoporosis Foundation, Nyon, Switzerland. https://www.iofbonehealth.org/broken-bones-broken-lives Accessed 09/12/2019
-
- International Osteoporosis Foundation (2018) Os brisés, vies brisées: une feuille de route pour résoudre la crise des fractures de fragilité en France. International Osteoporosis Foundation, Nyon, Switzerland. https://www.iofbonehealth.org/broken-bones-broken-lives Accessed 09/12/2019
-
- International Osteoporosis Foundation (2018) Ruinierte knochen, ruiniertes leben: Ein strategischer Plan zur Lösung der Fragilitätsfrakturkrise in Deutschland. International Osteoporosis Foundation, Nyon, Switzerland. https://www.iofbonehealth.org/broken-bones-broken-lives Accessed 09/12/2019
-
- International Osteoporosis Foundation (2018) Ossa spezzate, vite spezzate: un piano d’azione per superare l’emergenza delle fratture da fragilità in Italia. International Osteoporosis Foundation, Nyon, Switzerland. https://www.iofbonehealth.org/broken-bones-broken-lives Accessed 09/12/2019
-
- International Osteoporosis Foundation (2018) Huesos rotos, vidas rotas: guía para mejorar la atención a las fracturas por fragilidad en España. International Osteoporosis Foundation, Nyon, Switzerland. https://www.iofbonehealth.org/broken-bones-broken-lives Accessed 09/12/2019
Publication types
MeSH terms
Grants and funding
LinkOut - more resources
Full Text Sources
Medical
Miscellaneous
