. 2020 Apr 19;21(1):312.
doi: 10.1186/s12864-020-6721-y.

On the utility of RNA sample pooling to optimize cost and statistical power in RNA sequencing experiments

Affiliations

On the utility of RNA sample pooling to optimize cost and statistical power in RNA sequencing experiments

Alemu Takele Assefa et al. BMC Genomics. .

Erratum in

Abstract

Background: In gene expression studies, RNA sample pooling is sometimes considered because of budget constraints or lack of sufficient input material. Using microarray technology, RNA sample pooling strategies have been reported to optimize both the cost of data generation as well as the statistical power for differential gene expression (DGE) analysis. For RNA sequencing, with its different quantitative output in terms of counts and tunable dynamic range, the adequacy and empirical validation of RNA sample pooling strategies have not yet been evaluated. In this study, we comprehensively assessed the utility of pooling strategies in RNA-seq experiments using empirical and simulated RNA-seq datasets.

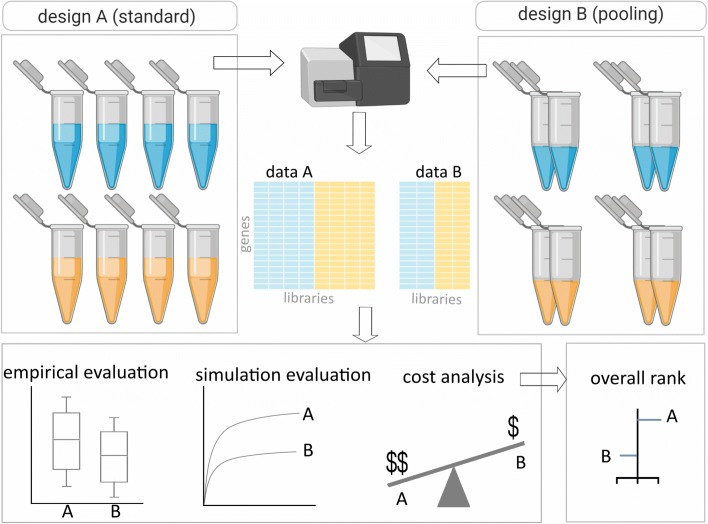
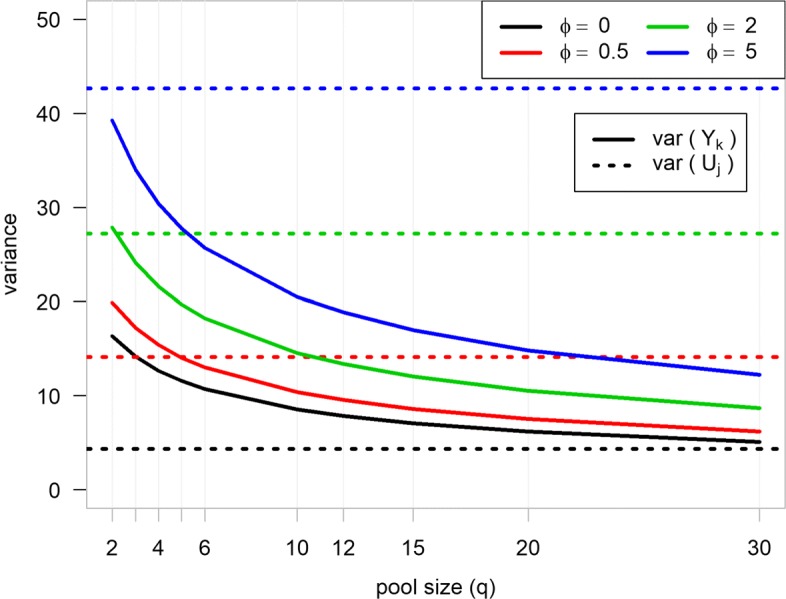
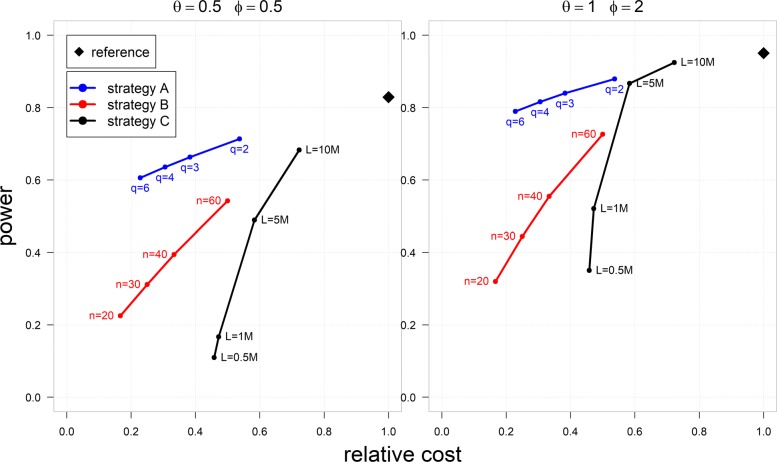
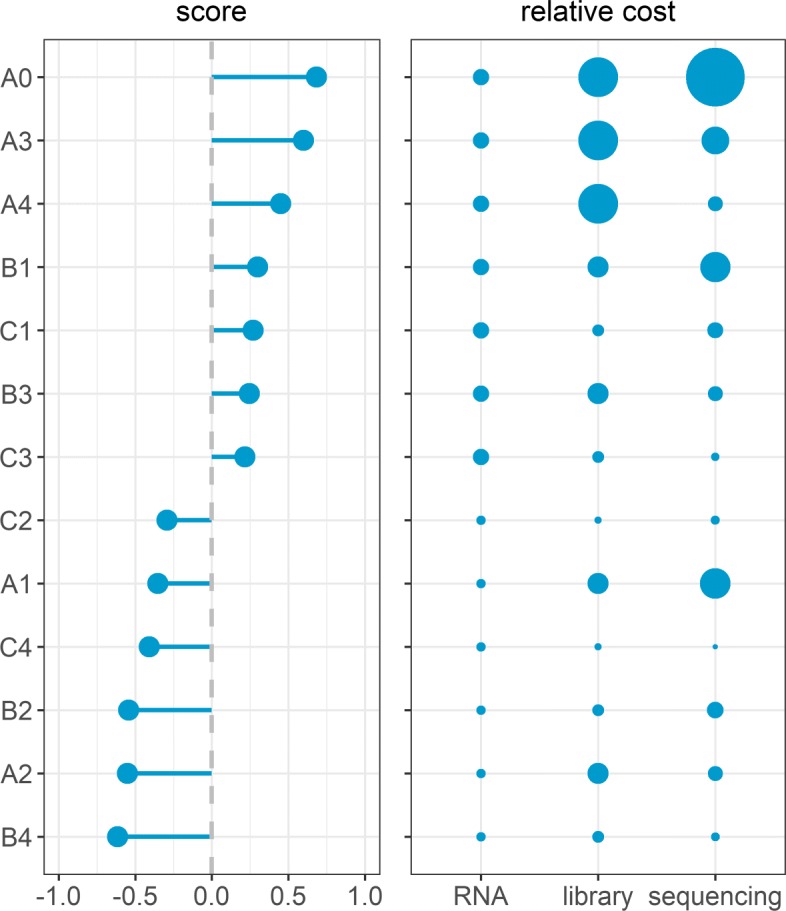
Result: The data generating model in pooled experiments is defined mathematically to evaluate the mean and variability of gene expression estimates. The model is further used to examine the trade-off between the statistical power of testing for DGE and the data generating costs. Empirical assessment of pooling strategies is done through analysis of RNA-seq datasets under various pooling and non-pooling experimental settings. Simulation study is also used to rank experimental scenarios with respect to the rate of false and true discoveries in DGE analysis. The results demonstrate that pooling strategies in RNA-seq studies can be both cost-effective and powerful when the number of pools, pool size and sequencing depth are optimally defined.

Conclusion: For high within-group gene expression variability, small RNA sample pools are effective to reduce the variability and compensate for the loss of the number of replicates. Unlike the typical cost-saving strategies, such as reducing sequencing depth or number of RNA samples (replicates), an adequate pooling strategy is effective in maintaining the power of testing DGE for genes with low to medium abundance levels, along with a substantial reduction of the total cost of the experiment. In general, pooling RNA samples or pooling RNA samples in conjunction with moderate reduction of the sequencing depth can be good options to optimize the cost and maintain the power.

Keywords: Cost; Differential gene expression; Experimental design; RNA sample pooling; RNA sequencing; Statistical power.


Conflict of interest statement

The authors declare that they have no competing interests.

Figures

Fig. 1
Fig. 1
Summary of the workflow. Assessment of RNA sample pooling in RNA-seq experiment involves comparison of standard (design A) and pooled (design B) experimental designs using empirical data, simulated data and total cost assessment. The experimental scenarios are ranked using an overall performance score that summarizes all the comparison metrics
Fig. 2
Fig. 2
Variance at different pool sizes. The variance of the gene expression levels from pooled and non-pooled experiments. In particular, the virtual counts Uj were generated from a negative binomial distribution with mean μj and over-dispersion parameter ϕ. μj=ρLj0, where ρ is the relative abundance (ρ=10−6), and Lj0 is the virtual library size in biological sample j, and Lj0 are uniformly sampled between 15−25×106. Yk is the outcome from a pooled design with a pool of size q according to the model in (1)
Fig. 3
Fig. 3
Zodiac plot representing the trade-off between power and cost. The zodiac plot shows the statistical power (at 5% significance level) to call a single gene DE versus the relative total cost of data generation for three different cost-saving strategies compared to a reference design. The power is calculated for a gene with relative abundance ρ=10−7 in one group, LFC (‘effect size’) θ∈{0.5,1}, and over-dispersion (‘variability’) ϕ∈{0.5,2}. The reference design consists of 120 samples (n1=n2=60) with average library size of 20M per sample and no pooling. Strategy A is pooling with pool size q∈{2,3,4,6} and average library size of 20M per pool. Strategy B is similar to the reference, except the number of samples is reduced to n∈{60,40,30,20}. Strategy C is similar to the reference, except the sequencing depth is reduced to L∈{10M,5M,1M,0.5M}. The relative cost is calculated as the total cost of a particular strategy divided by that of the reference design
Fig. 4
Fig. 4
Empirical results. a–distributions of the average normalized counts per genes (in log2 scale), b–distributions of the variability of normalized counts per gene (in log2 scale), and c–The LFC bias in terms of the mean absolute difference with the LFC estimate from the reference scenario (A0)
Fig. 5
Fig. 5
Simulation results. Results of the simulation based evaluation: The curves show the trade-off between the true positive rate (TPR) and the actual FDR evaluated at 0-40% nominal FDR level. The solid circles on each curve indicate the TPR and actual FDR at 5% nominal FDR (indicated by the vertical dashed line). The DE genes in the simulated dataset have |LFC|≥0.5a or |LFC|≥1b
Fig. 6
Fig. 6
Ranking of experimental scenarios based on the overall performance and cost. Performance ranking of RNA seq experiment design scenarios. Ranks are determined using a score that summarizes the overall performance of scenarios using empirical and simulated RNA seq data. In particular, five metrics were summarized: the inverse of the LFC estimate bias, standardized LFC for MYCN geneset (absolute value), concordance with reference scenario, one minus the actual FDR (at 5% nominal FDR level), and sensitivity (at 5% nominal FDR level). These metrics are standardized across scenarios, and then scenarios are ranked based on the average standard score across the metrics. The solid circles indicate the relative data generation cost of RNA sample preparation, library preparation and sequencing (relative to the corresponding cost from the reference scenario)

References

    1. Wang Z, Gerstein M, Snyder M. RNA-seq: a revolutionary tool for transcriptomics. Nat Rev Genet. 2009;10(1):57–63. doi: 10.1038/nrg2484. - DOI - PMC - PubMed
    1. Auer PL, Doerge R. Statistical design and analysis of rna sequencing data. Genetics. 2010;185(2):405–16. doi: 10.1534/genetics.110.114983. - DOI - PMC - PubMed
    1. Fang Z, Cui X. Design and validation issues in rna-seq experiments. Brief Bioinform. 2011;12(3):280–7. doi: 10.1093/bib/bbr004. - DOI - PubMed
    1. McCarthy DJ, Chen Y, Smyth GK. Differential expression analysis of multifactor RNA-seq experiments with respect to biological variation. Nucleic Acids Res. 2012;40(10):4288–97. doi: 10.1093/nar/gks042. - DOI - PMC - PubMed
    1. Law CW, Chen Y, Shi W, Smyth GK. voom: Precision weights unlock linear model analysis tools for RNA-seq read counts. Genome Biol. 2014;15(2):29. doi: 10.1186/gb-2014-15-2-r29. - DOI - PMC - PubMed

Publication types