. 2020 Nov 19;71(16):2052-2060.
doi: 10.1093/cid/ciaa462.

Downregulated Gene Expression Spectrum and Immune Responses Changed During the Disease Progression in Patients With COVID-19

Affiliations

Downregulated Gene Expression Spectrum and Immune Responses Changed During the Disease Progression in Patients With COVID-19

Yabo Ouyang et al. Clin Infect Dis. .

Abstract

Background: The World Health Organization characterizes novel coronavirus disease 2019 (COVID-19), which is caused by severe acute respiratory syndrome coronavirus 2 (SARS-CoV-2), as a pandemic. Here, we investigated the clinical, cytokine levels; T-cell proportion; and related gene expression occurring in patients with COVID-19 on admission and after initial treatment.

Methods: Eleven patients diagnosed with COVID-19 with similar initial treatment regimens were enrolled in the hospital. Plasma cytokine, peripheral T cell proportions, and microfluidic quantitative polymerase chain reaction analyses for gene expression were conducted.

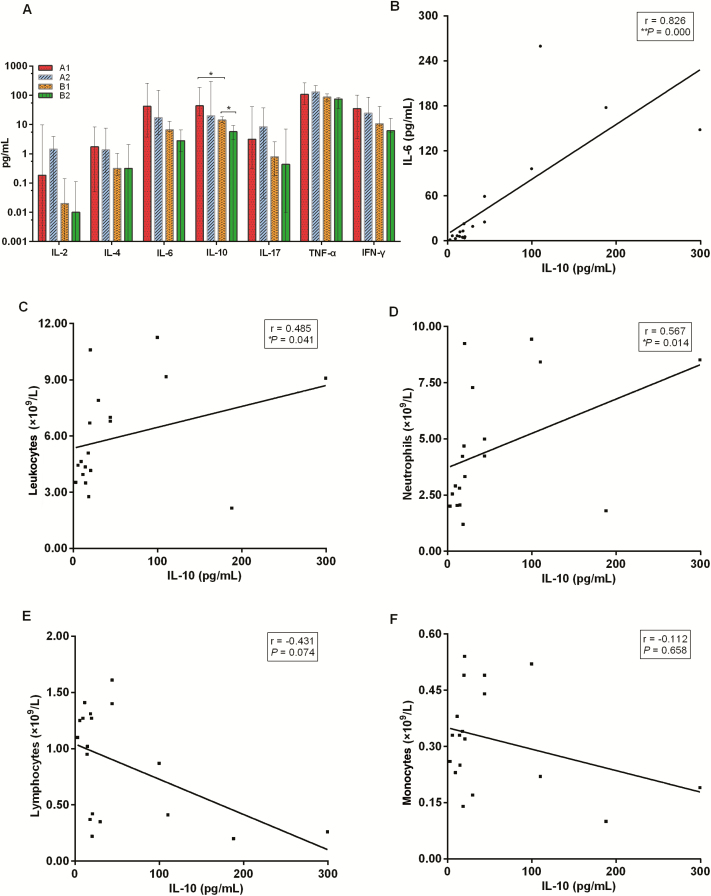
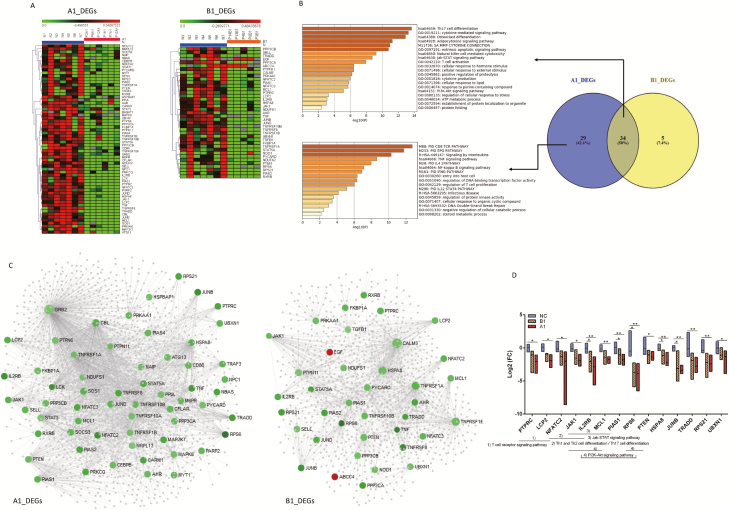
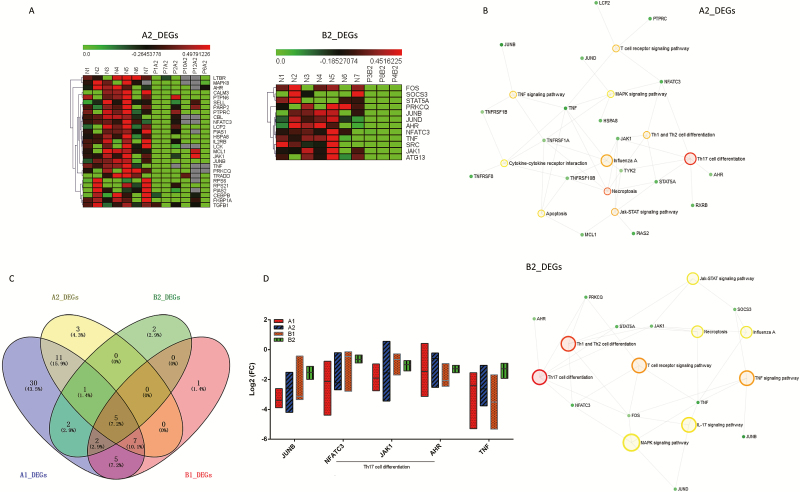
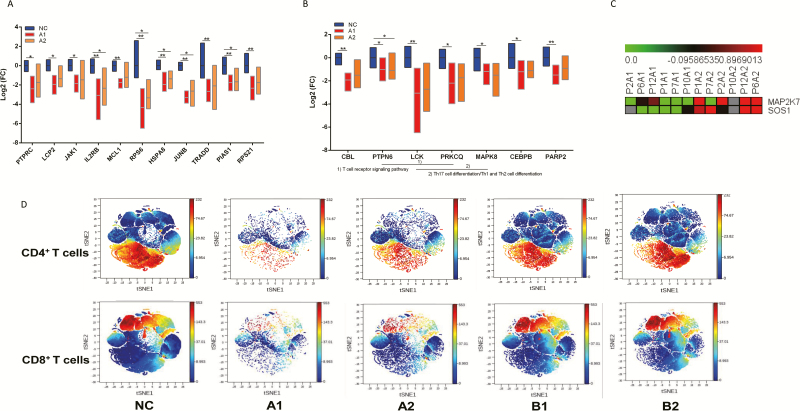
Results: Five patients with mild and 6 with severe disease were included. Cough and fever were the primary symptoms in the 11 COVID-19 cases. Older age, higher neutrophil count, and higher C-reactive protein levels were found in severe cases. IL-10 level significantly varied with disease progression and treatment. Decreased T-cell proportions were observed in patients with COVID-19, especially in severe cases, and all were returned to normal in patients with mild disease after initial treatment, but only CD4+ T cells returned to normal in severe cases. The number of differentially expressed genes (DEGs) increased with the disease progression, and decreased after initial treatment. All downregulated DEGs in severe cases mainly involved Th17-cell differentiation, cytokine-mediated signaling pathways, and T-cell activation. After initial treatment in severe cases, MAP2K7 and SOS1 were upregulated relative to that on admission.

Conclusions: Our findings show that a decreased T-cell proportion with downregulated gene expression related to T-cell activation and differentiation occurred in patients with severe COVID-19, which may help to provide effective treatment strategies for COVID-19.

Keywords: COVID-2019; PBMC; cytokine; gene expression; immune response.


Figures

Figure 1.
Figure 1.
A, Plasma cytokine levels of patients with COVID-19 on admission and after initial treatment. Each bar and error bar represents median value and range. B–F, correlation between IL-10 level of all COVID-19 cases and IL-6 levels (B), the corresponding leukocyte counts (C), neutrophil counts (D), lymphocyte counts (E), and monocyte counts (F). P values (2-sided) and r values are based on Spearman rank test. *P < .05; **P < .01. Abbreviations: COVID-19, coronavirus disease 2019; IFN-γ, interferon-γ; IL, interleukin; TNF-α, tumor necrosis factor α.
Figure 2.
Figure 2.
A, DEGs in patients with COVID-19 on admission. The DEG expression profiles of mRNAs are shown by a heatmap, and the colors represent the FC values. B, Venn diagram for DEGs of A1 and B1 groups and their corresponding enrichment analysis using metascape. All statistically enriched terms were identified, and cumulative hypergeometric P values and enrichment factors were calculated. C, PPI network of DEGs of A1 and B1 groups. The PPI network was drawn using NetworkAnalyst platform based on tissue-specific PPI data from the DifferentialNet database. The red circles represent the upregulated genes, the green circles downregulated genes, and gray circles (relatively small circles) indicate not included in DEGs. D, Kruskal-Wallis 1-way ANOVA was used to screen the 14 significantly different genes among the Normal, A1, and B1 groups. Then the multiple comparisons with all pairwise were performed. Statistical significance was set at a 2-sided P < .05 and adjusted P < .05. *P < .05, **P < .01. Abbreviations: ANOVA, analysis of variance; COVID-19, coronavirus disease 2019; DEG, differentially expressed gene; FC, fold-change; PPI, protein–protein interaction; Th, T-helper.
Figure 3.
Figure 3.
A, DEGs in patients with COVID-19 after initial treatment. The DEG expression profiles of mRNAs are shown by a heatmap, and the colors represent the FC values. B, All DEGs from groups A2 and B2 were conducted by using KEGG enrichment analysis, respectively. Large hollow circles indicate the pathway name and small solid circles represent the gene. C, Venn diagram for DEGs of the A1, B1, A2, and B2 groups, and 5 DEGs were common to the 4 groups. D, FC of JUNB, NFATC3, JAK1, AHR, and TNF relative to the NC group, respectively, were compared within the 4 groups using Kruskal-Wallis test (all P > .05). Statistical significance was set at a 2-sided P value < .05. Abbreviations: COVID-19, coronavirus disease 2019; DEG, differentially expressed gene; FC, fold-change; Th, T-helper.
Figure 4.
Figure 4.
A, FCs of 11 of 14 genes from Figure 2D that were compared between the A1 and A2 groups using Kruskal-Wallis test (all P < .05). Statistical significance was set at a 2-sided P value < .05. B, The FCs of group A–specific DEGs including CBL, PTPN6, LCK, PRKCQ, CEBPB, MAPK8, and PARP2 were compared among NC, A1, and A2 group using Kruskal-Wallis test (all P < .05). Statistical significance was set at a 2-sided P value < .05. C, The DEG expression profiles of mRNAs are shown by a heatmap, and the colors represent the FC values. DEGs of group A2 relative to A1 are shown by a heatmap, including MAP2K7 and SOS1, which were upregulated in group A2 after initial treatment. D, The Mass Cytometry (CyTOF)-based analysis discovered T-cell signatures in peripheral blood of patients with COVID-19. Expression patterns of T cells, CD4+ T cells, and CD8+ T cells in PhenoGraph analysis. Populations identified by the relative expression of CyTOF markers are indicated by differences in expression patterns in the NC, A1, A2, B1, and B2 groups. *P < .05, **P < .01. Abbreviations: COVID-19, coronavirus disease 2019; DEG, differentially expressed gene; FC, fold-change; Th, T-helper.

References

    1. World Health Organization. Coronavirus disease (Covid-2019) situation reports–47. 2020. Available at: https://www.who.int/emergencies/diseases/novel-coronavirus-2019/situatio...
    1. Guan WJ, Ni ZY, Hu Y, et al. Clinical c haracteristics of coronavirus disease 2019 in China. N Engl J Med 2020. doi:10.1056/NEJMoa2002032 - PMC - PubMed
    1. Huang C, Wang Y, Li X, et al. Clinical features of patients infected with 2019 novel coronavirus in Wuhan, China. Lancet 2020; 395:497–506. - PMC - PubMed
    1. Chen N, Zhou M, Dong X, et al. Epidemiological and clinical characteristics of 99 cases of 2019 novel coronavirus pneumonia in Wuhan, China: a descriptive study. Lancet 2020; 395:507–13. - PMC - PubMed
    1. Yang X, Yu Y, Xu J, et al. Clinical course and outcomes of critically ill patients with SARS-cov-2 pneumonia in Wuhan, China: a single-centered, retrospective, observational study. Lancet Respir Med 2020. doi:10.1016/S2213-2600(20)30079-5 - PMC - PubMed

Publication types