A common molecular mechanism underlies the role of Mps1 in chromosome biorientation and the spindle assembly checkpoint
- PMID: 32307893
- PMCID: PMC7271318
- DOI: 10.15252/embr.202050257
A common molecular mechanism underlies the role of Mps1 in chromosome biorientation and the spindle assembly checkpoint
Abstract
The Mps1 kinase corrects improper kinetochore-microtubule attachments, thereby ensuring chromosome biorientation. Yet, its critical phosphorylation targets in this process remain largely elusive. Mps1 also controls the spindle assembly checkpoint (SAC), which halts chromosome segregation until biorientation is attained. Its role in SAC activation is antagonised by the PP1 phosphatase and involves phosphorylation of the kinetochore scaffold Knl1/Spc105, which in turn recruits the Bub1 kinase to promote assembly of SAC effector complexes. A crucial question is whether error correction and SAC activation are part of a single or separable pathways. Here, we isolate and characterise a new yeast mutant, mps1-3, that is severely defective in chromosome biorientation and SAC signalling. Through an unbiased screen for extragenic suppressors, we found that mutations lowering PP1 levels at Spc105 or forced association of Bub1 with Spc105 reinstate both chromosome biorientation and SAC signalling in mps1-3 cells. Our data argue that a common mechanism based on Knl1/Spc105 phosphorylation is critical for Mps1 function in error correction and SAC signalling, thus supporting the idea that a single sensory apparatus simultaneously elicits both pathways.
Keywords: Mps1; Spc105; chromosome biorientation; error correction; spindle assembly checkpoint.
© 2020 The Authors.
Conflict of interest statement
The authors declare that they have no conflict of interest.
Figures

- A
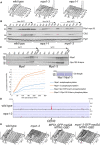
Serial dilutions of stationary phase cultures of the indicated strains were spotted on YEPD and incubated at the indicated temperatures.
- B
Mps1 sequence alignment around Saccharomyces cerevisiae Ser635. Sc: Saccharomyces cerevisiae; Sp: Schizosaccharomyces pombe; Mm: Mus musculus: Hs: Homo sapiens; Dm: Drosophila melanogaster.
- C, D
Wild‐type, mps1‐3 and mps1‐1 mutant cells were synchronised in G1 with α‐factor at permissive temperature (25°C) and then released at restrictive temperature (34°C, t = 0). Cells were collected at the indicated time points for FACS analysis of DNA contents (C) and for immunofluorescence using anti‐tubulin antibodies in order to score metaphase and anaphase spindles (D). Budding and nuclear division were scored on the FACS samples.
- E
Frequencies of chromosome loss were quantified at permissive temperature (25°C).
- F
Wild‐type and mps1 mutant cells bearing the TetO/TetR‐GFP system to mark the centromere of chromosome V 43 and expressing the SPBs marker Spc97‐mCherry were synchronised as in (C, D) and arrested in anaphase through the temperature‐sensitive cdc15‐2 allele. At 120 and 150 min, cells were fixed for scoring chromosome V segregation (n ≥ 172). Arrowheads indicate the sister chromatids of chromosome V. Error bars: SD. N = 3. Representative images of cells for each genotype are shown on the right. Scale bar: 5 μm.
- G
Wild‐type and mps1‐3 mutant cells carrying the TetO/TetR‐GFP markers for CEN5 labelling and expressing mCherry‐Tub1 were grown at 25°C and then shifted to 34°C for 1 h before filming. Cells were filmed at 34°C every 2 min by time‐lapse fluorescence microscopy. DIC: differential interference contrast. Scale bar: 5 μm.

- A
Wild‐type and mps1 mutant cells were synchronised in G1 with α‐factor at 25°C and then released at 34°C in the presence of nocodazole (t = 0). Cells were collected at the indicated time points for FACS analysis of DNA contents.
- B
Cells were treated as in (A), and after 2 h from the release, α‐factor was re‐added to prevent cells from undergoing a second cell cycle. Cell samples were collected at the indicated time points for Western blot analysis of the indicated proteins. Pgk1 was used as loading control. Cyc: cycling cells.
- C
Top: in vitro kinase assays with recombinant Mps1 and Mps1‐3 purified from Escherichia coli and incubated at 34°C for the indicated times in the presence of radioactive ATP and a recombinant Spc105 N‐terminal fragment (aa 1–320) as substrate. Bottom left: kinase activity was quantified on the autoradiographs by ImageJ and normalised to the levels of the full‐length protein on the Coomassie blue‐stained gel (right). Bottom right: 1 μg of the recombinant Mps1 kinases used for kinase assays was loaded on SDS–PAGE and stained with Coomassie blue for normalisation of kinase assays.
- D
Wild‐type and mps1‐3 cells were synchronised in G1 with α‐factor at 25°C and then released at 34°C in the presence of nocodazole. Cells were collected after 90 min and fixed with formaldehyde for ChIP‐seq analysis. ChIP sequence reads were normalised against sequence reads from corresponding input samples, and relative enrichment is plotted for chromosome III around the centromere (see the centromeric regions of all 16 yeast chromosomes in Appendix Fig S2). Y‐axis shows enrichment values (linear scale, range is 0–10). Values below 1.5 are shown in grey, and values above 1.5 (i.e. sequences enriched in ChIP samples) are red coloured.
- E
Cells with the indicated genotypes were synchronised in G1 with α‐factor at 25°C and then released in fresh medium at 34°C (t = 0). Cells were collected at the indicated time points for FACS analysis of DNA contents.

- A
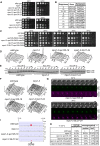
Serial dilutions of stationary phase cultures of the indicated strains were spotted on YEPD and incubated at 25°C and 34°C.
- B
List of extragenic suppressors found in the unbiased genetic screen.
- C
Serial dilutions of stationary phase cultures of the indicated strains were spotted on YEPD and incubated at the indicated temperatures.
- D
Cells with the indicated genotypes were synchronised in G1 with α‐factor at 25°C and then released in fresh medium at 34°C in presence of nocodazole (t = 0). Cells were collected at the indicated time points for FACS analysis of DNA contents.
- E
Cells were treated as in (D) and collected at the indicated time points for Western blot analysis of Mad1‐3HA. Cyc: cycling cells.
- F
Cells with the indicated genotypes were synchronised at 25°C and then released in fresh medium at 34°C (t = 0). Cells were collected at the indicated time points for FACS analysis of DNA contents.
- G, H
Cells with the indicated genotypes carrying the TetO/TetR‐GFP markers for CEN5 labelling and expressing mCherry‐Tub1 were grown at 25°C and then shifted to 34°C for 1 h before filming. Cells were filmed at 34°C every 2 or 4 min by time‐lapse fluorescence microscopy. Chromosome V segregation errors are reported in the table (H). Representative cells are shown as examples in the montages (G). Representative montages for wild‐type and mps1‐3 cells are shown in Fig 1F. DIC: differential interference contrast. Scale bar: 5 μm.
- I
Wild‐type, mps1‐3, mps1‐3 spc105‐18 and mps1‐3 GLC7‐24 cells were synchronised in G1 with α‐factor at 25°C and then released at 32°C in the presence of nocodazole (note that the presence of 3HA tags at the C‐terminus of Mps1‐3 slightly decreases the maximal temperature of suppression). Cells were collected after 90 min and fixed with formaldehyde for ChIP‐seq analysis. ChIP sequence reads were normalised against sequence reads from corresponding input samples, and relative enrichment is plotted for chromosome III around the centromere (see the centromeric regions of all 16 yeast chromosomes in Appendix Fig S5). Y‐axis shows enrichment values (linear scale, range is 0–10). Values below 1.5 are shown in grey, and values above 1.5 (i.e. sequences enriched in ChIP samples) are red coloured.

- A, B
Wild‐type and mps1‐3 cells were synchronised in G1 with α‐factor at 25°C and then released at 34°C in the presence (A) or absence (B) of nocodazole (t = 0). Cells were collected at the indicated time points for Western blot analysis of the indicated proteins. Equal amounts of protein extracts were loaded on two different gels, for Western blot of Spc105‐3PK and Clb2/Pgk1, respectively. Clb2 was used as mitotic marker and Pgk1 as loading control. Cyc: cycling cells.
- C, D
Cells with the indicated genotypes expressing Bub1‐GFP and the kinetochore marker Mtw1‐Tomato were grown in SD glu 2% and then shifted to 34°C for 1 h before filming; they were then filmed every 4 min by time‐lapse fluorescence microscopy at 34°C. Note that BUB1‐GFP is synthetic lethal with mps1‐3. Thus, we used mps1‐3 GALs‐MPS1 BUB1‐GFP cells that were grown in ‐His RG medium at 30°C; glucose was added to the culture for 30 min to shut off GALs‐MPS1, followed by shifting cells to SD medium at 34°C for 1 h before imaging in the same medium. Montages show representative cells (C). Arrowheads indicate Bub1‐GFP signals at kinetochores. DIC: differential interference contrast. Scale bar: 5 μm. GFP signals (Bub1) co‐localising with Tomato signals (kinetochores) were scored on the movies (D).
- E–H
Wild‐type and mps1‐3 cells were synchronised in G1 with α‐factor at 25°C and then released at 34°C in the presence (E, F) or absence (G, H) of nocodazole (t = 0). Cells were collected at the indicated time points for Western blot analysis of the indicated proteins (E, G) and for FACS analysis of DNA contents (F, H). Equal amounts of protein extracts were loaded on two different gels, for Western blot of Bub1‐3HA/Cdc5 and Clb2/Pgk1, respectively. A white asterisk indicates a hyperphosphorylated isoform of Bub1 that in wild‐type cells correlates with lack of chromosome biorientation. Cdc5 and Clb2 were used as mitotic markers and Pgk1 as loading control. Cyc: cycling cells.

- A
SPC105‐GBD cells expressing Bub1‐GFP were grown at 30°C and filmed every 4 min at 30°C by time‐lapse fluorescence microscopy. DIC: differential interference contrast. Scale bar: 5 μm.
- B
Serial dilutions of stationary phase cultures of the indicated strains were spotted on YEPD and incubated at the indicated temperatures.
- C
Cells with the indicated genotypes were grown at 25°C and then shifted at 34°C (t = 0). Every hour after the temperature shift, the same number of cells was plated on YEPD for each strain and incubated at 25°C to determine the number of colony‐forming units. Percentages of viable cells have been calculated for each strain relative to t = 0. Error bars: SD. N = 3.
- D
Cells with the indicated genotypes were synchronised in G1 with α‐factor at 25°C and then released in fresh medium at 34°C. Cells were collected at the indicated time points for FACS analysis of DNA contents.
References
-
- Jelluma N, Brenkman AB, van den Broek NJF, Cruijsen CWA, van Osch MHJ, Lens SMA, Medema RH, Kops GJPL (2008) Mps1 phosphorylates borealin to control Aurora B activity and chromosome alignment. Cell 132: 233–246 - PubMed
-
- Jones MH, Huneycutt BJ, Pearson CG, Zhang C, Morgan G, Shokat K, Bloom K, Winey M (2005) Chemical genetics reveals a role for Mps1 kinase in kinetochore attachment during mitosis. Curr Biol 15: 160–165 - PubMed
Publication types
MeSH terms
Substances
Associated data
- Actions
Grants and funding
LinkOut - more resources
Full Text Sources
Molecular Biology Databases
Research Materials

