Review
. 2020 Nov;12(6):e1489.
doi: 10.1002/wsbm.1489. Epub 2020 Apr 19.

Molecular networks in Network Medicine: Development and applications

Affiliations
Review

Molecular networks in Network Medicine: Development and applications

Edwin K Silverman et al. Wiley Interdiscip Rev Syst Biol Med. 2020 Nov.

Abstract

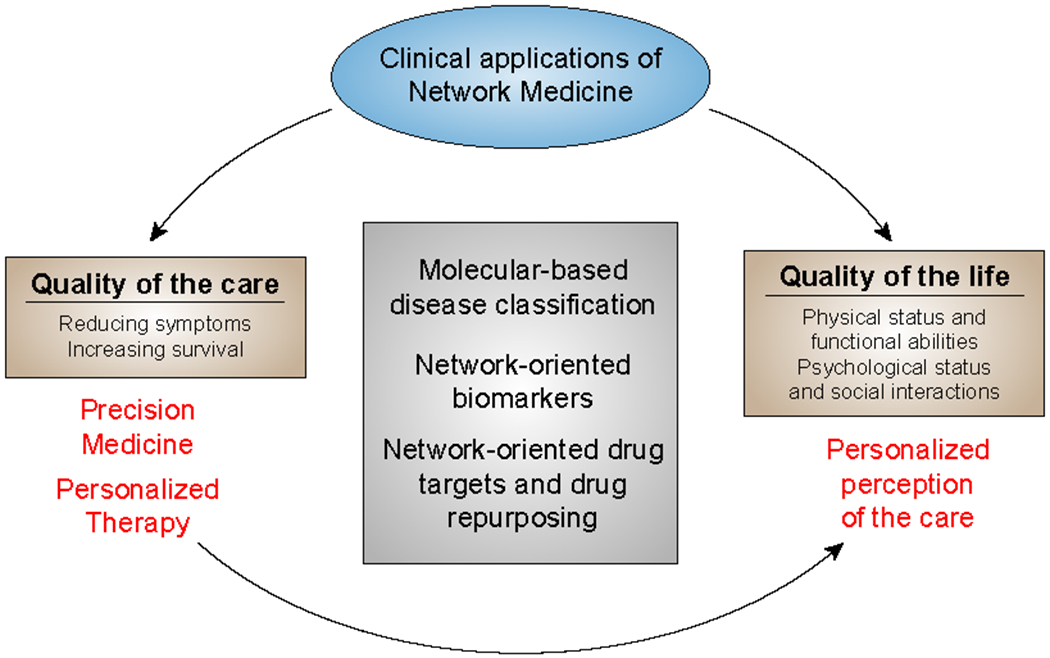
Network Medicine applies network science approaches to investigate disease pathogenesis. Many different analytical methods have been used to infer relevant molecular networks, including protein-protein interaction networks, correlation-based networks, gene regulatory networks, and Bayesian networks. Network Medicine applies these integrated approaches to Omics Big Data (including genetics, epigenetics, transcriptomics, metabolomics, and proteomics) using computational biology tools and, thereby, has the potential to provide improvements in the diagnosis, prognosis, and treatment of complex diseases. We discuss briefly the types of molecular data that are used in molecular network analyses, survey the analytical methods for inferring molecular networks, and review efforts to validate and visualize molecular networks. Successful applications of molecular network analysis have been reported in pulmonary arterial hypertension, coronary heart disease, diabetes mellitus, chronic lung diseases, and drug development. Important knowledge gaps in Network Medicine include incompleteness of the molecular interactome, challenges in identifying key genes within genetic association regions, and limited applications to human diseases. This article is categorized under: Models of Systems Properties and Processes > Mechanistic Models Translational, Genomic, and Systems Medicine > Translational Medicine Analytical and Computational Methods > Analytical Methods Analytical and Computational Methods > Computational Methods.

Keywords: big data; molecular networks; network medicine.


Conflict of interest statement

Conflicts of Interest:

Edwin K. Silverman: Grant support from GSK and Bayer

Harald H.H.W. Schmidt: None reported

Eleni Anastasiadou: None reported

Lucia Altucci: None reported

Marco Angelini: None reported

Lina Badimon: None reported

Jean-Luc Balligand: None reported

Giuditta Benincasa: None reported

Giovambattista Capasso: None reported

Federica Conte: None reported

Antonella Di Costanzo: None reported

Lorenzo Farina: None reported

Giulia Fiscon: None reported

Laurent Gatto: None reported

Michele Gentili: None reported

Joseph Loscalzo: Scipher Medicine, Inc.—cofounder of this biotech start-up, uses network medicine strategies to define biomarkers of therapeutic efficacy and to repurpose drugs

Cinzia Marchese: None reported

Claudio Napoli: None reported

Paola Paci: None reported

Manuela Petti: None reported

John Quackenbush: None reported

Paolo Tieri: None reported

Davide Viggiano: None reported

Gemma Vilahur: None reported

Kimberly Glass: None reported

Jan Baumbach: None reported

Figures

Figure 1:
Figure 1:
(a) A bipartite graph, in this case showing eQTL associations. (b) A unipartite graph and its corresponding adjacency matrix.
Figure 2:
Figure 2:. The effect of centering and scaling on a simple and tractable network of five genes:
(a) genes 1 and 2 are random (in gray), genes 3 and 4 are co-expressed (in blue), and gene 5 (in green) has an expression close, in absolute expression intensity, to gene 3. The width of the graph edges and the layout of the graphs (c, e, f) (i.e., proximity of the nodes) are proportional to the similarity of the nodes/genes. Heatmap (b) and graph (c) represent the Euclidean distances and the resulting network, respectively, illustrating the similarity of genes 3 and 5 when the distances of absolute expression values are used. After centering and scaling of the expression values, we see how the co-expressed genes become closely connected (d, e). At the bottom (f, g), we represent the result of calculating gene expression correlation as a positive control, demonstrating the desired effect directly on the absolute expression values. The nodes of genes 3 and 4 nearly fully overlap.
Figure 3.
Figure 3.. The main principle of PPI network enrichment for mechanistic biomarker extraction,
supervised (left) and de novo/unsupervised (right). In a supervised setting one is interested in finding a set of proteins/genes that explain the difference between two or more classes (e.g. disease subtypes) by the alteration of a set of genes or proteins that form a subnetwork of the interactome. The labels do not necessarily need to be discrete but can be continuous observations or outcomes such as disease progression, growth responses, growth rate, treatment effects, or survival. In an unsupervised setting, no labels are given but the existence of subtypes (called endophenotypes) is assumed, which is characterized by given Omics data. This image is a screenshot from the GrandForest webtool (S.J. Larsen, Schmidt, & Baumbach, 2020), which identifies disease classes and sub-types (de novo) while, conjointly, explaining this stratification with differential sub-network expression. The sub-networks then are enriched with mechanistic candidate biomarkers.
Figure 4.
Figure 4.. The principle of the GrandForest webtool network enrichment approach.
Given a (labeled) Omics data set (e.g., gene expression) and a PPI network, the tool learns decision trees just like in a classical Random Forest but restricts the decision tree growing to only pick proteins that are adjacent (in the network) to at least one previously picked feature protein. This way, all decision trees in the forest model by-design represent subnetworks of the interactome. They can be sorted by feature importance (e.g., using Gini index). The top m genes (user parameter) are located in the input network and the induced subnetwork is reported and visualized as a candidate mechanism driving the phenotype of interest. Importantly, GrandForest can identify subnetworks where many genes are not significant individually but become significant only as a mechanistic marker ensemble (S.J. Larsen et al., 2020).
Figure 5:
Figure 5:. The Visual Analytics cycle applied to Network Medicine.
Data from different domains (e.g., cellular, molecular, and genetic networks) are input to two different processes, Visual Data Exploration which exploits visualization paradigms (Node-Edge, Matrix, Chords, etc.) to represent these data and classic Automated Data Analysis through different approaches (machine learning, network analysis algorithms, etc.). These two processes are interconnected, allowing an analyst to steer algorithms by interacting with the visual representation of results. The whole process generates new insights (e.g., relationships among networks) used as a feedback loop for new cycles of analysis.
Figure 6:
Figure 6:. The Network Medicine approach and its putative clinical applications.
The main goal of Network Medicine is to provide holistic, network-based approaches for disease classification and drug target selection. This molecular-bioinformatic approach has the potential to improve both the quality of care and the quality of life of patients affected by complex diseases.

References

    1. Abbott A (2003). Cell culture: biology’s new dimension. Nature, 424(6951), 870–872. doi:10.1038/424870a - DOI - PubMed
    1. Aghdam R, Ganjali M, Zhang X, & Eslahchi C (2015). CN: a consensus algorithm for inferring gene regulatory networks using the SORDER algorithm and conditional mutual information test. Mol Biosyst, 11(3), 942–949. doi:10.1039/c4mb00413b - DOI - PubMed
    1. Alkorta-Aranburu G, Carmody D, Cheng YW, Nelakuditi V, Ma L, Dickens JT, … Del Gaudio D (2014). Phenotypic heterogeneity in monogenic diabetes: the clinical and diagnostic utility of a gene panel-based next-generation sequencing approach. Mol Genet Metab, 113(4), 315–320. doi:10.1016/j.ymgme.2014.09.007 - DOI - PMC - PubMed
    1. Allis CD, & Jenuwein T (2016). The molecular hallmarks of epigenetic control. Nat Rev Genet, 17(8), 487–500. doi:10.1038/nrg.2016.59 - DOI - PubMed
    1. Anastasiadou E, Jacob LS, & Slack FJ (2018). Non-coding RNA networks in cancer. Nat Rev Cancer, 18(1), 5–18. doi:10.1038/nrc.2017.99 - DOI - PMC - PubMed

Publication types