Comparative Study
. 2020 Jun 1;318(6):F1418-F1429.
doi: 10.1152/ajprenal.00036.2020. Epub 2020 Apr 20.

Intradialytic acid-base changes and organic anion production during high versus low bicarbonate hemodialysis

Affiliations
Comparative Study

Intradialytic acid-base changes and organic anion production during high versus low bicarbonate hemodialysis

Sarah Park et al. Am J Physiol Renal Physiol. .

Abstract

The use of high dialysate bicarbonate for hemodialysis in end-stage renal disease is associated with increased mortality, but potential physiological mediators are poorly understood. Alkalinization due to high dialysate bicarbonate may stimulate organic acid generation, which could lead to poor outcomes. Using measurements of β-hydroxybutyrate (BHB) and lactate, we quantified organic anion (OA) balance in two single-arm studies comparing high and low bicarbonate prescriptions. In study 1 (n = 10), patients became alkalemic using 37 meq/L dialysate bicarbonate; in contrast, with the use of 27 meq/L dialysate, net bicarbonate loss occurred and blood bicarbonate decreased. Total OA losses were not higher with 37 meq/L dialysate bicarbonate (50.9 vs. 49.1 meq using 27 meq/L, P = 0.66); serum BHB increased in both treatments similarly (P = 0.27); and blood lactate was only slightly higher with the use of 37 meq/L dialysate (P = 0.048), differing by 0.2 meq/L at the end of hemodialysis. In study 2 (n = 7), patients achieved steady state on two bicarbonate prescriptions: they were significantly more acidemic when dialyzed against a 30 meq/L bicarbonate dialysate compared with 35 meq/L and, as in study 1, became alkalemic when dialyzed against the higher bicarbonate dialysate. OA losses were similar to those in study 1 and again did not differ between treatments (38.9 vs. 43.5 meq, P = 0.42). Finally, free fatty acid levels increased throughout hemodialysis and correlated with the change in serum BHB (r = 0.81, P < 0.001), implicating upregulation of lipolysis as the mechanism for increased ketone production. In conclusion, lowering dialysate bicarbonate does not meaningfully reduce organic acid generation during hemodialysis or modify organic anion losses into dialysate.

Keywords: bicarbonate; hemodialysis; ketones; lipolysis; organic anion.


Conflict of interest statement

M. K. Abramowitz and T. H. Hostetter have consulted for Tricida, Inc. None of the other authors has any conflicts of interest, financial or otherwise, to disclose.

Figures

Fig. 1.
Fig. 1.
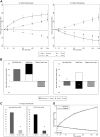
Systemic acid-base parameters and organic anion concentrations during hemodialysis (HD). Data are plotted for HD using 37 meq/L and 27 meq/L dialysate bicarbonate and represented as means ± SE (n = 10 participants). Postdialysis data are plotted separately for the subgroup of 7 participants who had blood samples collected at 30 min and 60 min after the end of dialysis. BHB, β-hydroxybutyrate.
Fig. 2.
Fig. 2.
Transfer rates of bicarbonate, acetate, β-hydroxybutyrate (BHB), and lactate during hemodialysis (HD). Rates were calculated using measurements from the arterial and venous limbs of the HD circuit. Positive values represent gain into the systemic circulation; negative values represent loss into the dialysate. Data are plotted for HD using 37 meq/L and 27 meq/L dialysate bicarbonate and presented as means ± SE.
Fig. 3.
Fig. 3.
Alkali and organic anion balance during hemodialysis (HD). A: cumulative bicarbonate, acetate, β-hydroxybutyrate (BHB), and lactate gains and losses over time. Data are means ± SE. B: net alkali balance plotted alongside total bicarbonate, acetate, BHB, and lactate gains and losses. C: net alkali and bicarbonate gains during the first 135 min of HD vs. the remainder of HD using 37 meq/L bicarbonate dialysate. D: smoothed locally weighted scatterplot smoothing (LOWESS) curves fitted to observed and predicted values of blood bicarbonate during HD with dialysate containing 37 meq/L bicarbonate (top 2 curves) and 27 meq/L bicarbonate (bottom 2 curves). Predicted values calculated from a random effects model incorporating the predialysis bicarbonate level and cumulative gain or loss of bicarbonate, acetate, BHB, and lactate at each timepoint. *P < 0.001.
Fig. 4.
Fig. 4.
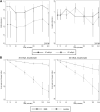
Systemic acid-base parameters and organic anion concentrations during hemodialysis (HD) in patients with stable acid-base balance treated with high and low bicarbonate HD. Data are plotted for HD using 35 meq/L and 30 meq/L dialysate bicarbonate and presented as means ± SE (n = 7 participants). Postdialysis data are plotted separately for the subgroup of 5 participants who had blood samples collected at 30 min and 60 min after the end of dialysis. BHB, β-hydroxybutyrate.
Fig. 5.
Fig. 5.
Comparison of blood and dialysate sampling for calculation of β-hydroxybutyrate (BHB) and lactate loss. Scatterplots, fitted regression lines, and Pearson correlation coefficients are from study 1 data. The line of unity is displayed on each plot.
Fig. 6.
Fig. 6.
β-Hydroxybutyrate (BHB) and lactate losses during hemodialysis (HD) using 35 meq/L and 30 meq/L dialysate bicarbonate. A: transfer rates of BHB and lactate. B: cumulative BHB and lactate losses. Rates were calculated using dialysate measurements. Data are presented as means ± SE.
Fig. 7.
Fig. 7.
Correlations of the change in free fatty acid (FFA) levels with changes in serum β-hydroxybutyrate (BHB) and blood lactate during hemodialysis (HD). Data were derived from study 2. Correlations were examined by calculating Pearson correlation coefficients.
Fig. 8.
Fig. 8.
Systemic organic anion concentrations during hemodialysis (HD) by diabetes and obesity status. Data are plotted for HD from 2 studies using high (37 or 35 meq/L) and low (30 or 27 meq/L) dialysate bicarbonate and presented as means ± SE (n = 17 participants). Postdialysis data are plotted separately for the subgroup of 12 participants who had blood samples collected at 30 min and 60 min after the end of dialysis. Obesity was defined as body mass index (BMI) ≥ 30 kg/m2; n = 12 participants with diabetes and n = 9 obese participants.

Comment in

References

    1. Alfakir M, Moammar MQ, Ali MI, Alhatem E, Curran RD, Saoud RM, Chandran C, Khan MA, Debari VA. Pulmonary gas exchange during hemodialysis: a comparison of subjects with and without COPD on bicarbonate hemodialysis. Ann Clin Lab Sci 41: 315–320, 2011. - PubMed
    1. Andersen BL, Tarpley HT, Regen DM. Characterization of β-hydroxybutyrate transport in rat erythrocytes and thymocytes. Biochim Biophys Acta 508: 525–538, 1978. doi:10.1016/0005-2736(78)90097-4. - DOI - PubMed
    1. Braun K, Oeckl J, Westermeier J, Li Y, Klingenspor M. Non-adrenergic control of lipolysis and thermogenesis in adipose tissues. J Exp Biol 221, Suppl 1: jeb165381, 2018. doi:10.1242/jeb.165381. - DOI - PubMed
    1. Buchanan C, Mohammed A, Cox E, Köhler K, Canaud B, Taal MW, Selby NM, Francis S, McIntyre CW. Intradialytic cardiac magnetic resonance imaging to assess cardiovascular responses in a short-term trial of hemodiafiltration and hemodialysis. J Am Soc Nephrol 28: 1269–1277, 2017. doi:10.1681/ASN.2016060686. - DOI - PMC - PubMed
    1. De Smet R, Van Kaer J, Liebich H, Lesaffer G, Verstraete A, Dhondt A, Duym P, Lameire N, Vanholder R. Heparin-induced release of protein-bound solutes during hemodialysis is an in vitro artifact. Clin Chem 47: 901–909, 2001. doi:10.1093/clinchem/47.5.901. - DOI - PubMed

Publication types

MeSH terms