. 2020 Apr 21;9(8):e015299.
doi: 10.1161/JAHA.119.015299. Epub 2020 Apr 20.

Epigenomic Assessment of Cardiovascular Disease Risk and Interactions With Traditional Risk Metrics

Affiliations

Epigenomic Assessment of Cardiovascular Disease Risk and Interactions With Traditional Risk Metrics

Kenneth Westerman et al. J Am Heart Assoc. .

Abstract

Background Epigenome-wide association studies for cardiometabolic risk factors have discovered multiple loci associated with incident cardiovascular disease (CVD). However, few studies have sought to directly optimize a predictor of CVD risk. Furthermore, it is challenging to train multivariate models across multiple studies in the presence of study- or batch effects. Methods and Results Here, we analyzed existing DNA methylation data collected using the Illumina HumanMethylation450 microarray to create a predictor of CVD risk across 3 cohorts: Women's Health Initiative, Framingham Heart Study Offspring Cohort, and Lothian Birth Cohorts. We trained Cox proportional hazards-based elastic net regressions for incident CVD separately in each cohort and used a recently introduced cross-study learning approach to integrate these individual scores into an ensemble predictor. The methylation-based risk score was associated with CVD time-to-event in a held-out fraction of the Framingham data set (hazard ratio per SD=1.28, 95% CI, 1.10-1.50) and predicted myocardial infarction status in the independent REGICOR (Girona Heart Registry) data set (odds ratio per SD=2.14, 95% CI, 1.58-2.89). These associations remained after adjustment for traditional cardiovascular risk factors and were similar to those from elastic net models trained on a directly merged data set. Additionally, we investigated interactions between the methylation-based risk score and both genetic and biochemical CVD risk, showing preliminary evidence of an enhanced performance in those with less traditional risk factor elevation. Conclusions This investigation provides proof-of-concept for a genome-wide, CVD-specific epigenomic risk score and suggests that DNA methylation data may enable the discovery of high-risk individuals who would be missed by alternative risk metrics.

Keywords: DNA methylation; cardiovascular disease; epigenomics; risk prediction.


Figures

Figure 1
Figure 1. Computational workflow for MRS development and evaluation.
The initial MRS was trained in 3 cohorts with Framingham Heart Study Offspring Cohort (University of Minnesota subset) held out to evaluate performance. The final MRS was then trained using all 4 data sets and examined for biological significance, before testing for prevalent myocardial infarction discrimination in an independent cohort and assessment of interactions with genetic and traditional risk scores. FHSJHU indicates Framingham Heart Study Offspring Cohort (Johns Hopkins University subset); FHSUM, Framingham Heart Study Offspring Cohort (University of Minnesota subset); LBC, Lothian Birth Cohorts 1936; MI, myocardial infarction; MRS, methylation‐based risk score; and WHI, Women's Health Initiative.
Figure 2
Figure 2. Kaplan–Meier survival curves in the held‐out Framingham Heart Study Offspring Cohort (University of Minnesota subset data set).
Individual curves correspond to tertiles of the initial (3‐data set) methylation‐based risk score. Vertical ticks correspond to censored observations, and colored bands represent 95% CI for tertile‐specific survival curves. X‐axis is limited to the time span in which at least 50 uncensored observations remained for each tertile (3275 days). MRS indicates methylation‐based risk score.
Figure 3
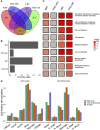
Figure 3. Characterization of the final cross study learner model.
A, Overlap of cytosine‐phosphate‐guanine (CpG) sites in the 4 individual predictors constituting the final model. B, Study‐specific weights for constructing the ensemble model (derived from the “stacking” regression). C, Results from Gene Ontology (GO)‐based enrichment analysis using genes annotated to single‐study learner component CpGs. All GO terms with false discovery rate <0.001 in any cohort are shown and colored according to −log(P value) for enrichment in each single‐study learner. Values were cut at −log(P)=20 for visualization purposes. D, Proportion of CpGs in the full set of cross study learner CpGs (union of CpG sets in each component SSL) compared with the 100 000 most variable CpGs (as used in single‐study learner model development) and the full set of available CpGs. Groupings according to both gene‐based and CpG island‐based CpG annotations are shown. CpG indicates cytosine‐phosphate‐guanine; FHSJHU, Framingham Heart Study Offspring Cohort (Johns Hopkins University subset); FHSUM, Framingham Heart Study Offspring Cohort (University of Minnesota subset); LBC, Lothian Birth Cohorts 1936; MRS, methylation‐based risk score; WHI, Women's Health Initiative; UTR, untranslated region; and TSS, transcription start site.
Figure 4
Figure 4. Interactions of MRS with other biomarkers of CVD risk.
A, Hazard ratios for the MRS within subsets of 10‐year generalized CVD risk according to the Framingham Risk Score. B, Hazard ratios for the MRS within quartiles of a genetic cardiovascular risk score (in European‐ancestry WHI participants only). Hazard ratios are estimated using the final MRS, which was trained using each of these data sets. Cox regressions included stratum‐specific baseline hazards and were adjusted for age, sex, and estimated cell subtype fractions. Error bars represent standard errors for the hazard ratio estimates. Annotated P values describe the test of interaction between the MRS and the alternative risk metric. FRS indicates Framingham Risk Score; GRS, genetic risk score; and MRS, methylation‐based risk score.

References

    1. Bonder MJ, Luijk R, Zhernakova DV, Moed M, Deelen P, Vermaat M, van Iterson M, van Dijk F, van Galen M, Bot J, et al. Disease variants alter transcription factor levels and methylation of their binding sites. Nat Genet. 2016;49:131–138. - PubMed
    1. Tobi EW, Slieker RC, Luijk R, Dekkers KF, Stein AD, Xu KM, Slagboom PE, van Zwet EW, Lumey LH, Heijmans BT. DNA methylation as a mediator of the association between prenatal adversity and risk factors for metabolic disease in adulthood. Sci Adv. 2018;4:eaao4364. - PMC - PubMed
    1. Bacos K, Gillberg L, Volkov P, Olsson AH, Hansen T, Pedersen O, Gjesing AP, Eiberg H, Tuomi T, Almgren P, et al. Blood‐based biomarkers of age‐associated epigenetic changes in human islets associate with insulin secretion and diabetes. Nat Commun. 2016;7:11089. - PMC - PubMed
    1. Wahl S, Drong A, Lehne B, Loh M, Scott WR, Kunze S, Tsai P‐C, Ried JS, Zhang W, Yang Y, et al. Epigenome‐wide association study of body mass index and the adverse outcomes of adiposity. Nature. 2017;541:81–86. - PMC - PubMed
    1. Levine ME, Lu AT, Quach A, Chen BH, Assimes TL, Bandinelli S, Hou L, Baccarelli AA, Stewart JD, Li Y, et al. An epigenetic biomarker of aging for lifespan and healthspan. Aging (Albany NY). 2018;10:573–591. - PMC - PubMed

Publication types

MeSH terms

LinkOut - more resources