

Distinctive features gleaned from the comparative genomes analysis of clinical and non-clinical isolates of Klebsiella pneumoniae
- PMID: 32308268
- PMCID: PMC7147497
- DOI: 10.6026/97320630016256
Distinctive features gleaned from the comparative genomes analysis of clinical and non-clinical isolates of Klebsiella pneumoniae
Abstract
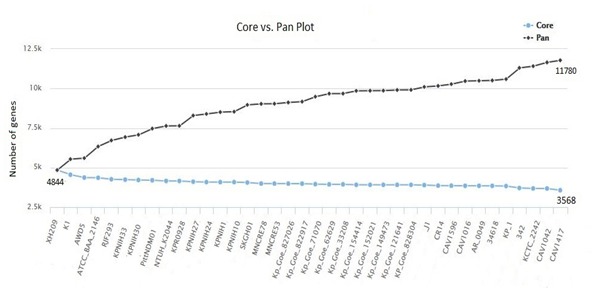
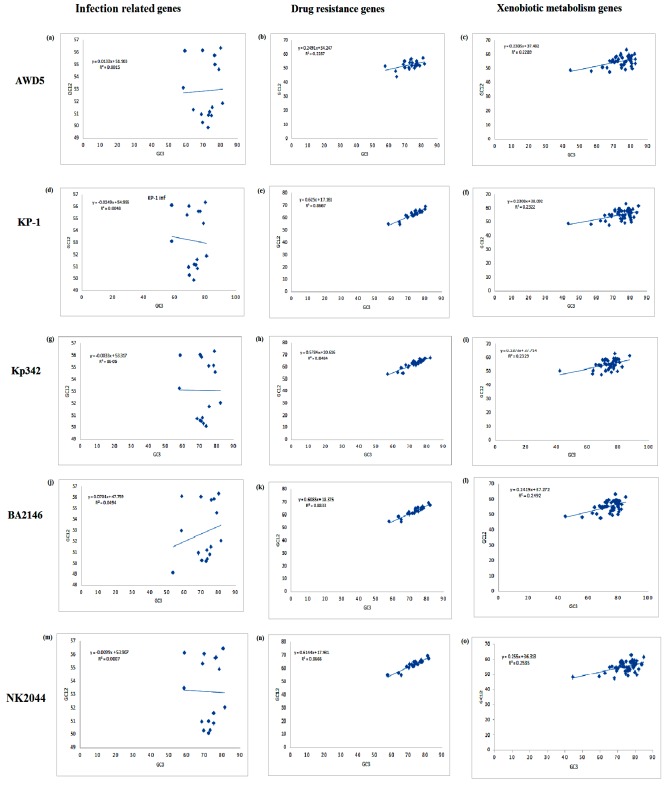
It is of interest to describe the distinctive features gleaned from the comparative genome analysis of clinical and non-clinical isolates of Klebsiella pneumoniae. The core genome of K. pneumoinae consisted of 3568 genes. Comparative genome analysis shows that mdtABCD, toxin-antitoxin systems are unique to clinical isolates and catB, benA, and transporter genes for citrate utilization are exclusive to non-clinical isolates. We further noted aromatic compound degrading genes in non-clinical isolates unlike in the later isolates. We grouped 88 core genes into 3 groups linked to infections, drug-resistance or xenobiotic metabolism using codon usage variation analysis. It is inferred using the neutrality plot analysis of GC12 with GC3 that codon usage variation is dominant over mutation pressure. Thus, we document data to distinguish clinical and non-clinical isolates of K. pneumoniae using comparative genomes analysis for understanding of genome diversity during speciation.
Keywords: Codon usage bias; Comparative genomics; Klebsiella pneumoniae.
© 2020 Biomedical Informatics.
Figures


Similar articles
-
Comparative genomics and virulome analysis reveal unique features associated with clinical strains of Klebsiella pneumoniae and Klebsiella quasipneumoniae from Trinidad, West Indies.PLoS One. 2023 Jul 10;18(7):e0283583. doi: 10.1371/journal.pone.0283583. eCollection 2023. PLoS One. 2023. PMID: 37428714 Free PMC article.
-
Characterization of Klebsiella sp. strain 10982, a colonizer of humans that contains novel antibiotic resistance alleles and exhibits genetic similarities to plant and clinical Klebsiella isolates.Antimicrob Agents Chemother. 2014;58(4):1879-88. doi: 10.1128/AAC.01605-13. Epub 2014 Jan 6. Antimicrob Agents Chemother. 2014. PMID: 24395222 Free PMC article.
-
Comparative Analysis on the Codon Usage Pattern of the Chloroplast Genomes in Malus Species.Biochem Genet. 2023 Jun;61(3):1050-1064. doi: 10.1007/s10528-022-10302-8. Epub 2022 Nov 21. Biochem Genet. 2023. PMID: 36414922
-
Exploring the resistome, virulome, and mobilome of multidrug-resistant Klebsiella pneumoniae isolates: deciphering the molecular basis of carbapenem resistance.BMC Genomics. 2024 Apr 25;25(1):408. doi: 10.1186/s12864-024-10139-y. BMC Genomics. 2024. PMID: 38664636 Free PMC article.
-
Common and distinctive genomic features of Klebsiella pneumoniae thriving in the natural environment or in clinical settings.Sci Rep. 2022 Jun 21;12(1):10441. doi: 10.1038/s41598-022-14547-6. Sci Rep. 2022. PMID: 35729190 Free PMC article.
Cited by
-
Unravelling Prokaryotic Codon Usage: Insights from Phylogeny, Influencing Factors and Pathogenicity.Curr Genomics. 2025;26(2):81-94. doi: 10.2174/0113892029325491240919151045. Epub 2024 Oct 1. Curr Genomics. 2025. PMID: 40433443 Free PMC article. Review.
References
LinkOut - more resources
Full Text Sources
Molecular Biology Databases