

The BELT and phenoSEED platforms: shape and colour phenotyping of seed samples
- PMID: 32308727
- PMCID: PMC7149850
- DOI: 10.1186/s13007-020-00591-8
The BELT and phenoSEED platforms: shape and colour phenotyping of seed samples
Abstract
Background: Quantitative and qualitative assessment of visual and morphological traits of seed is slow and imprecise with potential for bias to be introduced when gathered with handheld tools. Colour, size and shape traits can be acquired from properly calibrated seed images. New automated tools were requested to improve data acquisition efficacy with an emphasis on developing research workflows.
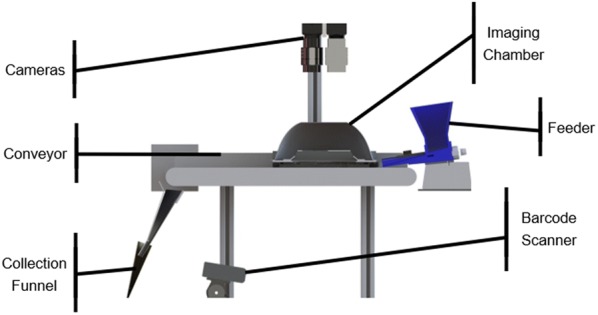
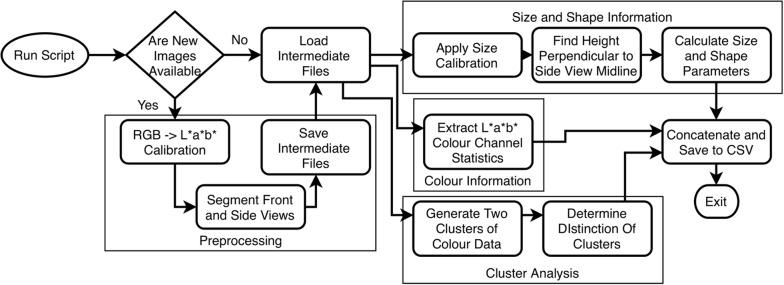
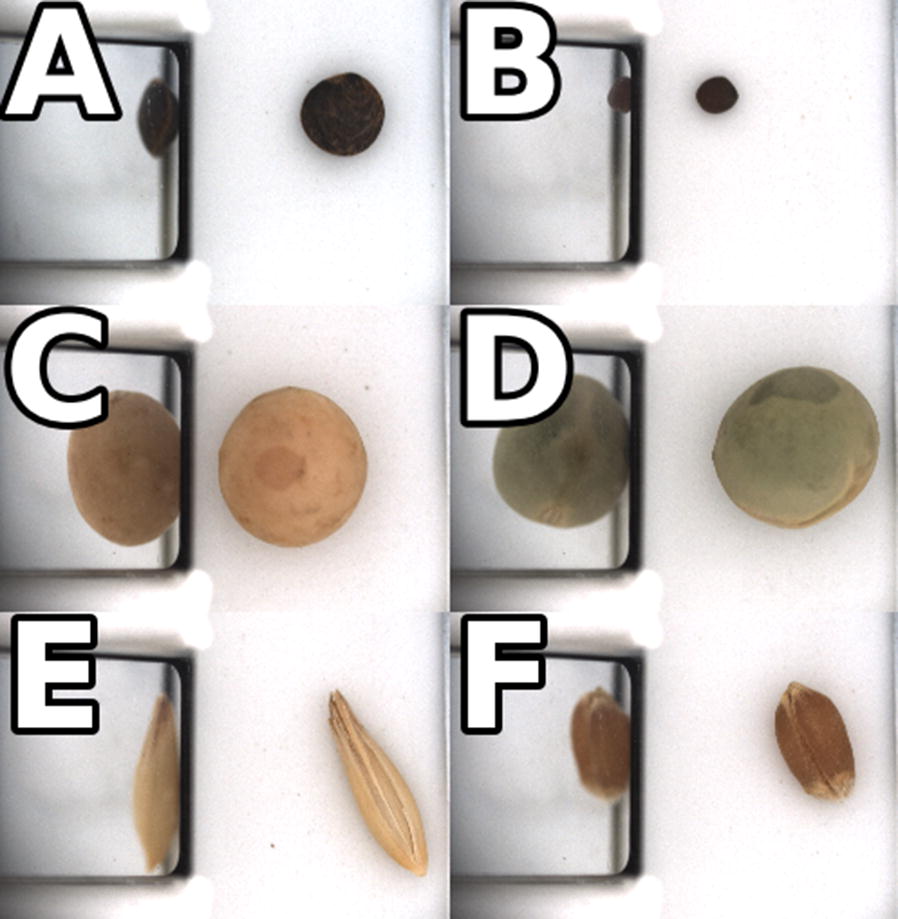
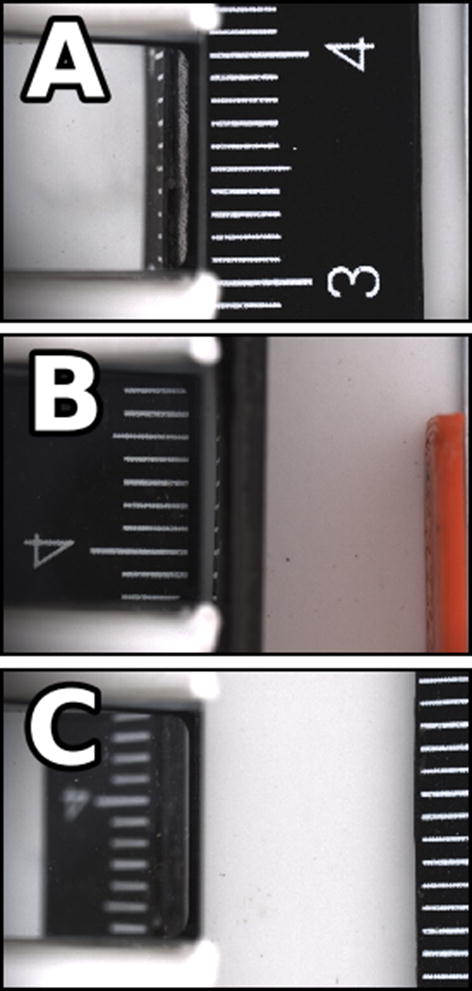
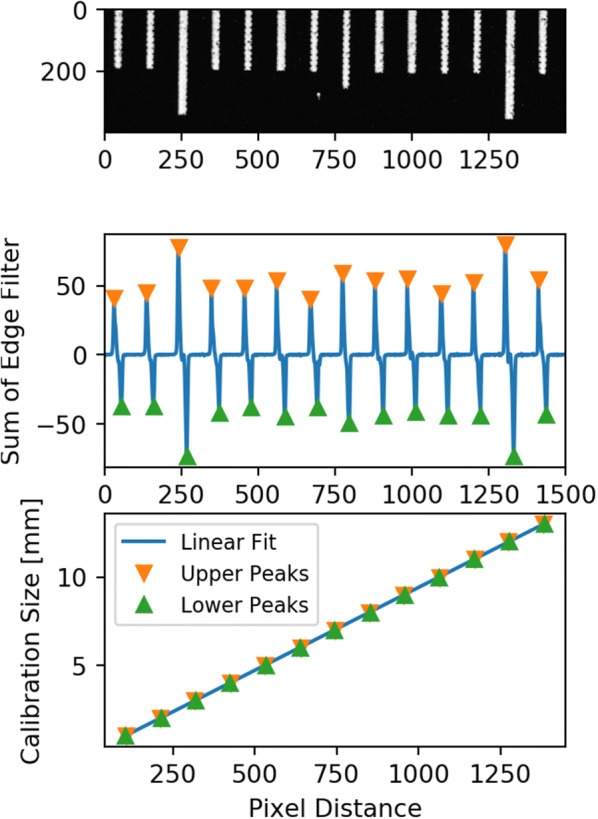
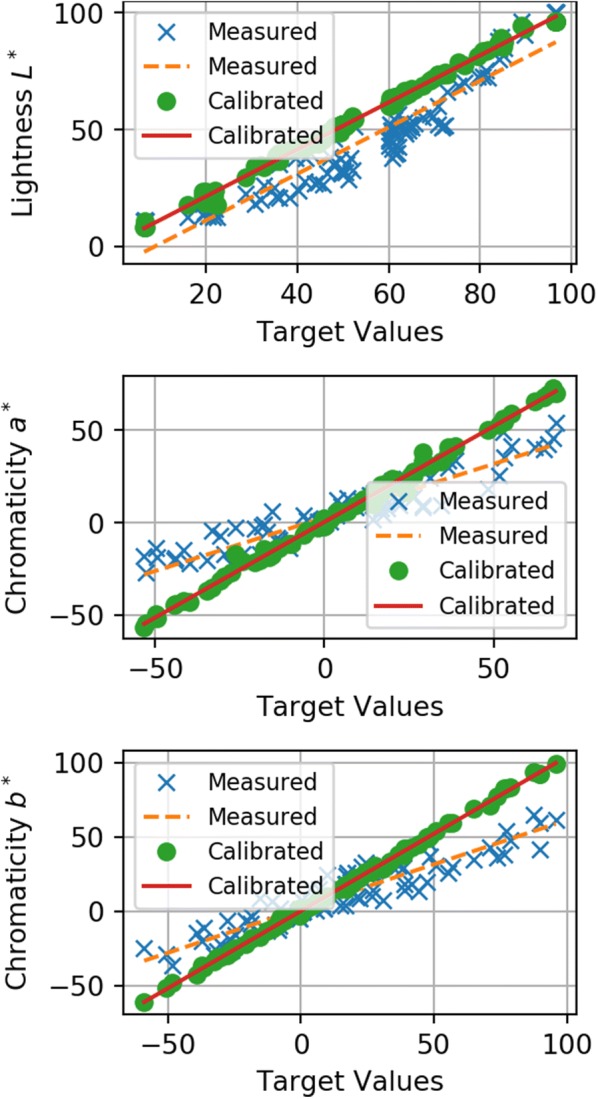
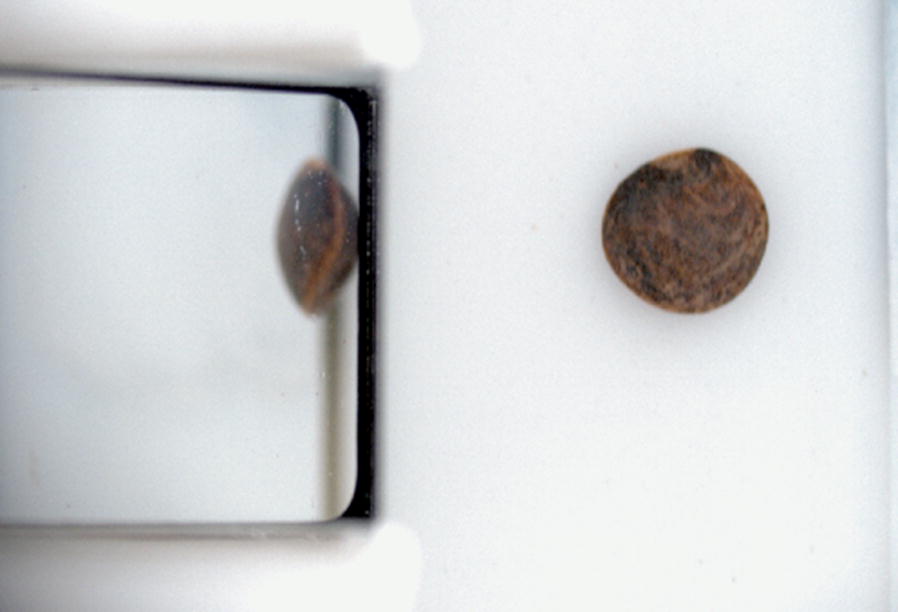
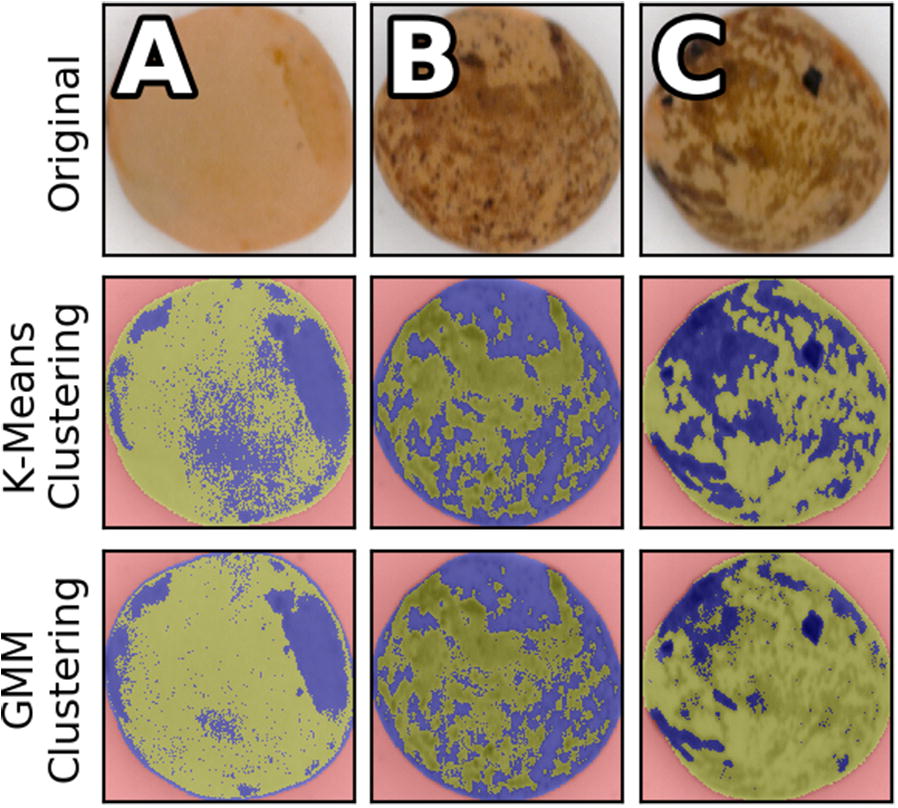
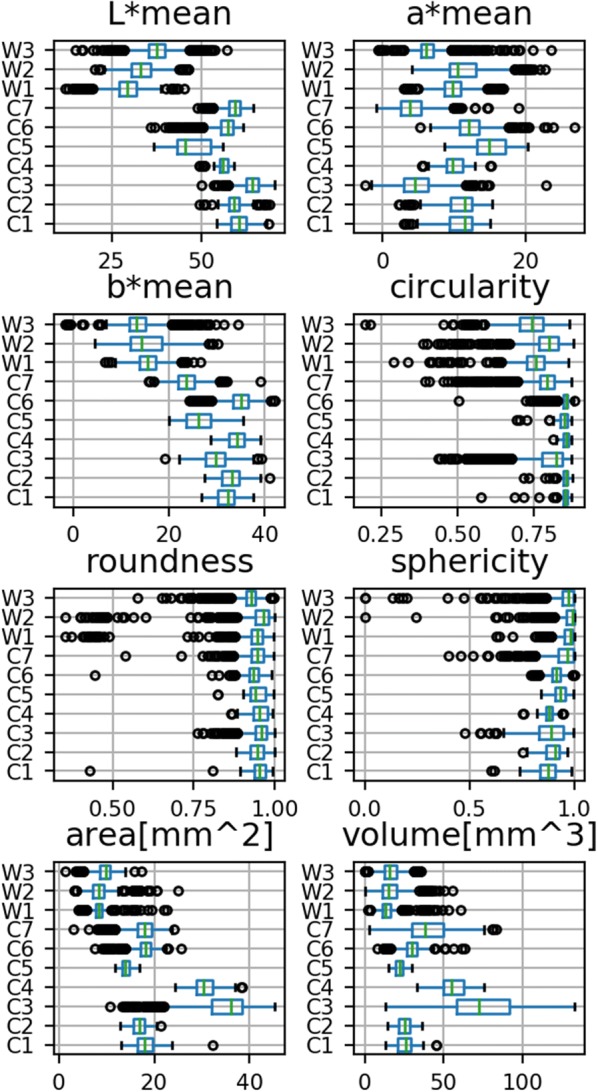
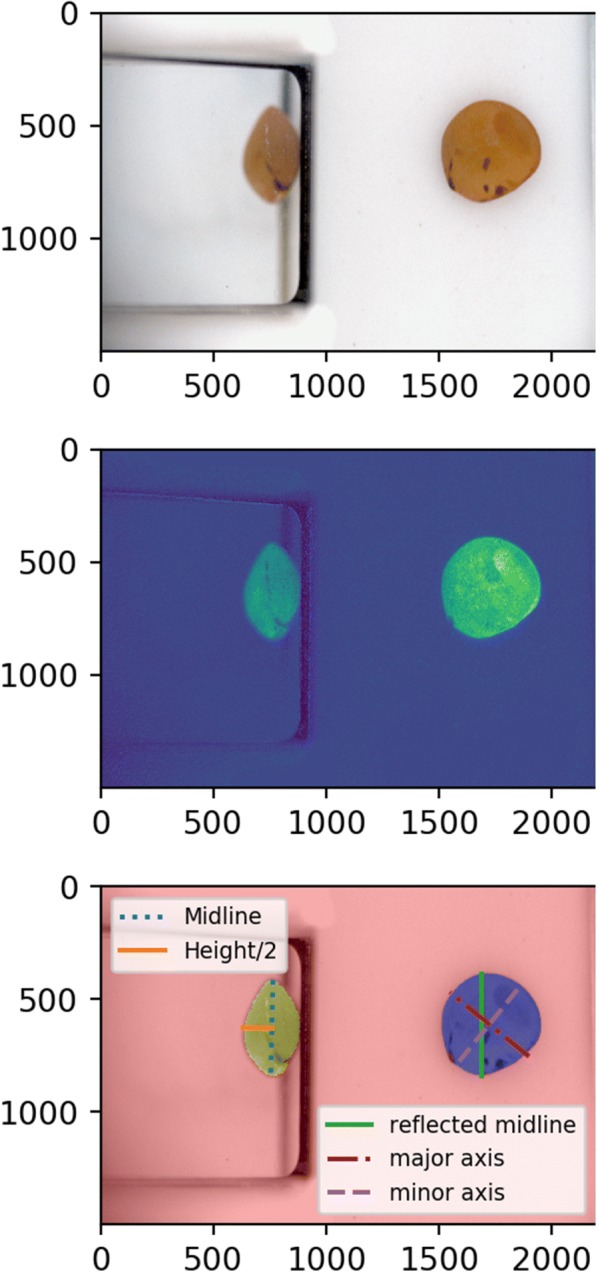
Results: A portable imaging system (BELT) supported by image acquisition and analysis software (phenoSEED) was created for small-seed optical analysis. Lentil (Lens culinaris L.) phenotyping was used as the primary test case. Seeds were loaded into the system and all seeds in a sample were automatically individually imaged to acquire top and side views as they passed through an imaging chamber. A Python analysis script applied a colour calibration and extracted quantifiable traits of seed colour, size and shape. Extraction of lentil seed coat patterning was implemented to further describe the seed coat. The use of this device was forecasted to eliminate operator biases, increase the rate of acquisition of traits, and capture qualitative information about traits that have been historically analyzed by eye.
Conclusions: Increased precision and higher rates of data acquisition compared to traditional techniques will help to extract larger datasets and explore more research questions. The system presented is available as an open-source project for academic and non-commercial use.
Keywords: Camera; Colour; Computer vision; Lentil; Open source; Phenotyping; Seed coat.
© The Author(s) 2020.
Conflict of interest statement
Competing interestsThe authors declare that they have no competing interests.
Figures
References
-
- Black CK, Panozzo JF. Accurate technique for measuring color values of grain and grain products using a visible-NIR instrument. Cereal Chem J. 2004;81(4):469–474. doi: 10.1094/CCHEM.2004.81.4.469. - DOI
-
- Gentallan RP, Altoveros NC, Borromeo TH, Endonela LE, Hay FR, Lalusin AG, Reaño CE, Yoshioka Y. Systematic establishment of colour descriptor states through image-based phenotyping. Plant Genet Resour. 2019;17(1):91–94. doi: 10.1017/S1479262118000291. - DOI
-
- Kingma DP, Ba J. Adam: A Method for Stochastic Optimization. arXiv:1412.6980 [cs] 2014. arXiv: 1412.6980. Accessed 26 July 2019.
-
- LeMasurier LS, Panozzo JF, Walker CK. A digital image analysis method for assessment of lentil size traits. J Food Eng. 2014;128:72–78. doi: 10.1016/j.jfoodeng.2013.12.018. - DOI
-
- León K, Mery D, Pedreschi F, León J. Color measurement in L*a*b* units from RGB digital images. Food Res Int. 2006;39(10):1084–1091. doi: 10.1016/j.foodres.2006.03.006. - DOI
LinkOut - more resources
Full Text Sources
