. 2020 Mar 26;10(11):4762-4778.
doi: 10.7150/thno.43839. eCollection 2020.

Hypoxia-induced lncRNA-AC020978 promotes proliferation and glycolytic metabolism of non-small cell lung cancer by regulating PKM2/HIF-1α axis

Affiliations

Hypoxia-induced lncRNA-AC020978 promotes proliferation and glycolytic metabolism of non-small cell lung cancer by regulating PKM2/HIF-1α axis

Qian Hua et al. Theranostics. .

Abstract

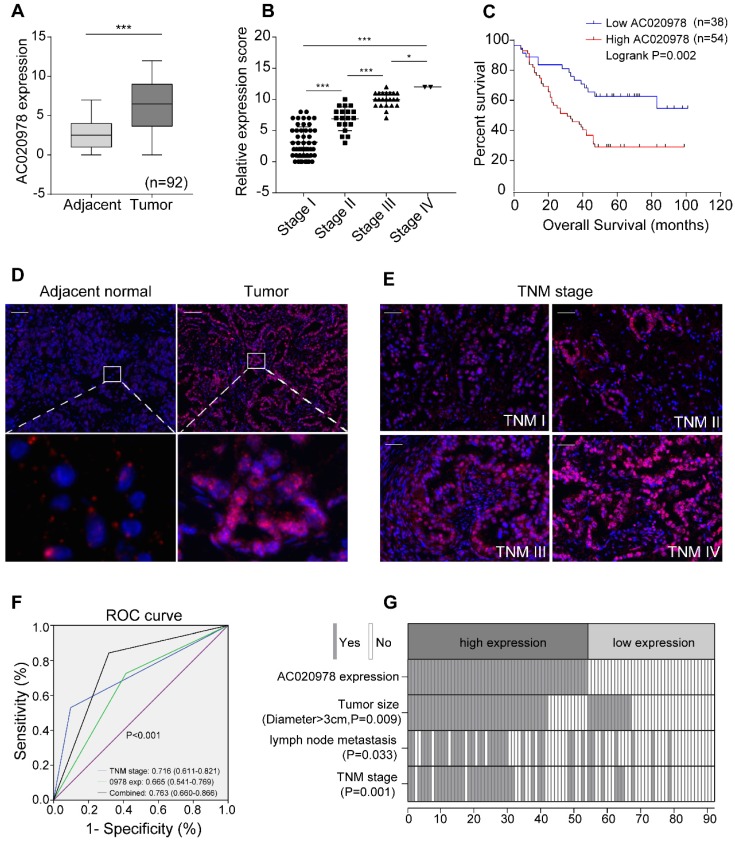
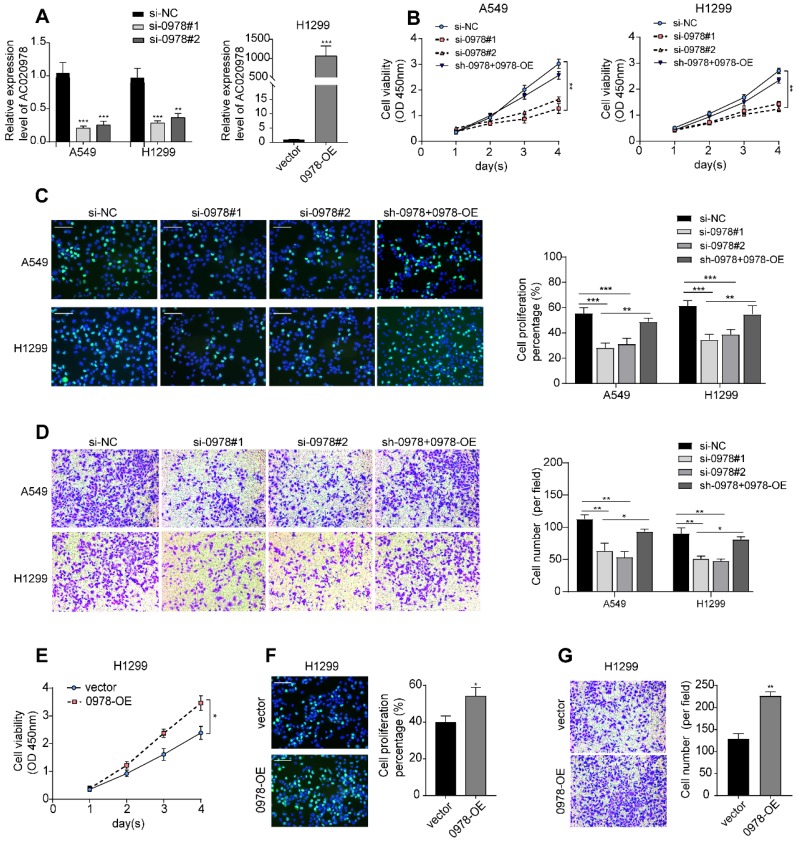
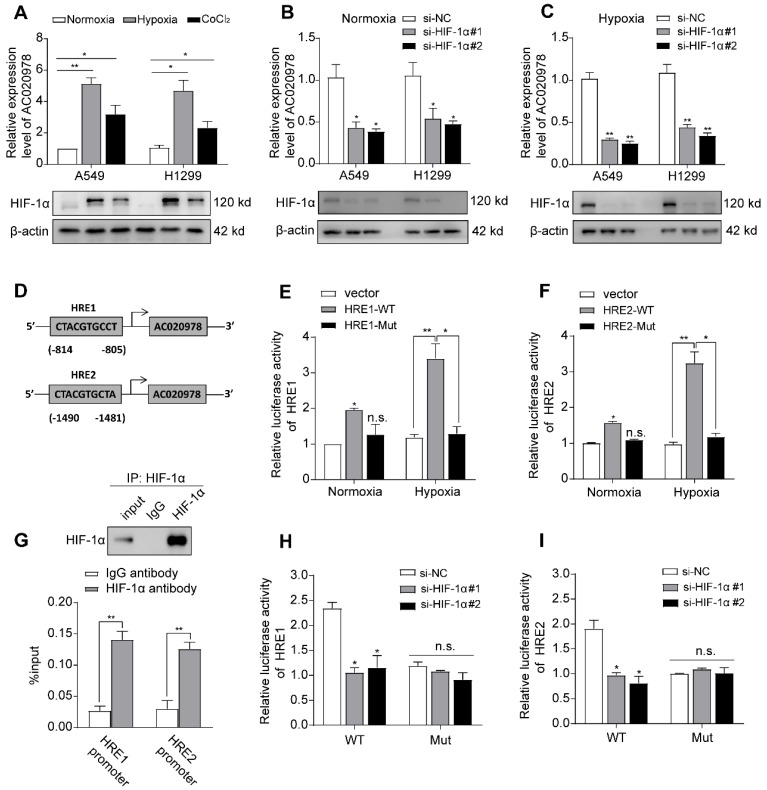
Rationale: Non-small cell lung cancer (NSCLC) is a deadly disease with a hallmark of aberrant metabolism. The mechanism of glycolysis associated lncRNA underlying the aggressive behaviors of NSCLC is poorly understood. Methods: The expression level of AC020978 in NSCLC was measured by quantitative real-time PCR and fluorescence in situ hybridization (FISH) assay. The biological role of AC020978 in cell proliferation and aerobic glycolysis was determined by functional experiments in vitro and in vivo. The transcription of AC020978 was assessed by dual-luciferase reporter and chromatin immunoprecipitation (ChIP) assay. RNA pull-down, mass spectrometry and RNA immunoprecipitation (RIP) assays were used to identify the interaction protein with AC020978. Western blotting, in situ proximity ligation assay (PLA), and co-immunoprecipitation (co-IP) were performed to reveal the potential mechanism of AC020978. Results: The present study indicated that AC020978 was upregulated in NSCLC, significantly correlated with advanced TNM stage and poor clinical outcomes, representing as an independent prognostic predictor. Functional assays revealed AC020978's role in promoting cell growth and metabolic reprogramming. Moreover, AC020978 was an upregulated lncRNA under glucose starvation as well as hypoxia conditions, and directly transactivated by HIF-1α. Mechanistic investigations identified that AC020978 directly interacted with Pyruvate kinase isozymes M2 (PKM2) and enhanced PKM2 protein stability. Besides, this study uncovered that AC020978 could promote the nuclear translocation of PKM2 and regulate PKM2-enhanced HIF-1α transcription activity. Conclusions: Together, these data provided evidence that AC020978 conferred an aggressive phenotype to NSCLC and was a poor prognosticator. Targeting AC020978 might be an effective therapeutic strategy for NSCLC.

Keywords: AC020978; HIF-1α; Long noncoding RNAs; PKM2; aerobic glycolysis.


Conflict of interest statement

Competing Interests: The authors have declared that no competing interest exists.

Figures

Figure 1
Figure 1
LncRNA candidate AC020978 is clinically relevant in NSCLC. (A) Statistical analysis of AC020978's FISH expression score in 92 pairs of NSCLC tissues and adjacent normal tissues, paired t-test. In boxplots (middle line depicts the median and the whiskers the min to max. range). (B) Relative AC020978's FISH expression levels in different TNM stages. (C) Survival is analyzed and compared between patients with low and high levels of AC020978 in 92 NSCLC patients, log-rank test.( high expression: score 7-12; low expression: score 0-6). (D-E) Representative FISH images of AC020978 expression in NSCLC tumor tissues and in different TNM stages (blue, DAPI; red spot, positive staining; Scale bar = 100 µm). (F) ROC analysis of AC020978-based, TNM-based and the combination model in predicting clinical outcome. (G) The heatmap illustrates the association of different clinical characters with AC020978 high and low-expression tumors. Data shown are mean±SD (n = 3). (*P < 0.05, **P < 0.01, ***P < 0.001).
Figure 2
Figure 2
AC020978 is an oncogenic lncRNA in NSCLC cells. (A) The inhibiting efficiency of two different AC020978 siRNAs in both A549 and H1299 cells. Relative expression levels of AC020978 in H1299 cell transfected with pcDNA-0978 plasmid. (B) Cell proliferation was performed by CCK-8 assay over a 4-day period in A549 and H1299 cells transfected with negative control group (si-NC), AC020978 siRNAs group (si-0978#1, si-0978#2) and rescue group (sh-0978+0978-OE). (C) Immunofluorescence analysis of Edu was performed in in A549 and H1299 cells transfected with negative control group (si-NC), AC020978 siRNAs group (si-0978#1, si-0978#2) and rescue group (sh-0978+0978-OE) after 24 h. (D) Transwell assay was performed in in A549 and H1299 cells transfected with negative control group (si-NC), AC020978 siRNAs group (si-0978#1, si-0978#2) and rescue group (sh-0978+0978-OE) after 24 h. (E) Cell proliferation was performed by CCK-8 assay over a 4-day period in H1299 cells transfected with pcDNA-0978 or vector control. (F) Immunofluorescence analysis of Edu was performed in AC020978 overexpression cells after 24 h. (G) Transwell assay was performed in AC020978 overexpression cells after 24 h. Scale bar = 100 µm. Data shown are mean±SD (n = 3). (*P < 0.05, **P < 0.01, ***P < 0.001).
Figure 3
Figure 3
AC020978 is induced under metabolic stress and enhances glycolytic metabolism. (A-B) QPCR results showed that AC020978 was upregulated under low glucose culture conditions compared to normal glucose in dose-dependent manner (A, culture for 24 h) and time-dependent manner (B, glucose 2.5 mM). (C-D) QPCR results showed that AC020978 was increased after 2-DG treatment in dose-dependent manner (C, culture for 72h) and in time-dependent manner (D, 2-DG 5 mM). (E) Oxygen Consumption Rate (OCR) upon cells were measured by Seahorse XF after transfecting with si-NC or si-0978 in A549 cells. The OCR curves treated with oligomycin, FCCP and rotenone/antimycin A. Black arrows indicate the time point of cell treatment. (F) Extracellular acid ratio (ECAR) upon cells were measured by Seahorse XF after transfecting with si-NC or si-0978 in A549 cells. The ECAR curves treated with glucose, oligomycin and 2-DG. Black arrows indicate the time point of cell treatment. (G) The change of OCR level with different treatment in H1299 cells after transfecting with empty vector or pcDNA-0978. (H) The change of ECAR level with different treatment in H1299 cells after transfecting with empty vector or pcDNA-0978. (I) Relative 18F-FDG uptake level was determined in A549 cells transfected with si-NC or si-0978 and in H1299 cells transfected with control or AC020978 overexpression plasmid. (J)Relative lactate release level was determined in A549 cells transfected with si-NC or si-0978 and in H1299 cells transfected with control or AC020978 overexpression plasmid. (K) HK2, GLUT1, PDK1, ENO1 and LDHA protein levels were examined under AC020978 knockdown and overexpression conditions by western blotting. (L) HIF-1α protein expression and HIF-1α responsive luciferase reporter were examined under low glucose culture conditions (glucose 2.5 mM) at the indicated time point. Data shown are mean±SD (n = 3). (*P < 0.05, **P < 0.01, ***P < 0.001).
Figure 4
Figure 4
AC020978 promotes tumorigenesis and aerobic glycolysis in vivo. (A) Image of xenograft tumors resected from nude mice-bearing A549 cells with or without AC020978 knockdown (n=6). (B) Tumor growth curves showed that sh-0978 group suppressed tumor growth compared with sh-NC group. (C) Representative 18F-FDG micro-PET/CT images of two living nude mice were conducted 3 weeks after subcutaneous inoculation. Images showed obvious FDG uptake in sh-NC xenografts, while mild FDG uptake in sh-0978 xenografts. (D) Tumor weight was measured in mice after different treatments. (E) Comparison of the maximum standard 18F-FDG uptake value (SUVmax) of tumor tissues between sh-NC and sh-0978 group. (F) Quantification of the proliferation index (Ki-67 proportion), positive staining sections of PKM2 and HIF-1α levels in the tumor sections between sh-NC and sh-0978 group. (G) Representative images of H&E staining and IHC staining of Ki-67, PKM2 and HIF-1α from the tumor sections between sh-NC and sh-0978 group. Scale bar = 100 µm (200x). Data shown are mean±SD (n = 3). (*P < 0.05, **P < 0.01, ***P < 0.001).
Figure 5
Figure 5
AC020978 is a direct transcriptional target of HIF-1α. (A) The expression levels of AC020978 (upper) and HIF-1α protein (lower) in A549 and H1299 cells were measured after culturing under normoxia, hypoxia (1% O2) or CoCl2 (100 μM) for 24 h by qRT-PCR and Western blot. (B) The expression of AC020978 was evaluated by qRT-PCR in A549 and H1299 cells after knockdown of HIF-1α with two siRNAs (si-HIF-1α#1, si-HIF-1α#2) under normoxia condition. (C) The expression of AC020978 was evaluated by qRT-PCR in A549 and H1299 cells after knockdown of HIF-1α with two siRNAs (si-HIF-1α#1, si-HIF-1α#2) under hypoxia condition. (D) Schematic illustration of two putative HIF-1α binding sites (HRE1 and HRE2) in AC020978 gene promoter. (E-F) HEK293 cells were transfected with pGL3 reporter vector containing AC020978 wide-type promoter (HRE-WT), or mutant-type promoter (HRE-MUT), respectively. Those transfected cells were further treated under normoxia or hypoxia. After 48 h, firefly luciferase activity was detected and normalized by renilla activity. (G) ChIP assay with anti-HIF-1α antibody was performed to verify the binding between HIF-1α and two HREs in AC020978 promoter in A549 cells. (H-I) HEK293 cells were transfected with pGL3 reporter vector containing AC020978 wide-type promoter (HRE-WT), or mutant-type promoter (HRE-MUT), respectively. Those transfected cells were further treated with si-NC or siRNAs of HIF-1α (si-HIF-1α#1, si-HIF-1α#2). After 48 h, firefly luciferase activity was detected and normalized by renilla activity. Data shown are mean±SD (n = 3). (*P < 0.05, **P < 0.01, ***P < 0.001).
Figure 6
Figure 6
AC020978 interacts with PKM2 and regulate the stability of PKM2 protein. (A) Proteins retrieved from the AC020978 pull-down assay were analyzed by mass spectrometric analysis. (B) RIP assays using anti-PKM2 antibody showed that PKM2 interacted with AC020978 in A549 cells. The results of agarose electrophoresis of the PCR products are shown in the upper panel. The q-PCR results of RIP assays are shown in the bottom panel. (C) Western blot analysis of the proteins retrieved from the AC020978 pull-down assay, its antisense sequence was used as negative control. (D) Western blot showed that PKM2 protein level was positively regulated by AC020978 in A549 and H1299 cells. (E) A549 cell expressing either si-NC or si-0978 and H1299 cell expressing either vector or 0978-OE were treated with or without MG132 (50 µM) for 6 h. Cell lysates were analyzed by western blot with indicated antibodies. (F) A549 cell transfecting with si-NC or si-0978 and H1299 cell transfecting with pcDNA-vector or pcDNA-0978 were treated with cycloheximide (CHX, 100 ng/ml) for the indicated periods of time. Cell lysates were analyzed by western blot to examine PKM2 protein half-life. Protein band intensity was analyzed by ImageJ. (G) In vitro ubiquitination assay of cells transfected with si-0978 in A549 cell (left) or pcDNA-0978 in H1299 cell (right). All cells were co-transfected with flag-PKM2 and HA-UB plasmid, 42 h after transfection, cells were incubated with MG132 (50 µM) for 6 h. Cell lysates were immunoprecipitated with anti-flag antibody followed by immunoblotting analysis with anti-HA or anti-flag antibody. (H) Representative images of subcellular localization of PKM2 in A549 cells with different treatment by immunofluorescence. Cells were immunostained with anti-PKM2 (PKM2, green). The nucleus is marked with DAPI (blue). Merged images are shown. The line profiles of the mean fluorescence intensity of PKM2 and DAPI signals were measured by ImageJ software. (Scale bars=20 µm.) (I) Nuclear and cytosolic lysates were extracted from A549 and H1299 cells exposed to knockdown or overexpression of AC020978, followed by western blot analysis with indicated antibodies. Data shown are mean±SD (n = 3). (*P < 0.05, **P < 0.01, ***P < 0.001).
Figure 7
Figure 7
AC020978 regulates PKM2-enhanced HIF-1α transactivation activity. (A) Co-IP assay was performed to examine the PKM2-HIF-1α interaction in the AC020978-knockdown, AC020978-overexpressing and control groups. (B) In situ proximity ligation assay (PLA) on A549 cells demonstrated the interaction between PKM2 and HIF-1α in the AC020978-knockdown, AC020978-overexpressing and control groups. Positive PLA signals demonstrated PKM2/HIF-1α complex which were shown as red clusters, and cell nuclei were counterstained with blue (Scale bars=10 µm). (C) Transactivation activity of HEK293 cells co-transfected with expression vectors as indicated was measured by dual-luciferase report assay. The ratio of activity was normalized to the blank group at normoxia. (D) QRT-PCR analysis of GLUT1, ENO1, LDHA and PDK1 mRNAs in H1299 cells transduced with indicated plasmids or si-RNAs and exposed to 1% O2 for 24 h. (E) Schematic illustration of AC020978/ PKM2/ HIF-1α positive feedback loop in promoting glycolytic metabolism and tumorigenesis. Data shown are mean±SD (n = 3). (*P < 0.05, **P < 0.01, ***P < 0.001).

References

    1. Bray F, Ferlay J, Soerjomataram I, Siegel RL, Torre LA, Jemal A. Global cancer statistics 2018: GLOBOCAN estimates of incidence and mortality worldwide for 36 cancers in 185 countries. CA Cancer J Clin. 2018;68:394–424. - PubMed
    1. Ramalingam SS, Owonikoko TK, Khuri FR. Lung cancer: New biological insights and recent therapeutic advances. CA Cancer J Clin. 2011;61:91–112. - PubMed
    1. Subarsky P, Hill RP. The hypoxic tumour microenvironment and metastatic progression. Clin Exp Metastasis. 2003;20:237–50. - PubMed
    1. Vander Heiden MG, Cantley LC, Thompson CB. Understanding the Warburg effect: the metabolic requirements of cell proliferation. Science. 2009;324:1029–33. - PMC - PubMed
    1. Hanahan D, Weinberg RA. Hallmarks of cancer: the next generation. Cell. 2011;144:646–74. - PubMed

Publication types

MeSH terms