. 2020 Mar 26;10(11):4822-4838.
doi: 10.7150/thno.42387. eCollection 2020.

SIRT1-dependent mitochondrial biogenesis supports therapeutic effects of resveratrol against neurodevelopment damage by fluoride

Affiliations

SIRT1-dependent mitochondrial biogenesis supports therapeutic effects of resveratrol against neurodevelopment damage by fluoride

Qian Zhao et al. Theranostics. .

Abstract

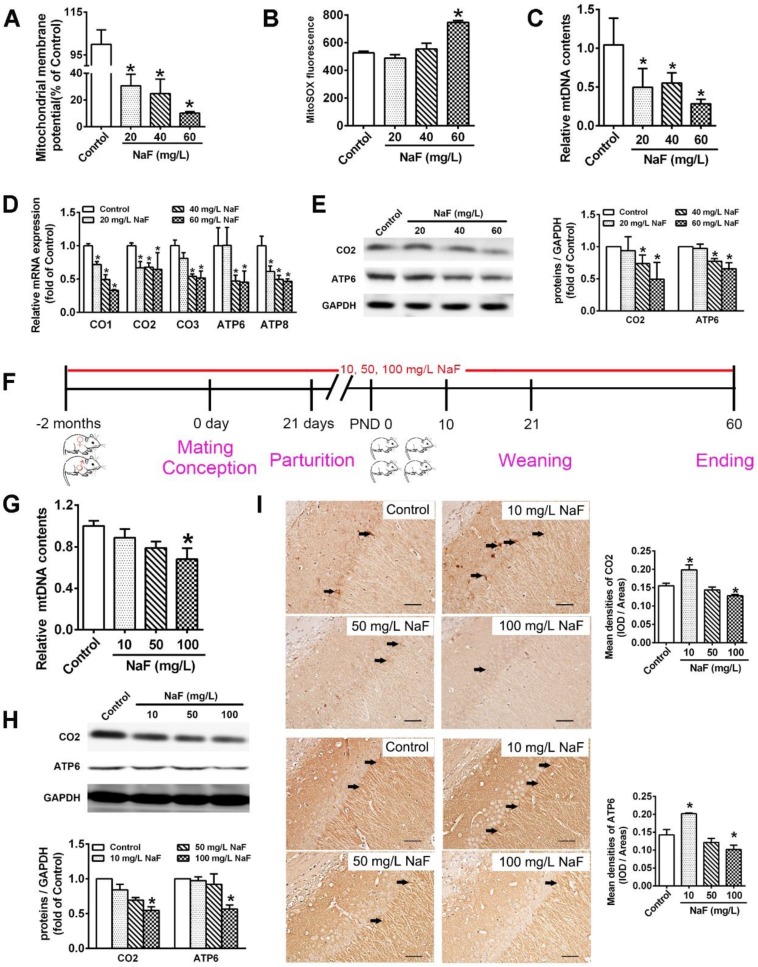
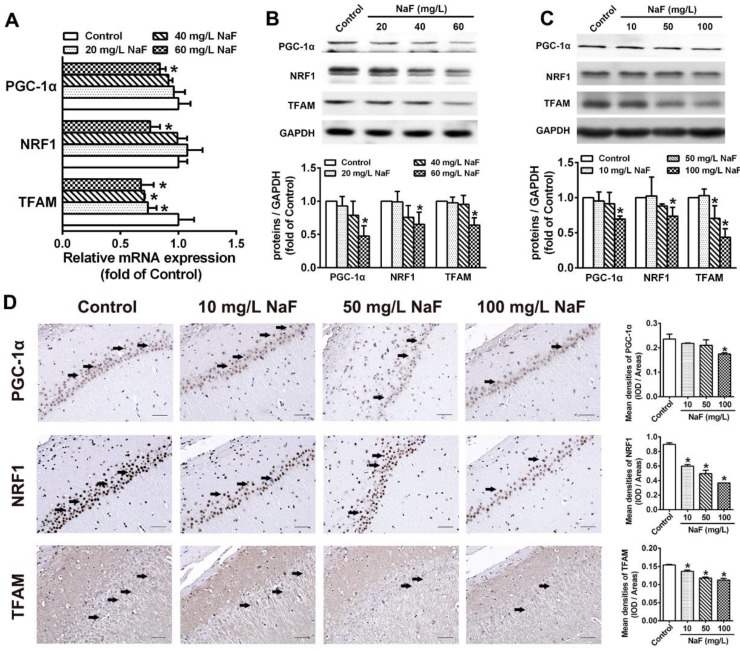
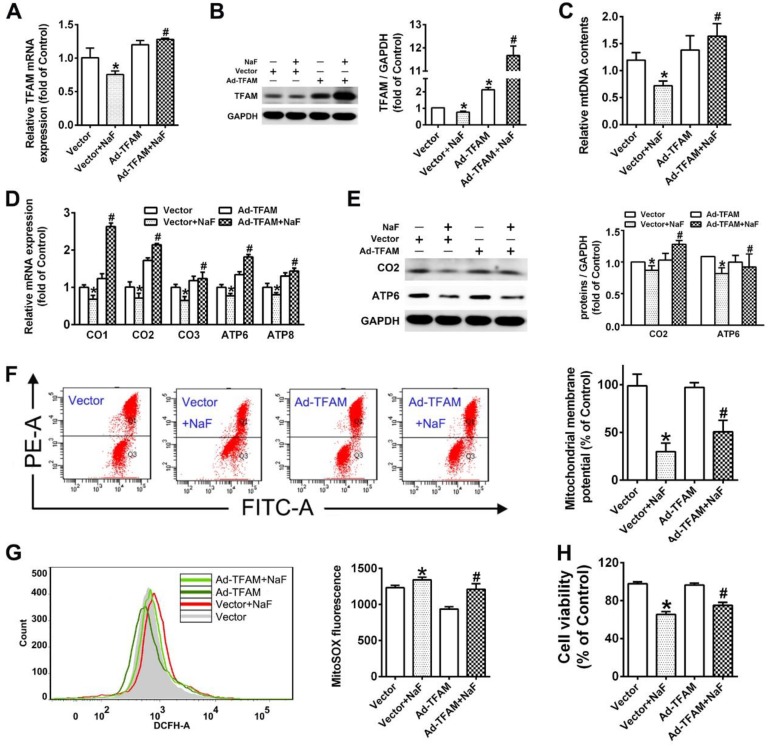
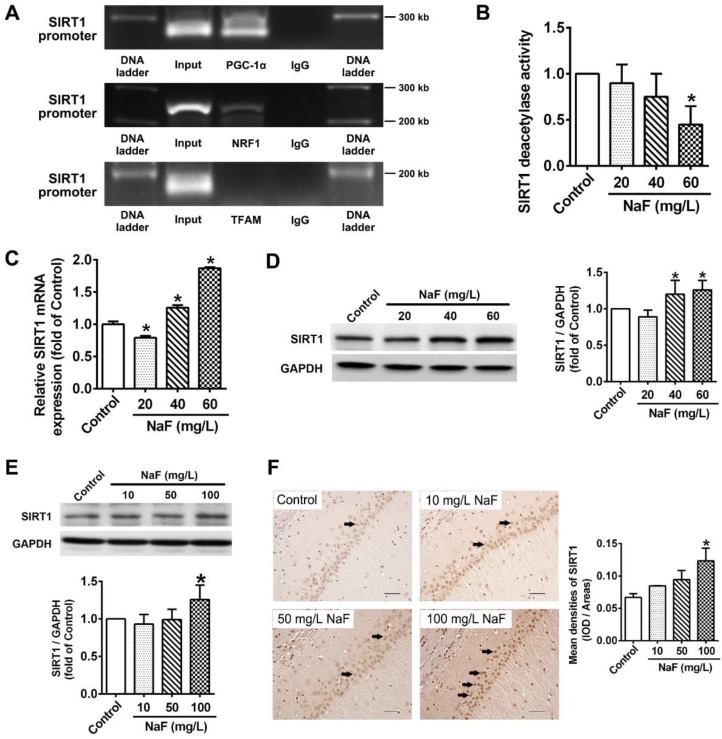
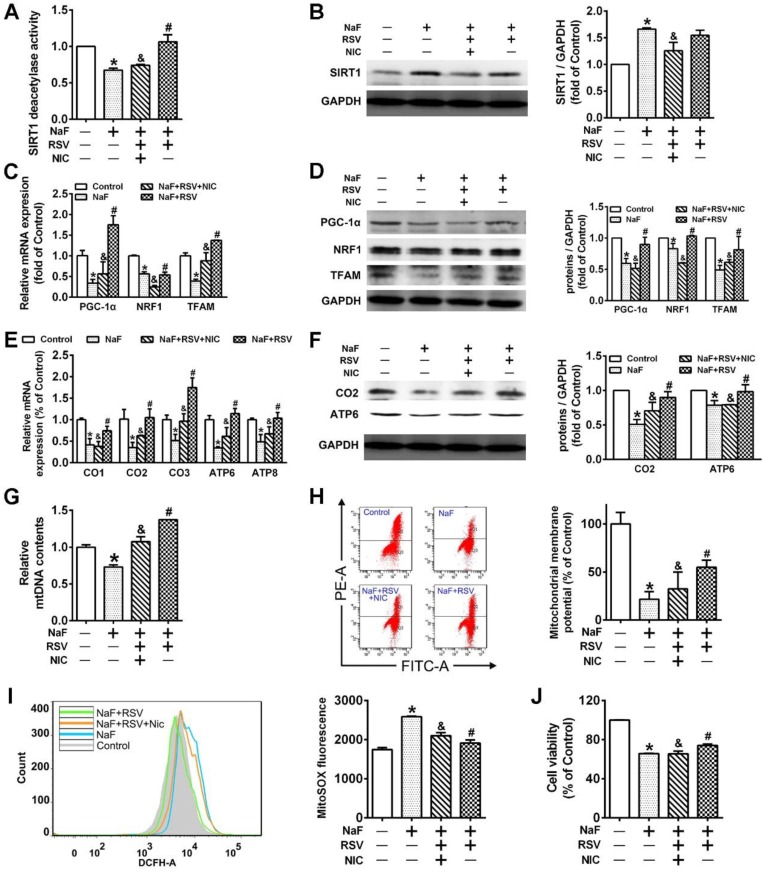
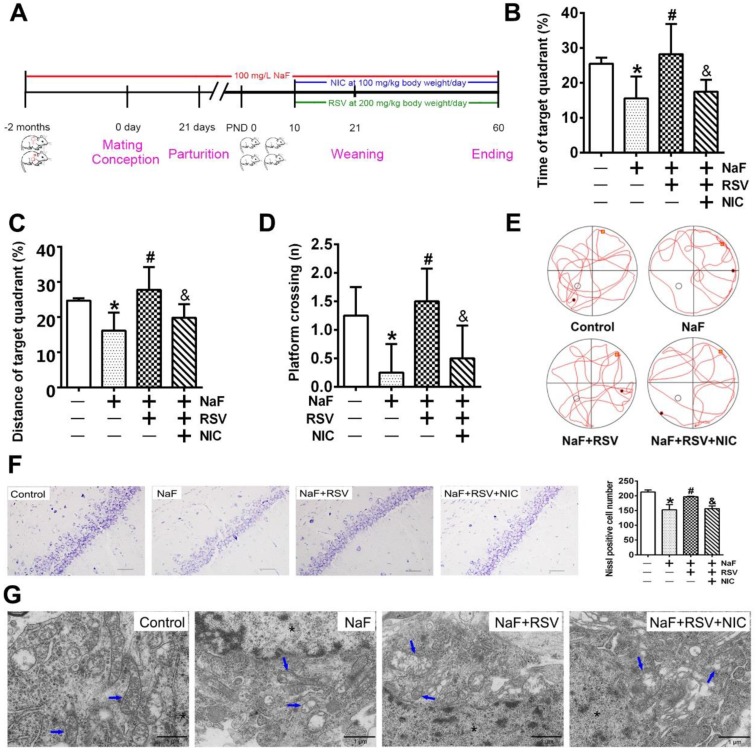
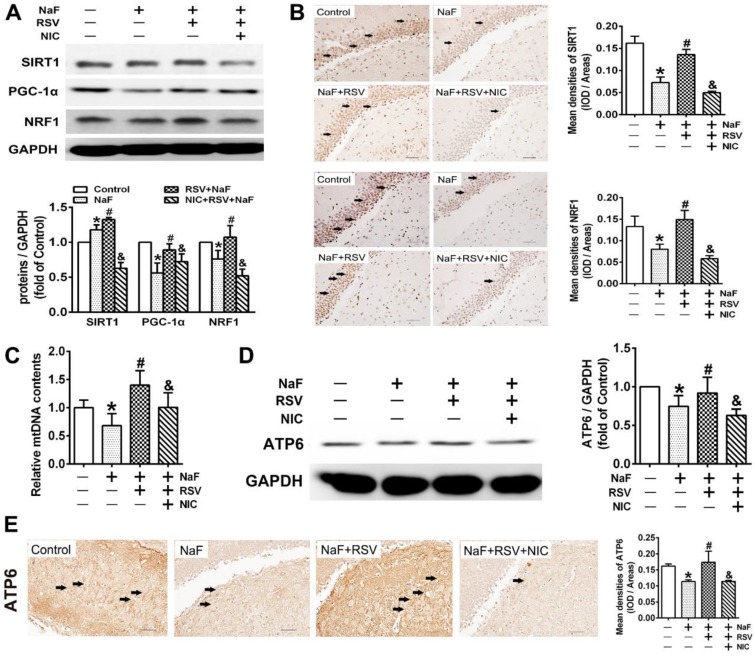
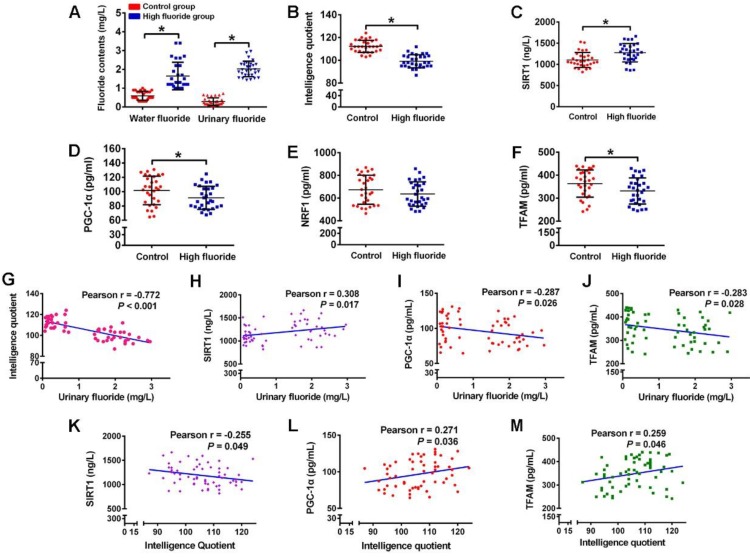
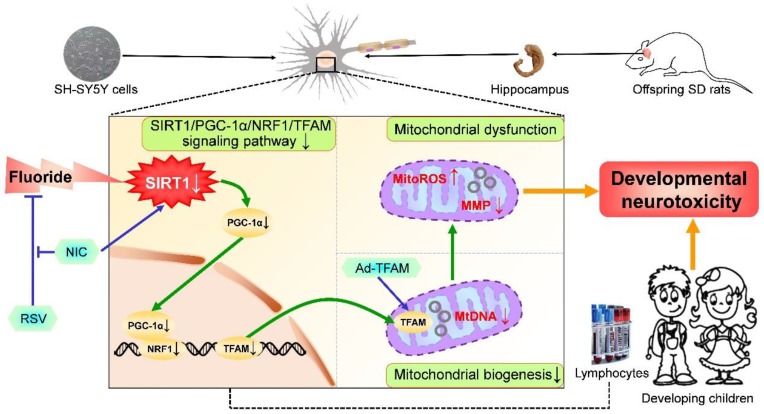
Rationale: Potential adverse effects of fluoride on neurodevelopment has been extensively explored and mitochondria have been recognized as critical targets. Mitochondrial biogenesis serves a crucial role in maintaining mitochondrial homeostasis and salubrious properties of resveratrol (RSV) has been well-defined. However, the molecular mechanisms governing mitochondrial biogenesis in developmental fluoride neurotoxicity remain unclear and the related therapeutic dietary agent is lacking. Methods: In vitro neuroblastoma SH-SY5Y cells and in vivo Sprague-Dawley rat model of developmental fluoride exposure were adopted. A total population of 60 children under long-term stable fluoride exposure were also recruited. This work used a combination of biochemical and behavioral techniques. Biochemical methods included analysis of mitochondrial function and mitochondrial biogenesis, as well as mRNA and protein expression of mitochondrial biogenesis signaling molecules, including silent information regulator 1 (SIRT1), peroxisome proliferator-activated receptor γ coactivator-1α (PGC-1α), nuclear respiratory factor 1 (NRF1) and mitochondrial transcription factor A (TFAM). Behavioral studies investigated spatial learning and memory ability of rats. Results: Both in vivo and in vitro experiments showed that sodium fluoride (NaF) caused mitochondrial dysfunction and impaired mitochondrial biogenesis. Also, NaF elevated SIRT1 levels and suppressed SIRT1 deacetylase activity along with decreased levels of PGC-1α, NRF1 and TFAM, suggestive of dysregulation of mitochondrial biogenesis signaling molecules. Moreover, enhancement of mitochondrial biogenesis by TFAM overexpression alleviated NaF-induced neuronal death through improving mitochondrial function in vitro. Further in vivo and in vitro studies identified RSV, the strongest specific SIRT1 activator, improved mitochondrial biogenesis and subsequent mitochondrial function to protect against developmental fluoride neurotoxicity via activating SIRT1-dependent PGC-1α/NRF1/TFAM signaling pathway. Noteworthy, epidemiological data indicated intimate correlations between disturbed circulating levels of mitochondrial biogenesis signaling molecules and fluoride-caused intellectual loss in children. Conclusions: Our data suggest the pivotal role of impaired mitochondrial biogenesis in developmental fluoride neurotoxicity and the underlying SIRT1 signaling dysfunction in such neurotoxic process, which emphasizes RSV as a potential therapeutic dietary agent for relieving developmental fluoride neurotoxicity.

Keywords: SIRT1; fluoride; mitochondrial biogenesis; neurodevelopmental damage; resveratrol.


Conflict of interest statement

Competing Interests: The authors have declared that no competing interest exists.

Figures

Figure 1
Figure 1
NaF causes mitochondrial dysfunction and mitochondrial biogenesis impairment in vitro and in vivo. (A, B) MMP levels (A) and mitoROS production (B) in SH-SY5Y cells determined by flow cytometry. (C, D) RT-qPCR analyses of relative mtDNA contents (C) and representative mtDNA-encoded genes including CO1, CO2, CO3, ATP6, ATP8 (D) in SH-SY5Y cells. Quantification represents the levels of the indicated ND4 and mRNA normalized to GAPDH. (E) Immunoblot analyses of CO2 and ATP6 in SH-SY5Y cells. Quantification represents the levels of the indicated protein normalized to GAPDH. (F) Experimental designs of a cohort of offspring rats subjected to NaF treatments with different concentrations. (G) RT-qPCR analyses of relative mtDNA contents in hippocampal tissues (n = 6 rats per group). (H) Immunoblot analyses of CO2 and ATP6 in hippocampal tissues (n = 3 rats per group). (I) Representative images of the IHC staining for CO2-expressing (CO2+) and ATP6-expressing (ATP6+) neurons in hippocampal CA1 region. CO2+ and ATP6+ neuronal cells are demonstrated by black arrows and quantified. Scale bars represent 50 μm, n = 2 rats per group. SH-SY5Y cells were treated with different concentrations of NaF (20, 40 and 60 mg/L). Offspring SD rats were developmentally exposed to NaF (10, 50 and 100 mg/L) from pre-pregnancy until 2 months of delivery. Data information: Data are presented as mean ± SD. Data were cumulative of at least three independent experiments (A-E). * P < 0.05 is considered significant compared with Control by one-way ANOVA test.
Figure 2
Figure 2
NaF triggers disruption of mitochondrial biogenesis signaling molecules in vitro and in vivo. (A, B) RT-qPCR (A) and immunoblot (B) analyses of PGC-1α, NRF1 and TFAM in SH-SY5Y cells. Quantification represents the levels of the indicated mRNA and protein normalized to GAPDH. (C) Immunoblot analyses of PGC-1α, NRF1 and TFAM in hippocampal tissues (n = 3 rats per group). (D) Representative images of the IHC staining for PGC-1α-expressing (PGC-1α+), NRF1-expressing (NRF1+) and TFAM-expressing (TFAM+) neurons in hippocampal CA1 region. PGC-1α+, NRF1+ and TFAM+ neuronal cells are demonstrated by black arrows and quantified. Scale bars represent 50 µm, n = 2 rats per group. Data information: Data are presented as mean ± SD. Data were cumulative of at least three independent experiments (A-B). * P < 0.05 is considered significant compared with Control by one-way ANOVA test.
Figure 3
Figure 3
Improved mitochondrial biogenesis by TFAM overexpression alleviates NaF-induced neuronal death by enhancing mitochondrial function. (A, B) RT-qPCR (A) and immunoblot (B) analyses of TFAM in SH-SY5Y cells. GAPDH was used as the internal control. (C) RT-qPCR analyses of relative mtDNA contents in SH-SY5Y cells. Quantification represents the levels of ND4 normalized to nuclear gene GAPDH. (D, E) RT-qPCR (D) and immunoblot (E) analyses of CO1, CO2, CO3, ATP6, ATP8 in SH-SY5Y cells. (F, G) Representative flow plots of MMP levels (F) and mitoROS production (G) in SH-SY5Y cells measured by flow cytometry. (H) Levels of cell viability in SH-SY5Y cells using CCK-8 assay. SH-SY5Y cells were infected with adenovirus overexpressing TFAM and 24 h later were treated with 60 mg/L NaF for 24 h. Data information: Data are presented as mean ± SD. Data were cumulative of at least three independent experiments. * P <0.05 is considered significant compared with Vector group and #P < 0.05 is considered significant from Vector+NaF group by one-way ANOVA test.
Figure 4
Figure 4
NaF exposure caused SIRT1 expression changes both in vitro and in vivo. (A) ChIP-PCR analyses for PGC-1α, NRF1 and TFAM binding to the SIRT1 promoter in SH-SY5Y cells. (B) SIRT1 deacetylase activity in SH-SY5Y cells measured by SIRT1 assay kits. (C, D) RT-qPCR (C) and immunoblot (D) analyses of SIRT1 in SH-SY5Y cells. Quantification represents the levels of the indicated mRNA and protein normalized to GAPDH. (E) Immunoblot analyses of SIRT1 in hippocampal tissues (n = 3 rats per group). (F) Representative images of the IHC staining for SIRT1-expressing (SIRT1+) neurons in hippocampal CA1 region. SIRT1+ neuronal cells are demonstrated by black arrows and quantified. Scale bars represent 50 μm, n = 2 rats per group. Data information: Data are presented as mean ± SD. Data were cumulative of at least three independent experiments (A-D). * P < 0.05 is considered significant compared with Control by one-way ANOVA test.
Figure 5
Figure 5
RSV protects cells from NaF-caused adverse neuronal effects via promoting SIRT1-depeendent PGC-1α-NRF1-TFAM signaling pathway. (A) SIRT1 deacetylase activity in SH-SY5Y cells using SIRT1 assay kit. (B) Immunoblot analysis of SIRT1 in SH-SY5Y cells and the corresponding quantification. (C, D) RT-qPCR (C) and immunoblot (D) analyses of PGC-1α, NRF1 and TFAM in SH-SY5Y cells. Quantification represents the levels of the indicated mRNA and protein normalized to GAPDH. (E, F) RT-qPCR (E) and immunoblot (F) analyses of representative subunits encoded by mtDNA in SH-SY5Y cells. Quantification represents the levels of the indicated mRNA and protein normalized to GAPDH. (G) RT-qPCR analysis of relative mtDNA contents in SH-SY5Y cells. (H, I) Representative flow plots of MMP levels (H) and mitoROS production (I) in SH-SY5Y cells using flow cytometry. (J) Levels of cell viability in SH-SY5Y cells determined by CCK-8 assay. SH-SY5Y cells were preincubated with 20 μM RSV for 2 h followed by co-culturing with 60 mg/L NaF and 3 mM NIC for 24 h. Data information: Data are presented as mean ± SD. Data were cumulative of at least three independent experiments. * P < 0.05 is considered significant compared with Control, #P < 0.05 is significantly different from NaF group and &P < 0.05 is considered significant from NaF+RSV group by one-way ANOVA test.
Figure 6
Figure 6
RSV alleviates neuronal injuries induced by NaF in vivo. (A) Experimental protocol designs of a cohort of offspring rats subjected to NaF, RSV or NIC treatments at various time point. (B, C) Time (B) and distance (C) offspring rats spent in the quadrant with the hidden plat form during spatial probe trial of MWM test (n = 5 rats per group). (D, E) Mean crossing numbers (D) and representative searching traces (E) of offspring rats traveling the target during spatial probe trial of MWM test. (F) Representative images of Nissl bodies in hippocampal CA1 region detected using Nissl staining (× 400 magnification) and Nissl-positive cells quantified. Scale bar represents 50 μm, n = 2 rats per group. (G) Representative images of neuronal mitochondrial ultrastructure of offspring rats shown by TEM (×6000 magnification). Nuclear was indicated as asterisk. Mitochondria were indicated by blue arrows. Scale bars represents 1 μm, n = 2 rats per group. Offspring SD rats were developmentally exposed to 100 mg/L NaF from pre-pregnancy until 2 months of delivery, during which 200 mg/kg body weight/day RSV or/and 100 mg/kg body weight/day NIC were administrated from PND10. Data information: Data are presented as mean ± SD. * P < 0.05 is considered significant compared with Control, # P < 0.05 is significantly different from NaF group and & P < 0.05 is considered significant from NaF+RSV group by one-way ANOVA test.
Figure 7
Figure 7
RSV improves SIRT1-relied mitochondrial biogenesis process in NaF-injured hippocampal tissues of offspring rats. (A) Immunoblot analyses of SIRT1, PGC-1 and NRF1 in hippocampal tissues (n = 3 rats per group). GAPDH was used as the internal control. (B) Representative images of the IHC staining for SIRT1+ and NRF1+ neurons in hippocampal DG region. SIRT1+ and NRF1+ neuronal cells are demonstrated by black arrows and quantified. Scale bars represent 50 μm, n = 2 rats per group. (C) RT-qPCR analyses of relative mtDNA contents in hippocampal tissues (n = 6 rats per group). (D) Immunoblot analyses of ATP6 in hippocampal tissues (n = 3 rats per group). (E) Representative images of the IHC staining for ATP6+ neurons in hippocampal DG region. ATP6+ neuronal cells are demonstrated by black arrows and quantified. Scale bars represent 50 μm, n = 2 rats per group. Data information: Data are presented as mean ± SD. * P < 0.05 is considered significant compared with Control, # P < 0.05 is significantly different from NaF group and &P < 0.05 is considered significant from NaF+RSV group by one-way ANOVA test.
Figure 8
Figure 8
Disturbance of circulating mitochondrial biogenesis signaling molecules are associated with intelligence loss in children. (A) Fluoride concentration in drinking water and urine determined by a standardized ion selective electrode method. (B) Intelligence quotient (IQ) scores of children measured by CRT-RC2. (C-F) Levels of circulating SIRT1 (C), PGC-1α (D), NRF1 (E) and TFAM (F) in peripheral blood lymphocytes detected by ELISA assay. (G-J) Correlation between urinary fluoride concentration and IQ scores (G), as well as circulating SIRT1 (H), PGC-1α (I), TFAM (J) levels. (K-M) Correlation between IQ scores and circulating SIRT1 (K), PGC-1α (L), TFAM (M) levels. A total of 30 children in control areas and 30 children in high fluoride areas in Tianjin, China were recruited randomly. Data information: Data are presented as mean ± SD. Detailed statistical tests were shown as unpaired two-tailed Student's t test (A-F) and Pearson correlation coefficient analysis (G-M). * P < 0.05 is considered significant compared with Control.
Figure 9
Figure 9
A proposed model for the role of mitochondrial biogenesis process in developmental fluoride neurotoxicity and protective action of RSV. Mitochondrial biogenesis process plays a vital role in developmental fluoride neurotoxicity. Improvement in mitochondrial biogenesis by TFAM overexpression causes restoration of mitochondrial function, thus alleviating neurotoxic effects of fluoride. Importantly, RSV protects against developmental fluoride neurotoxicity by enhancing mitochondrial biogenesis and function activated by SIRT1-dependent PGC-1α/NRF1/TFAM signaling pathway, which is suppressed by SIRT1 antagonist NIC. Images of hippocampus, vacuum blood-collection tubes and developmental children were modified from http://p.ayxbk.com/image s/5/5b/Hippocampus_and_seahorse_cropped.JPG; https://www.hellorf.com/image/show/146119724?source=zcool&term=tubes%20prepared, and http://www.jianbihua.cc/renwu/31334_2.html, respectively, with permission.

Similar articles

Cited by

References

    1. Edition F. Guidelines for drinking-water quality. WHO chronicle. 2011;38:104–8. - PubMed
    1. Zhang L, Huang DZ, Yang J, Wei X, Qin J, Ou S. et al. Probabilistic risk assessment of Chinese residents' exposure to fluoride in improved drinking water in endemic fluorosis areas. Environ Pollut. 2017;222:118–25. - PubMed
    1. Khandare AL, Validandi V, Gourineni SR, Gopalan V, Nagalla B. Dose-dependent effect of fluoride on clinical and subclinical indices of fluorosis in school going children and its mitigation by supply of safe drinking water for 5 years: an Indian study. Environ Monit Assess. 2018;190:110. - PubMed
    1. Yousefi M, Ghoochani M, Hossein Mahvi A. Health risk assessment to fluoride in drinking water of rural residents living in the Poldasht city, Northwest of Iran. Ecotoxicol Environ Saf. 2018;148:426–30. - PubMed
    1. Choi AL, Sun G, Zhang Y, Grandjean P. Developmental fluoride neurotoxicity: a systematic review and meta-analysis. Environ Health Perspect. 2012;120:1362–8. - PMC - PubMed

Publication types

MeSH terms