. 2020 Apr 6;5(14):7928-7939.
doi: 10.1021/acsomega.9b04244. eCollection 2020 Apr 14.

Triamcinolone Acetonide-Loaded PEGylated Microemulsion for the Posterior Segment of Eye

Affiliations

Triamcinolone Acetonide-Loaded PEGylated Microemulsion for the Posterior Segment of Eye

Kritika Nayak et al. ACS Omega. .

Abstract

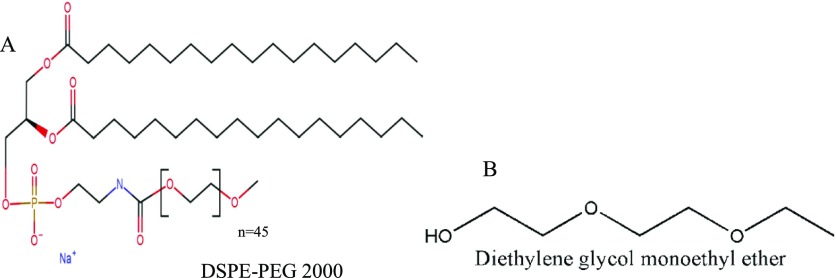
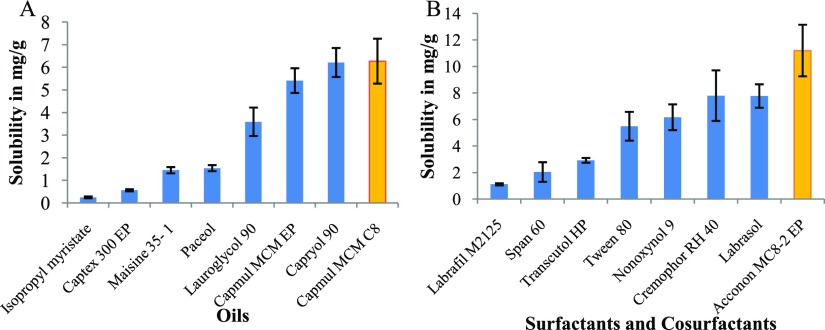
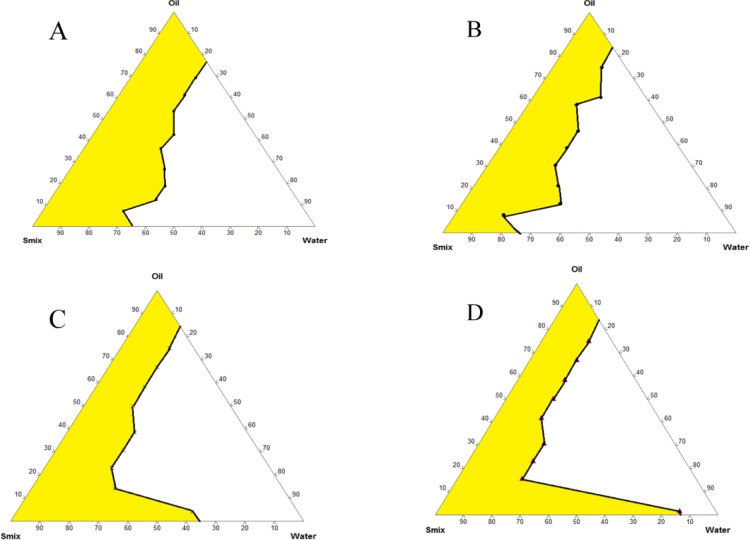
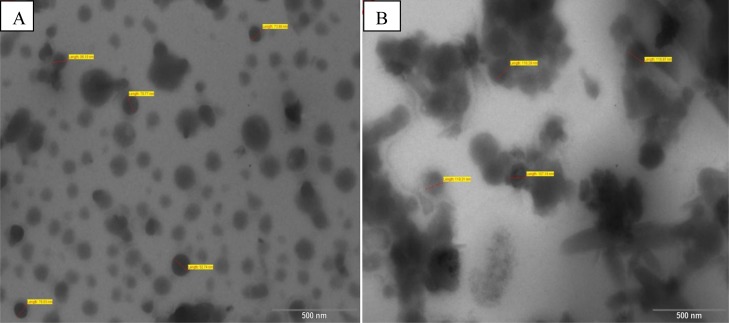
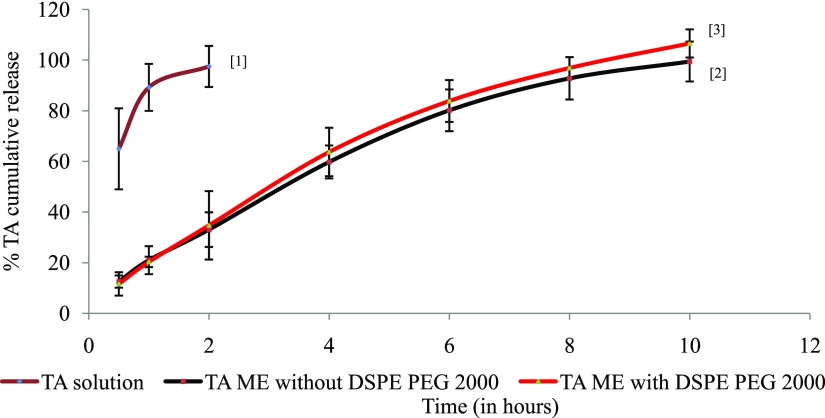
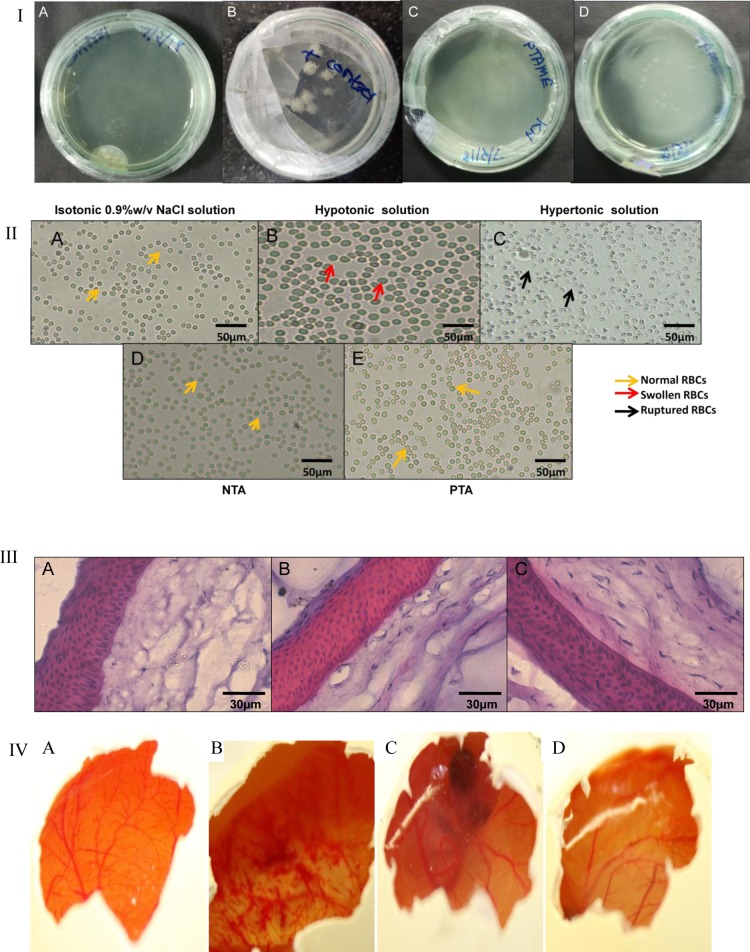
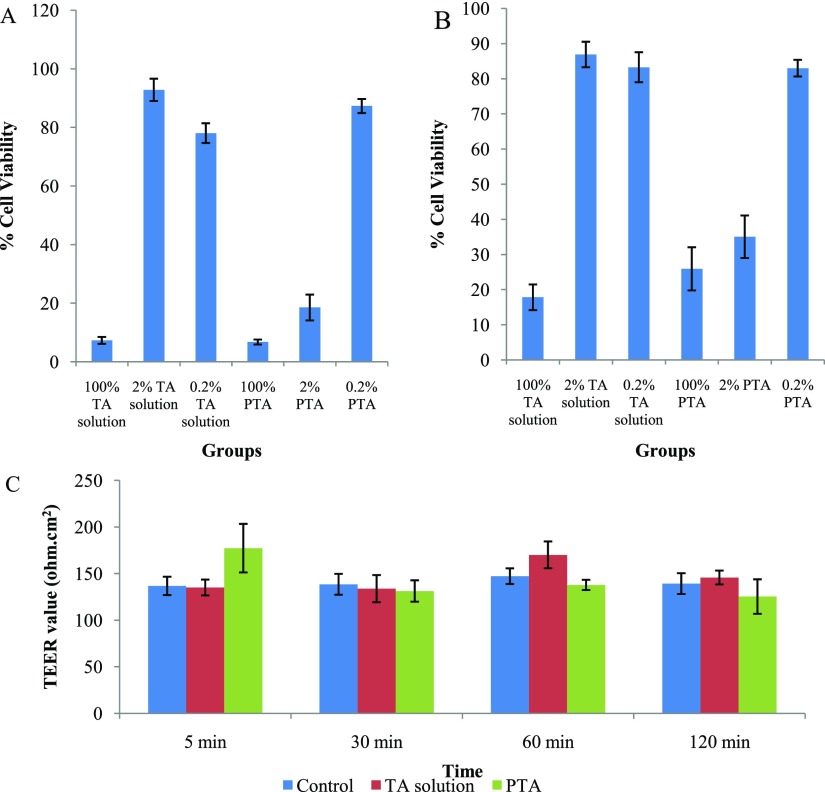
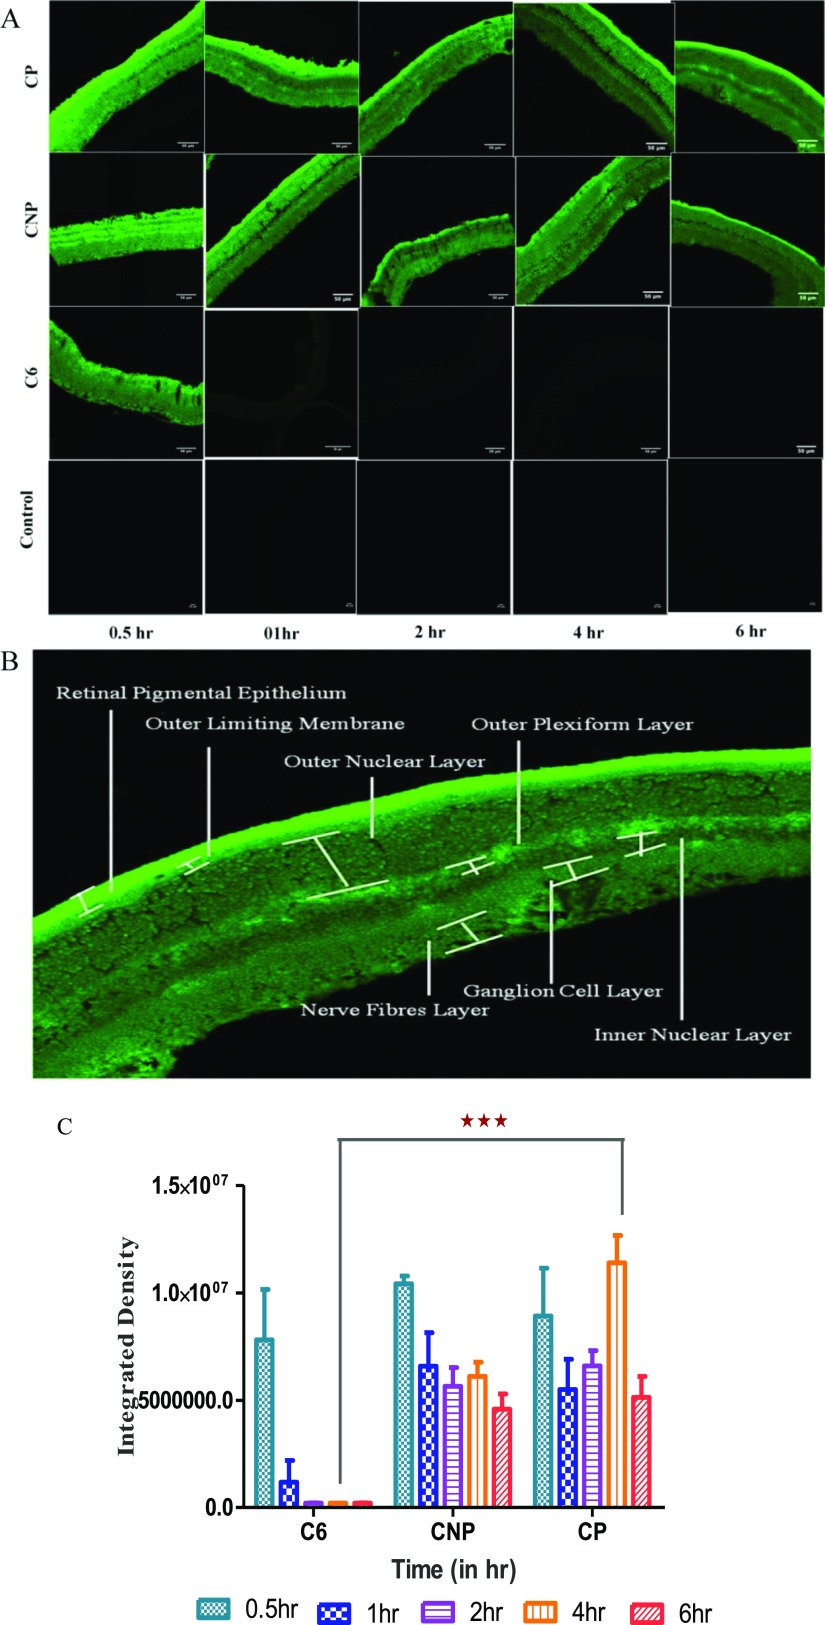
Present work investigates the possibility of a polyethyleneglycolylated (PEGylated) microemulsion (ME) to deliver drug to the posterior segment of eye. Triamcinolone acetonide (TA), a widely used drug in intraocular diseases, was selected as the model drug. Based on solubility and emulsification capacity, components of microemulsion were selected and optimum formulation was obtained using a pseudoternary phase diagram. The optimized ratio of Capmul MCM C8 (oil): AccononMC8-2 (surfactant): Transcutol (cosurfactant): deionized water was 5:35.5:4.5:55. This was further PEGylated using 1,2-distearoylphosphatylethanolamine-polyethyleneglycol 2000 (DSPE-PEG 2000). This PEGylated ME loaded with TA was characterized and evaluated in vitro, ex vivo, and in vivo for topical ocular use. The developed PEGylated ME loaded with TA was homogenous, stable, and nonirritable to eye and had the ability to reach the posterior segment of eye on topical instillation.


Conflict of interest statement

The authors declare no competing financial interest.

Figures

Figure 1
Figure 1
Structure of (A) DSPE-PEG 2000 and (B) transcutol HP (diethylene glycol monoethyl ether).
Figure 2
Figure 2
Solubility of TA in (A) oils and (B) surfactants and cosurfactants. Values are in mean ± SD (n = 3).
Figure 3
Figure 3
Pseudoternary phase diagram using Capmul MCM C8 as oil and mixture of Acconon MC8-2 EP and transcutol HP (Smix) in different ratios; (A) 1:1, (B) 2:1, (C) 4:1, and (D) 8:1.
Figure 4
Figure 4
TEM images of (A) NTA and (B) PTA.
Figure 5
Figure 5
In vitro TA release pattern from TA solution[1], NTA[2], and PTA[3]. Values were in mean ± % RSD (n = 3).
Figure 6
Figure 6
(I) Sterility test; images of culture plates in incubation with (A) saline solution, (B) positive control, (C) PTA and (D) NTA. (II) Isotonicity test with RBCs treated with (A) saline solution, (B) hypotonic solution, (C) hypertonic solution, (D) NTA, and (E) PTA observed under a microscope, (III) H and E staining on corneal sections treated with (A) saline solution, (B) NTA and (C) PTA; observed under a microscope. (IV) Images after 3 h of HET-CAM test on hen’s eggs treated with (A) saline solution, (B) NaOH solution, (C) NTA, and (D) PTA.
Figure 7
Figure 7
MTT assay with PTA at different dilutions on (A) SIRC and (B) ARPE-19 cell lines with comparison to TA solution. (C) TEER value determination of SIRC cell line on instillation of TA solution, and PTA at different time points (5 min, 0.5, 1 and 2 h) with comparison to control group (cells without any treatment). Values were in mean ± SD, n = 3.
Figure 8
Figure 8
In vivo pharmacokinetic study on Sprague Dawley rats. (A) Images (scale bar 50 μm) of retina of rat eye by a CLSM after definite time duration of topical instillation of 5 μL of C6 solution, CNP, CP as compared to control eye (untreated contralateral eye) (in images of C6, CNP, and CP groups, zoom factor 3 was applied to make retinal layers more distinguishable while same was not applied in control group) (B) representative image of retina observed under a CLSM showing different layers and (C) graph showing comparison of raw integration density observed after instillation of different formulation (CNP and CP) and C6 solution at definite time points. Values were obtained using ImageJ software and were in mean ± SD, n = 3. ***Indicates the significant difference in fluorescence observed at 4 h of instillation of topical dosage of CP as compared to other groups (P < 0.001).

References

    1. Nayak K.; Misra M. A Review on Recent Drug Delivery Systems for Posterior Segment of Eye. Biomed. Pharmacother. 2018, 107, 1564–1582. 10.1016/j.biopha.2018.08.138. - DOI - PubMed
    1. Gupta A.; Nayak K.; Misra M. Cow ghee fortified ocular topical microemulsion; in vitro, ex vivo, and in vivo evaluation. J. Microencapsulation 2019, 36, 603–621. 10.1080/02652048.2019.1662121. - DOI - PubMed
    1. Varma R.; Bressler N. M.; Doan Q. V.; Gleeson M.; Danese M.; Bower J. K.; Selvin E.; Dolan C.; Fine J.; Colman S.; et al. Prevalence of and Risk Factors for Diabetic Macular Edema in the United States. JAMA Ophthalmol. 2014, 132, 1334–1340. 10.1001/jamaophthalmol.2014.2854. - DOI - PMC - PubMed
    1. Fangueiro J. F.; Silva A. M.; Garcia M. L.; Souto E. B. Current Nanotechnology Approaches for the Treatment and Management of Diabetic Retinopathy. Eur. J. Pharm. Biopharm. 2015, 95, 307–322. 10.1016/j.ejpb.2014.12.023. - DOI - PubMed
    1. Velpandian T.Pharmacology of Ocular Therapeutics; Velpandian T., Ed.; Springer International Publishing, 2016.